If we review the sea-ice extent in the Antarctic over the past few weeks, we can see an exciting trend – and not just in our potential interpretations, but also when we compare the current situation to sea-ice conditions in previous years.
On 24.01.2019, the Antarctic sea ice extent was 3.17 million km² (see Figure 1). Since November 2018, the sea-ice extent around the Antarctic continent has remained below the double standard deviation from the long-term average for 1981 to 2010 – a similar situation to what we saw in 2017 and 2016 (see Figure 2). From mid-December 2018, the sea-ice extent in the Antarctic dropped rapidly and was 4.94 million km² at the end of December, the lowest value for this month since the beginning of regular satellite observations. If we consider the monthly means for November and December (Figure 3), the last three years all lie below the long-term trend and are characterised by the smallest amount of sea-ice cover during the Antarctic spring. What explains the dwindling ice?
Whereas in the spring of 2016, the year with the lowest recorded sea-ice extent in November and December, a changed wind field (Southern Annual Mode – SAM index – in the negative phase, see also the meereisportal.de news article from December 2016), together with a quasi-stationary low-pressure area over the Amundsen Sea, was the main reason for the rapid loss of ice, this year it’s proven difficult to precisely identify the cause. One important reason for these difficulties is the lack of daily climatological data, which would allow us to assess the wind direction (and with it, the ice drift) and temperature trends above the sea ice. Normally the National Oceanographic and Atmospheric Administration (NOAA) provides this data on a daily basis. However, the current shutdown in the US government has also affected these services; the data needed for analysis isn’t available. Accordingly, we can only speculate as to the cause of the rapid decline in December 2018. Once this climatological data becomes available again, we’ll be able to conduct the analyses and more meaningfully interpret the situation.
Generally speaking, however, there are three potential reasons for the accelerated sea-ice retreat in spring. As previously mentioned, a shift in the prevailing westerlies (SAM index) can cause the sea ice to break up, and the changed ice drift can promote sea-ice export. However, based on the available data, this seems highly unlikely, given that the SAM index was positive from September to early December 2018. Another potential explanation: the intensified rise of warmer water masses, which melt the sea ice from below. Generally speaking, a warming of the intermediate water masses in the Antarctic can be observed; however, this only produces extremely gradual effects and cannot produce short-term events like that seen in December, which took place in only a few weeks. The third potential explanation is that the inflow of warmer air masses can contribute to intensified sea-ice melting. But here, too, we’re missing the indicators and spatial data that could confirm this being the source of the development. That being said, a preliminary assessment of data from stations in the Antarctic doesn’t show any unusual inflows of warm air in December.
Unlike the case in the Artic, the sea-ice distribution in the Antarctic is highly regionalised in nature, as a result of which local air pressure systems can also influence the sea-ice extent. Consequently, the map of the difference in sea-ice extent compared to the long-term average reflects anomalous regions in the Amundsen and Weddell Seas in December 2018 (Figure 4). A precise chronological analysis is provided farther below. In the meantime, the sea-ice extent in the Antarctic is once again within the double standard deviation range.
Analysis of the current ice situation in the Antarctic
In November 2016, the anomaly in sea-ice extent was chiefly to be seen in Eastern Antarctica between 20° and 75°E and in the Ross Sea, while we observed a slight increase in sea-ice extent in the Amundsen Sea. In comparison, in December 2016 the anomaly that produced less sea ice in the east shifted farther to the west. As a result, regions with sea-ice levels below the long-term average were above all seen in the Weddell Sea (30°W to 45°E); in addition, the opening of the Weddell Sea polynya significantly contributed to the sea-ice loss.
In 2018, too, the mean sea-ice extent in November revealed that both the Weddell Sea and Ross Sea, as the primary sites for a potentially negative sea-ice anomaly, could once again dominate the sea-ice situation for the entire Antarctic Ocean. If we then compare the fourteen-day maps of sea-ice extent in December 2018 and January 2019 with the corresponding data from previous years, especially the “minimum year” 2016, they confirm the indicated anomaly during the southern early summer. For example, in the first half of December (1 to 15 December) the sea-ice extent was somewhat higher in the Ross and Weddell Seas, whereas the ice margin in the eastern Amundsen Sea continued to retreat (Figure 5a). In the second half of the month (16 to 31 December), the ice margin in the eastern Amundsen Sea retreated considerably farther, and the sea-ice extent in the Weddell Sea also dropped below the 2016 level (Figure 5b).
The consequences of these lower sea-ice concentrations could be clearly seen in the sea-ice extent just one month later: in the first half of January, both sectors of the ice-covered Southern Ocean were home to a clearly recognisable negative anomaly, which translates into a significantly lower sea-ice extent (Figure 5c). Particularly in the eastern Amundsen Sea and western Ross Sea, the ice continues to retreat and is poised to become the lowest historical sea-ice extent in January. At the same time, the region between 20° and 60° E is characterised by more sea ice than in the past. These anomalies continue to be visible throughout January. However, the strong initial changes are slowly stagnating, and the Antarctic-wide sea-ice extent levels are gradually becoming more like those from the previous year (Figure 5d). Nevertheless, it is essential that we not only continue to monitor the Antarctic sea-ice extent as a whole, but also identify and understand regional differences.
Antarctic Expedition PS117
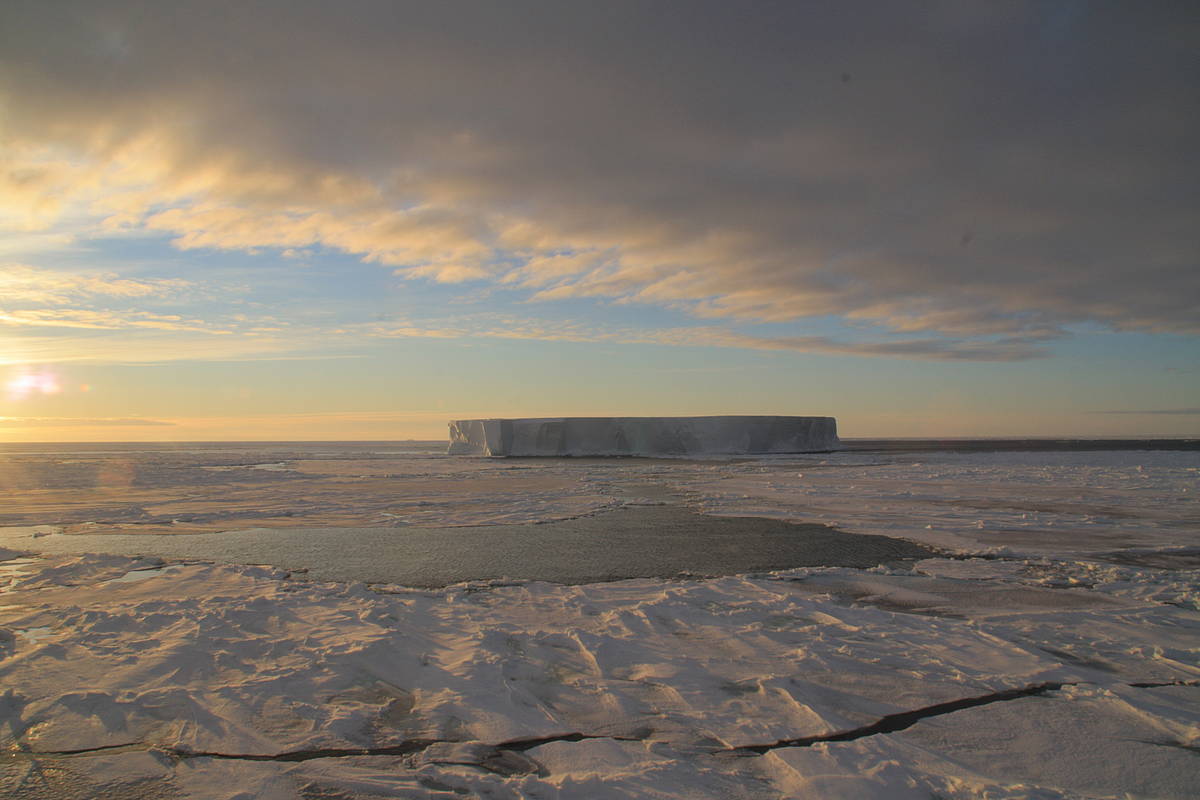
The German research icebreaker RV Polarstern is currently in one of the regions where the interannual variability of the sea-ice anomaly is most pronounced: the Weddell Sea. In past expeditions, the ship had to break through far more ice at this time of year in order to complete its scientific agenda, as expedition head Olaf Boebel reports: “This year we’ve actually had difficulties finding suitable ice floes where we could conduct the planned marine biology experiments. But in terms of our plotted course and staying on the Polarstern’s schedule, the conditions are of course excellent.” And not everyone on board is happy about the lack of ice in the Weddell Sea (Figure 6).
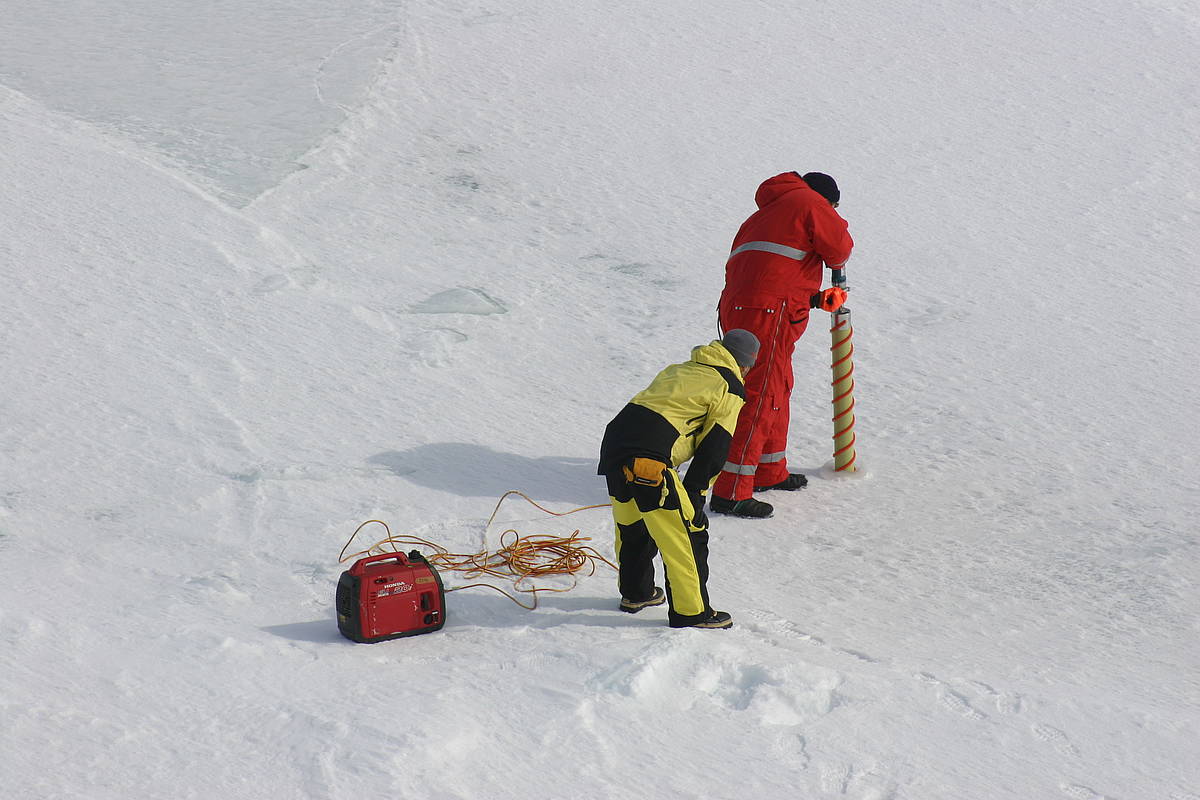
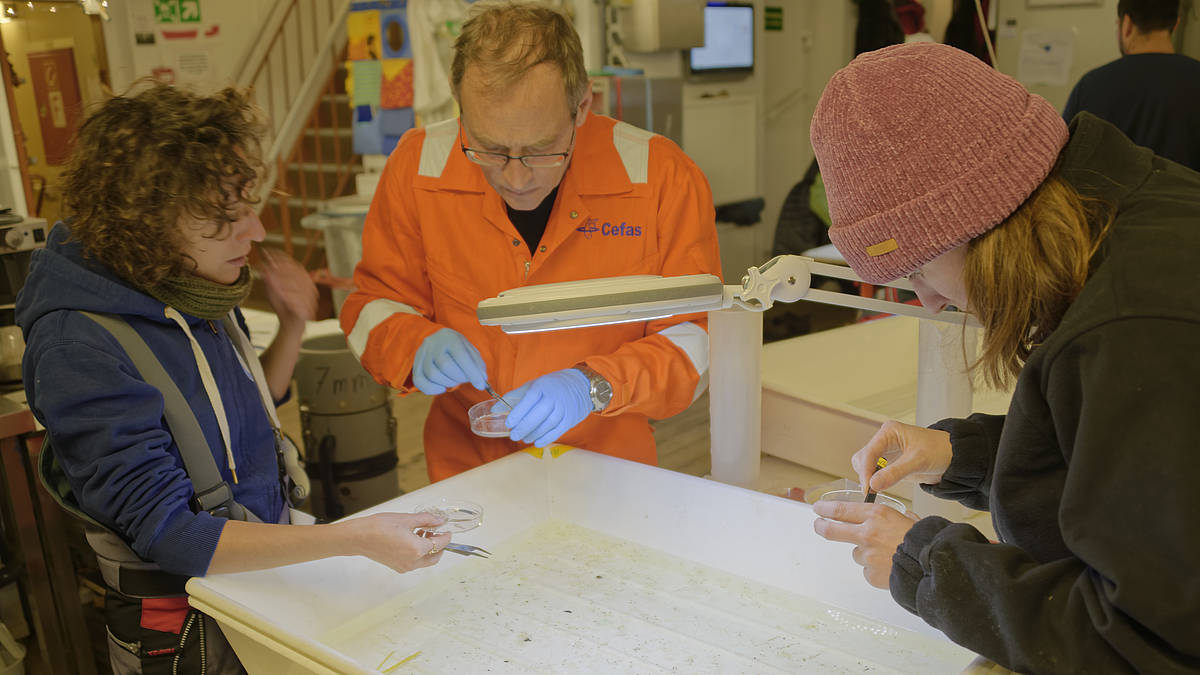
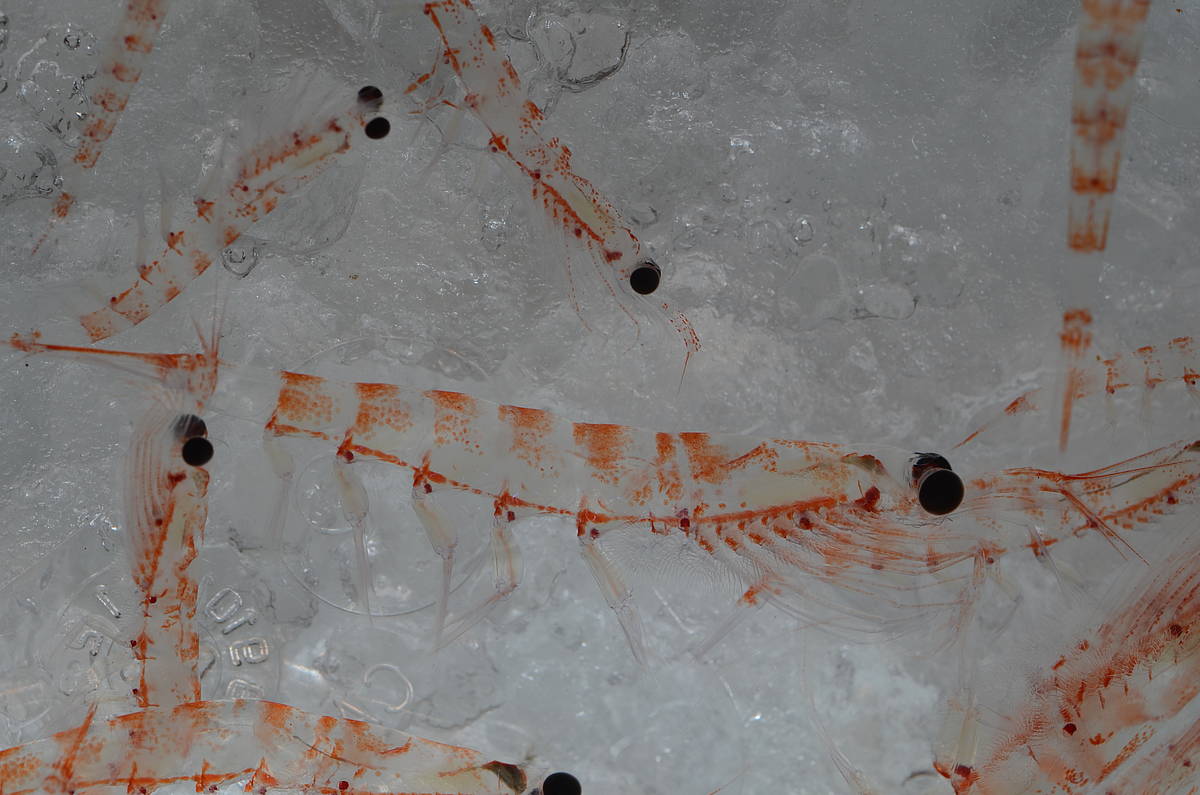
The sea-ice researchers Dr Giulia Castellani (AWI) and Dr Klaus Meiners (Australian Antarctic Division) have a very different view on the matter. Their work involves measuring the amount of sunlight below the ice, which determines the growth of phytoplankton. These algae grow in and underneath the ice, and form the basis for the food chain in the Southern Ocean: as a food source for the Antarctic krill, which is in turn eaten by whales, seals and penguins.
Klaus Meiners explains the current expedition: “On this expedition, we hope to gain new insights into the role of sea ice in the Antarctic ecosystem. Our goal is to understand which type of sea ice, in terms of ice thickness and snow thickness, offers a good habitat for algae and krill.” Giulia Castellani adds: “In the course of this expedition, we’ll have the opportunity to investigate the sea-ice ecosystem in a year with an especially low sea-ice extent. Another of our goals is to arrive at a better understanding of what ice-covered and ice-free regions mean for the distribution and growth of Antarctic krill and zooplankton” (Figures 6c and d).
If we take a closer look at the ice maps for the past several weeks, we can see another small anomaly on the Weddell-Sea side of the Antarctic Peninsula: here, near 65°S there is a polynya with less sea ice than in past years. This is due to the iceberg A-68, which calved from the Larsen C Ice Shelf in the summer of 2017, and which prevents the sea ice in the region from drifting farther north (see Figure 7). Taken together with the large-scale changes in sea-ice extent and concentration observed in the Weddell Sea, this raises a number of intriguing questions: To what extent does A-68 influence ice thickness and drift in the region? How thick is the sea ice in that part of the Weddell Sea that remains covered with sea ice all year-round? How will the observed changes affect the snow cover on the sea ice? In pursuit of the answers to these and other questions, in just a few days’ time Prof. Christian Haas, Dr Stefanie Arndt and their sea-ice team, together with 50 other researchers, will board the RV Polarstern in Punta Arenas – after the research team and ship’s crew led by Dr Olaf Boebel have completed their journey.
During this expedition, on the way to the Larsen C Ice Shelf, the researchers plan to investigate and survey the current state of the ice-covered ocean, and to compare what they find with data gathered in the region in 2004 and 2006 so as to identify potential changes. “On the two previous expeditions to this region, we learned a great deal about seasonal snow-melting processes on the Antarctic sea ice, which often fail to produce any significant melting; in many cases, in the course of the seasonal cycle, the snow structure is the only thing that changes,” explains Prof. Haas, who also led the on-board sea-ice programme back then. “As such, on this expedition it will be interesting for us to see, on the one hand, whether the observed changes in sea-ice extent are reflected in the snow characteristics; on the other, we’ve taken similar readings on snow characteristics during expeditions to the eastern Weddell Sea, and that raises the question as to how substantially the characteristics differ between the two areas,” adds sea-ice physicist Dr Stefanie Arndt, who took these readings in previous years.
In addition, the snow cover plays an important part in the region’s biology: if the amount of snow cover becomes too great in relation to the ice thickness, it can push the ice below the water’s surface, so that seawater reaches the boundary layer between the sea ice and snow – and with it, organisms living in the upper water column. “That’s why, on this year’s expedition, one of our top priorities is to take advantage of our team’s interdisciplinary nature and quantify, for the first time, the interrelations between sea-ice thickness, snow characteristics, biomass and biogeochemical processes in the ocean / sea ice / snow system,” says Prof. Christian Haas, summarising the on-board work that lies in store for his team.
Contacts
- Prof. Dr. Christian Haas (AWI)
- Dr. Stefanie Arndt (AWI)
- Dr. Monica Ionita-Scholz (AWI)
- Dr. Hauke Flores (AWI)
Questions?
Contact us via E-Mail or our contact form.
Graphics


