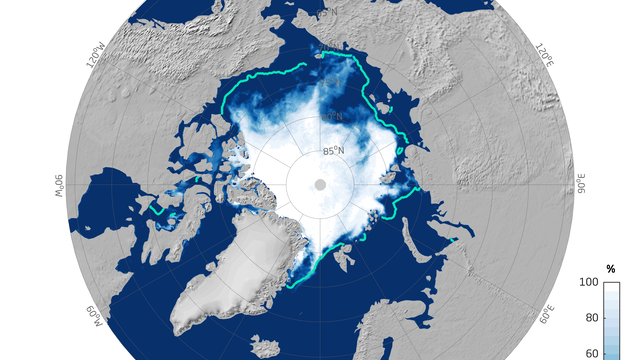
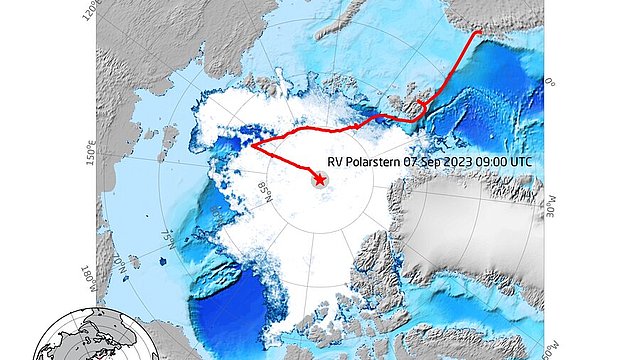
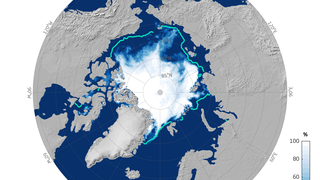
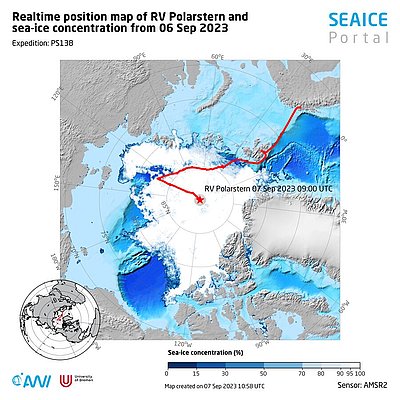
The Arctic sea ice is currently below the levels seen in 2022 but clearly above the record minimum from 2012. Every September, the Arctic sea-ice extent reaches its annual minimum. On 7 September the ice extent was 4.56 million km², placing it at the lower range of the extents for the period 1981 – 2010 (Figure 1). The mean ice extent in August was 5.51 million km², matching the ninth-lowest extent since the beginning of continuous satellite observation in 1979 (Figures 2 and 3). Whereas the sea ice in the sector north of the Canadian Arctic Archipelago, near Greenland and in the Central Arctic was chiefly characterised by compact ice cover, the Beaufort Sea and East Siberian Sea were nearly ice-free. This year, both the Northeast and Northwest Passage are ice-free and navigable (Figure 4).
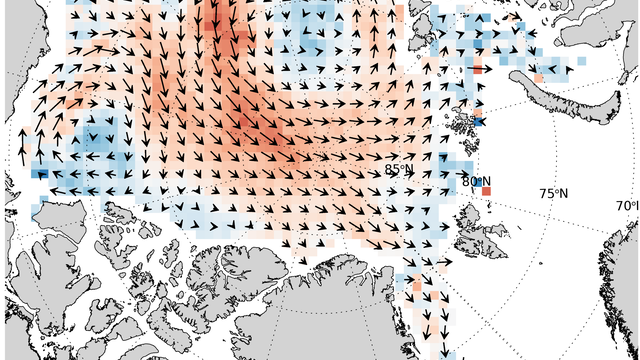
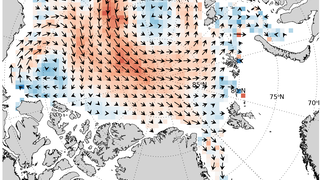
The comparatively large ice extent could be due to the influence of regular low-pressure systems in the Central Arctic this summer. “These produced a somewhat unusual ice drift, with ice masses from the Central Arctic drifting into the Laptev Sea,” says Prof Christian Haas, Head of the AWI’s Sea Ice Section. Thanks to the steady flow of ice from the north (visible in Figure 5), parts of the Russian marginal seas currently have comparatively high ice cover.
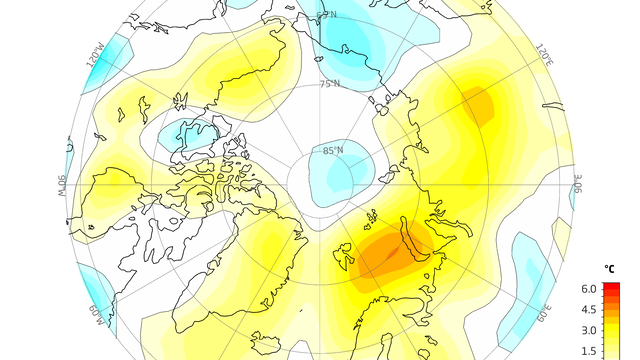
If we take a look at the climatological conditions in the atmosphere and ocean in August, we can recognise increased sea surface temperatures of up to 4° C above the reference period 2013 – 2022 in much of the Arctic, but also in the inflow areas of the North Atlantic and North Pacific (Figure 6). The air temperature at 925 hPa (ca. 760 m) was between 2° and 3° Celsius in August the reference period 2013 – 2022; in the Barents Sea it was more than 6° Celsius (Figure 7). These warm conditions at the ice’s surface and underside can influence melting. Especially at the beginning of the month, significant ice retreat was observed. However, it should be borne in mind that, when these warm water masses flow below the ice, they collide with other masses that are not only far colder but also far less saline. Consequently, these water masses under the sea ice are much lighter than the inflowing warm but high-saline masses, causing the warmer ones to sink below them and lessening their direct effect on the sea ice.
It remains to be seen how the melting will develop between now and mid-September, when the minimum ice extent will most likely be reached. Compared to the past several years, the conditions to date haven’t been extreme, though they do continue the trend of reduced summer sea-ice extents (Figure 3).
IceBird aerial survey campaign for ice thickness in summer 2023
In addition to ice extent, ice thickness is an important parameter for characterising sea-ice development. In order to measure the ice thickness in late summer, the AWI conducts regular flights over the pack ice north of Greenland and in Fram Strait between the 80th and 86th N parallels with a research aeroplane. These measurements are taken using electromagnetic inductive (EM) scanning; an EM sensor (“EM-Bird”) is towed behind the aircraft at a height of 15 m above the ice.
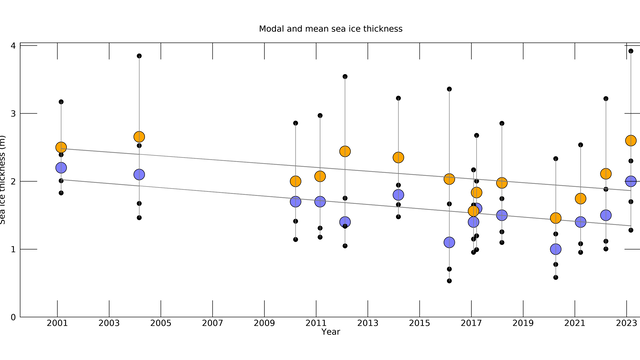
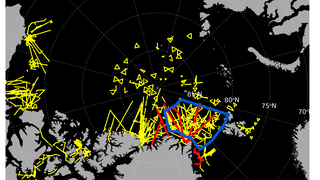
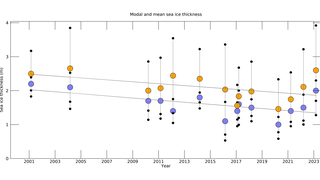
This year’s IceBird Summer Campaign with the research aeroplane Polar-5 was led by Professor Christian Haas. The aerial campaign took place from 15 to 25 August, launching from Station Nord, Greenland, and included seven thickness-measuring flights. The map (Figure 8) shows all measurements taken with aeroplanes and helicopters in the Arctic since the 1990s; those from this summer are marked in red. For the area circled in blue in Figure 8, a time series of the ice thicknesses was prepared (Figure 9). The data for 2023 shows significantly thicker ice in Fram Strait and north of Greenland than in previous years (both the mean and modal value). The ice thicknesses observed this year are the highest since 2007 and can be attributed to the unusual sea-ice drift (Figure 5). This year, the majority of multiyear ice in the region surveyed came from the Beaufort Sea. This ice is older, thicker and more deformed than the ice that normally drifts into the region from the Russian marginal seas. As Christian Haas adds: “However, when you analyse the different ice classes and origins separately, it becomes clear that this year, the younger ice in the Transpolar Drift had a fairly average thickness. Our next task will be to analyse the outcomes of the aerial campaign in more detail.”
A look at the sea-ice prediction for this year’s minimum
The mean value for the pan-Arctic sea-ice extent in September, predicted in August as part of the Sea Ice Outlooks, was 4.60 million km² with interquartile values of 4.35 and 4.80 million km². The extrema were 2.88 and 5.47 million km². The two lowest prognoses predict a new record for the minimum sea-ice extent in September (the current record is from September 2012: a sea-ice extent of 3.57 million km²). On the basis of the consensus, then, we can expect to see a sea-ice extent in September 2023 that is slightly above the long-term, linearly declining trend; however, a new record low is unlikely.
Contact
Questions?
Write us an
email or use the contact form.
Graphics

