CryoSat-2, a radar altimeter satellite of the European Space Agency (ESA), had its eighth birthday on April 8, 2018. Observations from CryoSat-2 add vital information on sea ice thickness to other satellite observations, such as sea ice concentration, drift and extent. The method to obtain sea ice thickness from CryoSat-2 is limited to the Arctic winter from October through April when the radar is not disturbed by melting snow. The latest winter observation cycle is now complete and we can compare the sea ice thickness from CryoSat-2 with those of the previous seven winters. “In summary, sea ice thickness observations from the last winter illustrate that extremes in sea ice extent are not necessarily paralleled by the average thickness of all remaining ice.”, explained Dr. Stefan Hendricks of AWI. “Marginal ice regions with anomalous low ice extent however show the expected below-average thicknesses. Observations from CryoSat-2 are important to observe and analyze the history of processes that lead to the current sea ice thickness, the memory of the ice cover”, adds his colleague Dr. Robert Ricker.
Key Facts
- CryoSat-2 concluded its annual Arctic winter sea ice thickness observations between October and April.
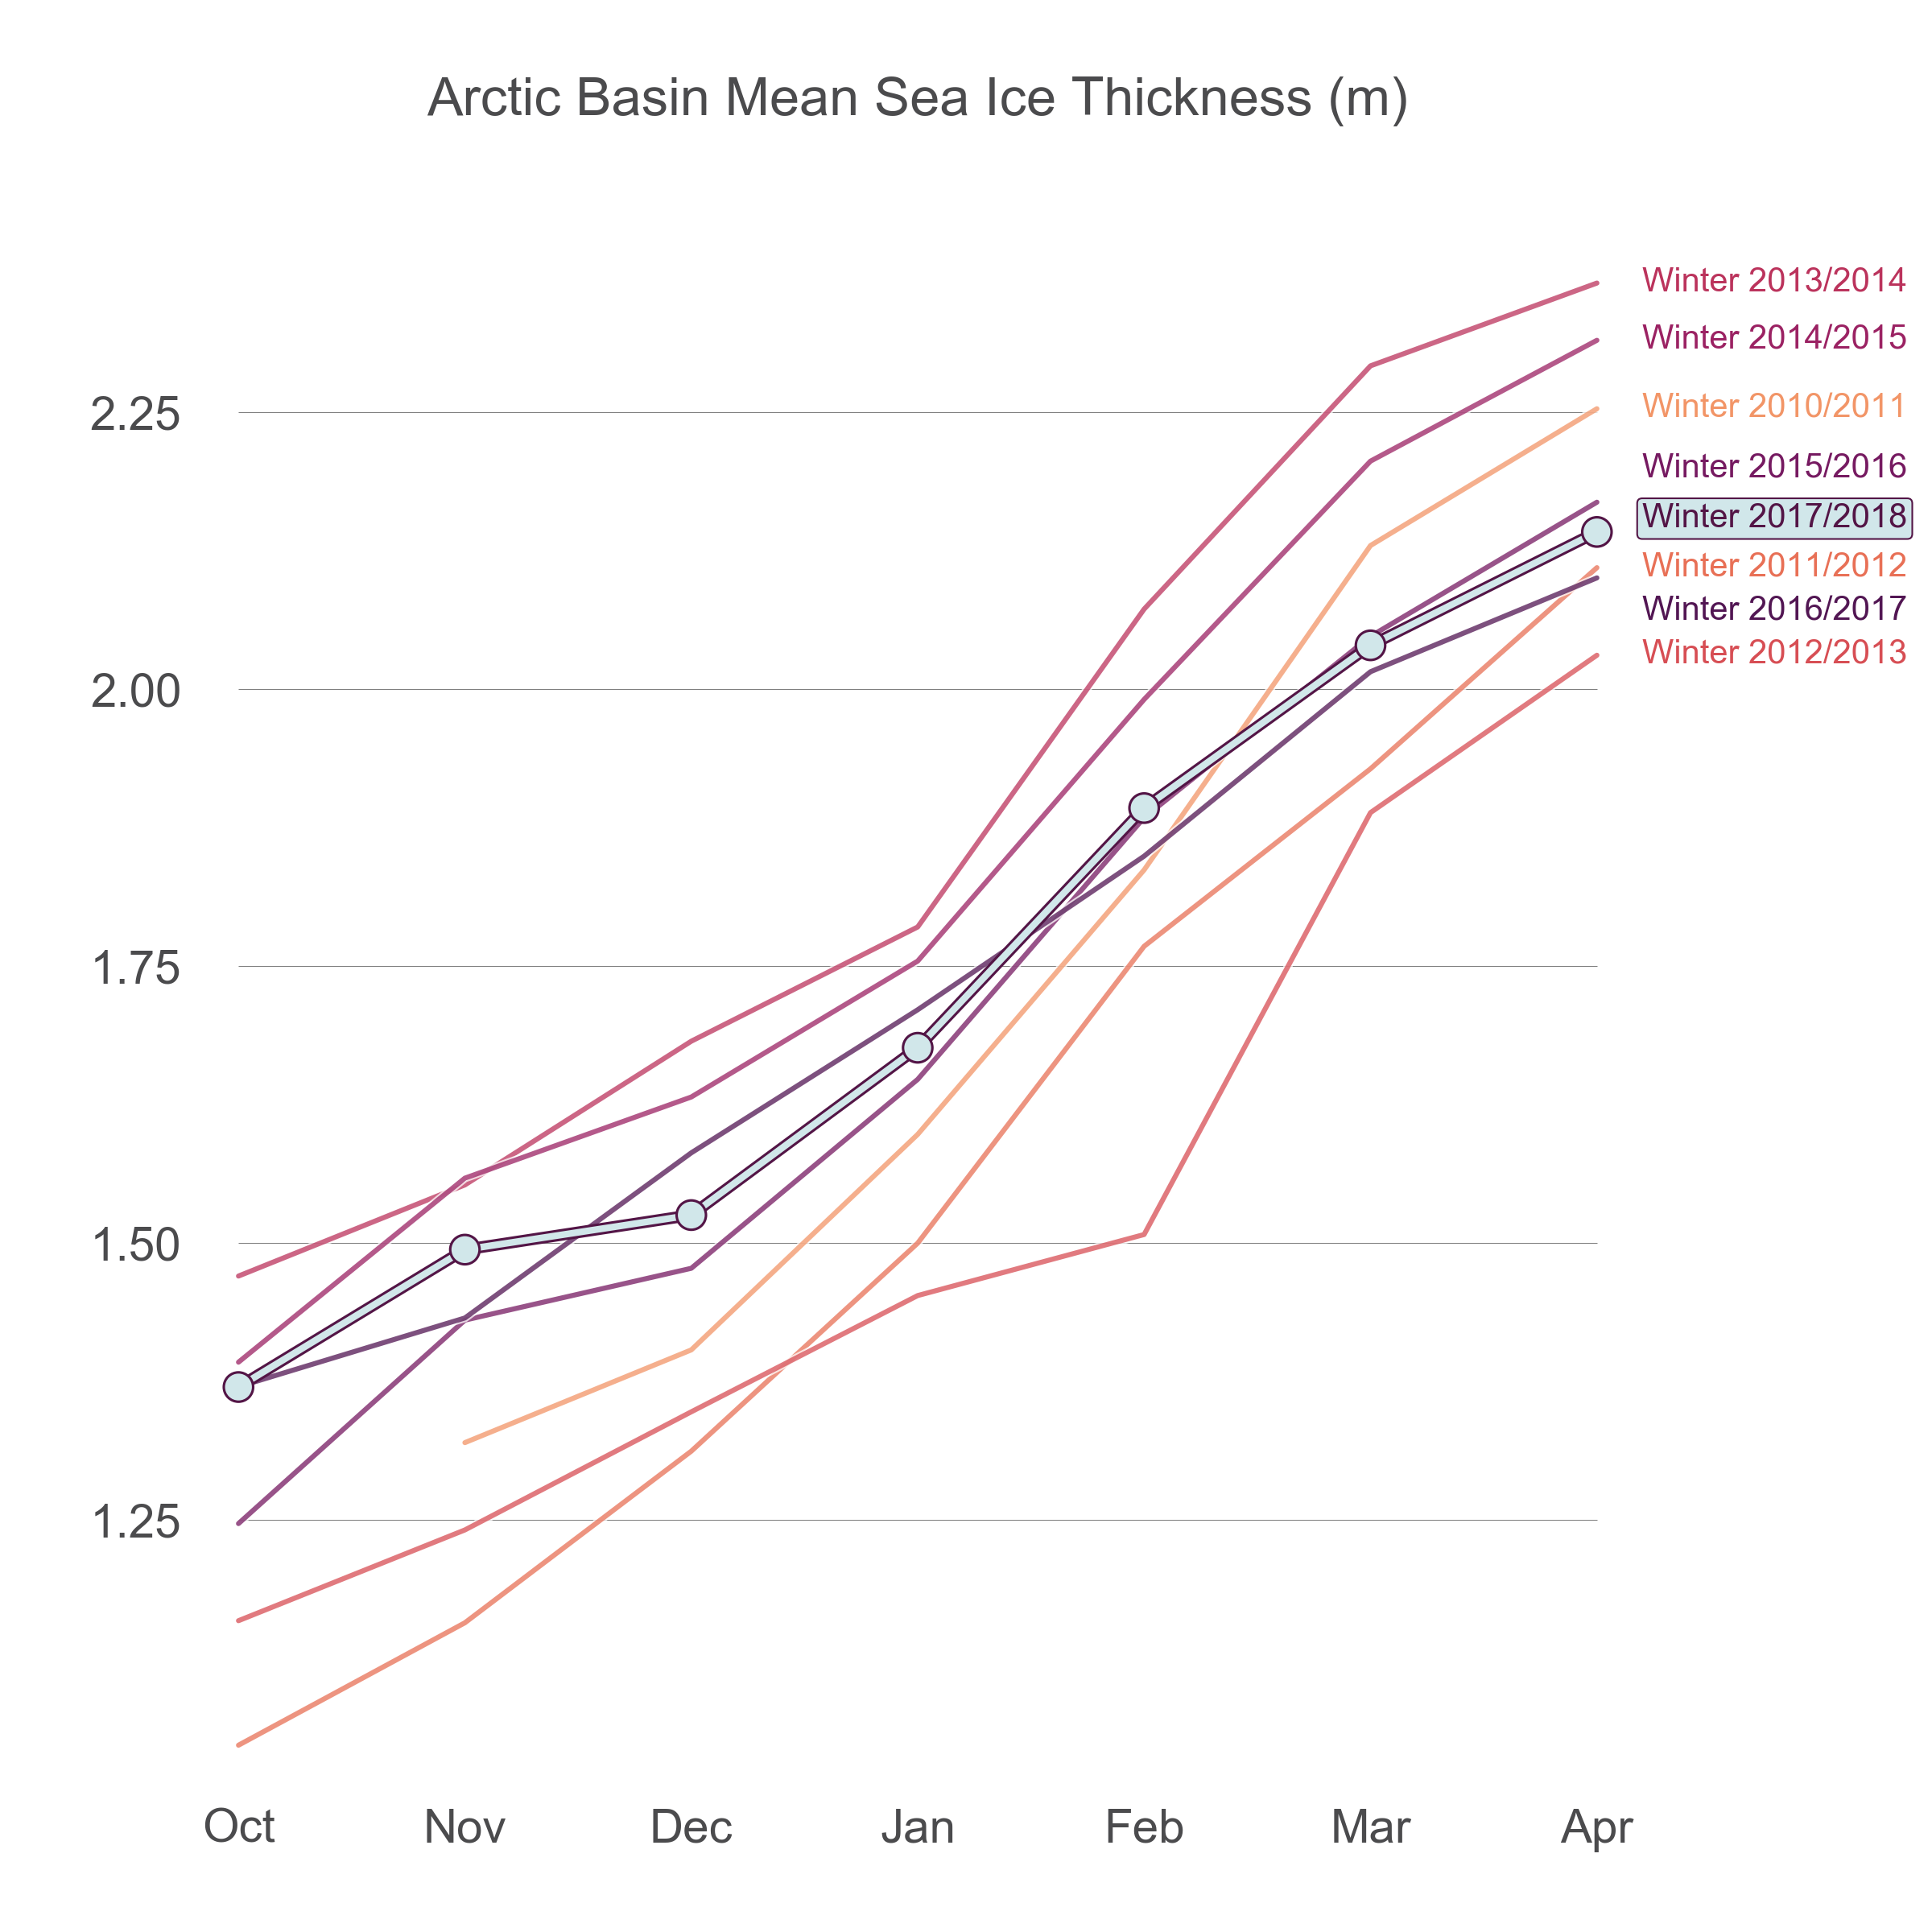
- Mean sea ice thickness in the Central Arctic Basin in April 2018 was 2.14 m, slightly lower than the average (2.19 m) of the previous seven winters in the CryoSat-2 data record.
- The average thickness is the result of above-average thickness in October 2017 in combinations with below-average winter ice growth.
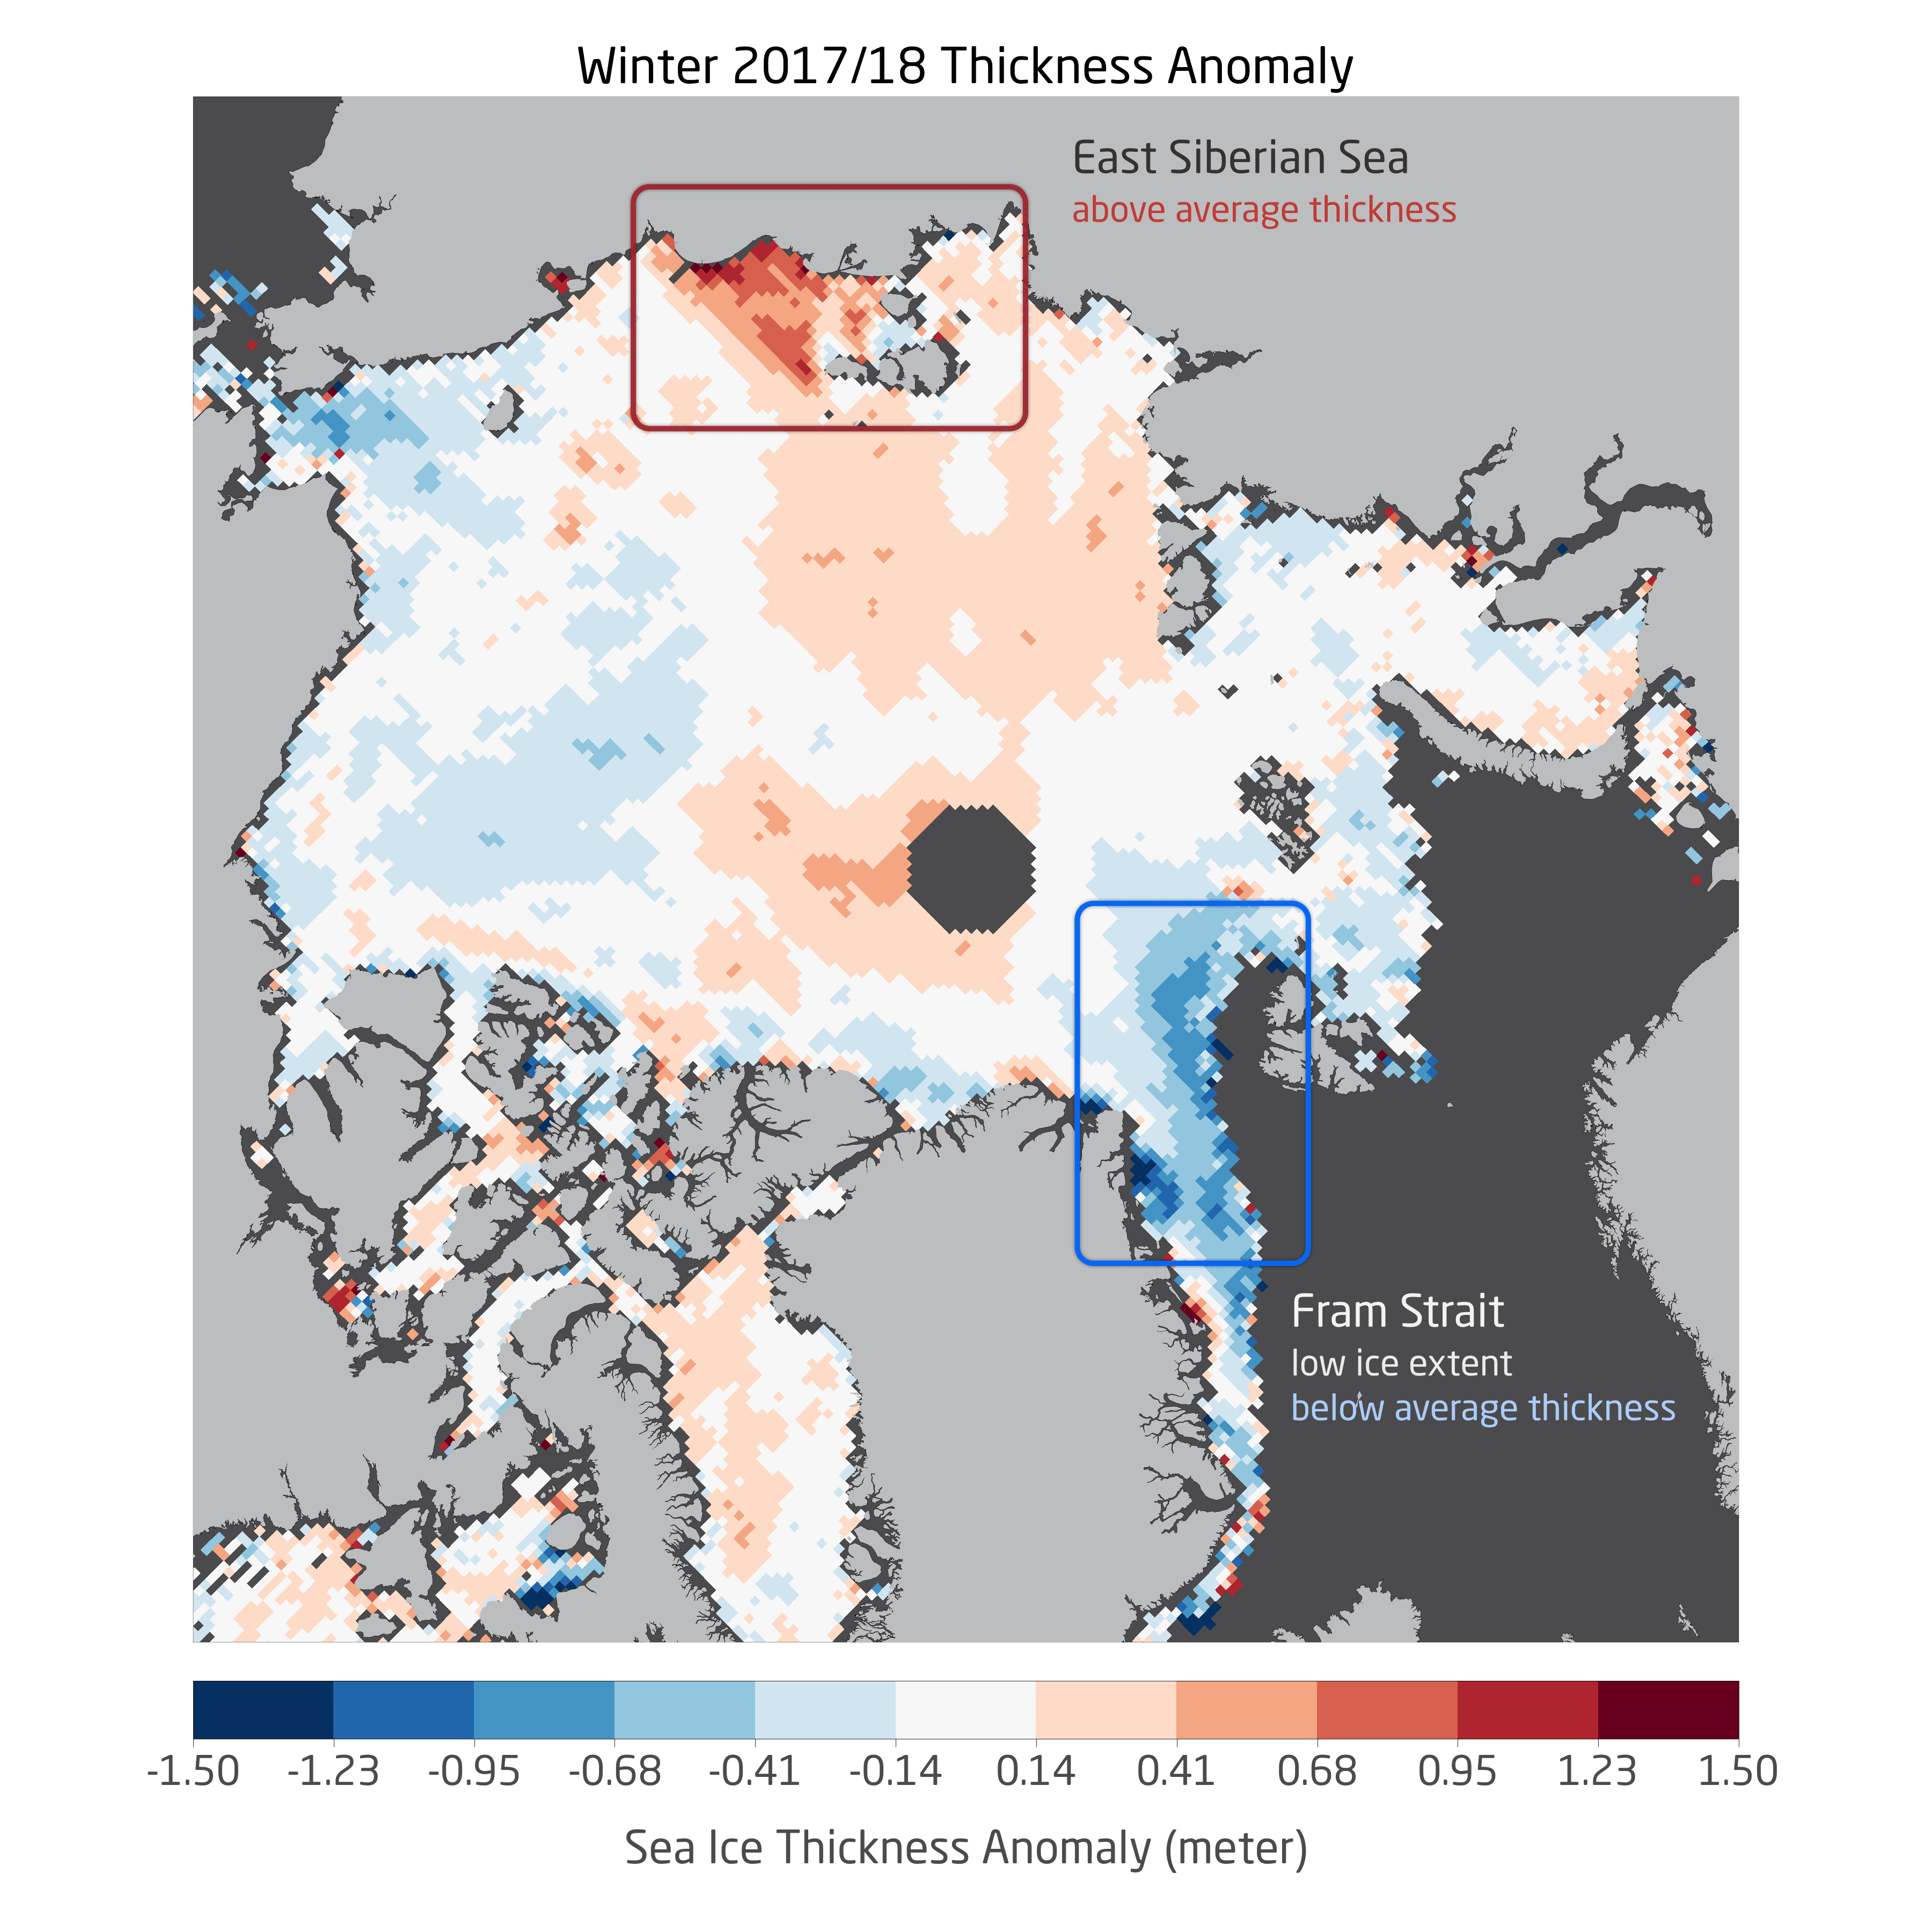
- Significant above-average thicknesses in the East Siberian Sea. The region experienced also more ice convergence than normal which potentially led to the higher thicknesses.
- Areas with anomalously low ice extent also show lower ice thicknesses.
The sea ice thickness observations are available as monthly averages and their mean values are shown in Figure 1 for the Arctic Basin (Figure 2). The mean ice thickness at the end of this winter was 2.14 m, which is slightly below the average of the previous seven years (2.19 m). During this period, the thickness extremes ranged from 2.03 m to 2.29 m and CryoSat-2 data show four years with higher mean ice thickness and three years with lower mean thickness than in 2017/18.
One important factor that controls the ice thicknesses in April is the development of both thermodynamic as well as dynamic processes over the previous winter season. The thickness maps from October 2017 to April 2018 are shown in Figure 3 together with their deviation from conditions of the previous winters 2010-2017. The thickest ice is usually found north of the coast of Greenland and Canada, where the ice does not completely melt during summer. In other regions the ice is younger and consequently thinner. During the winter season the ice is not only growing by freezing of sea water at its underside, but winds can compress ice floes which can break und pile up under the pressure. These events are termed ice convergence. The opposite process, ice divergence, happens when the wind pushes ice floes apart and new ice forms quickly in the open water between the floes. The third column in Figure 3 shows regions with convergent (red) and divergent (green) drift anomalies in each month.
The effect of convergence and divergence is visible in the sea ice thickness data. For example, the East Siberian Sea at the coast of Russia showed consistently higher convergence and above average thicknesses in the last winter than in the previous 7 winters (second & third column of Figure 3). This process is important, as it shows that more factors than just air temperature influence the growth of sea ice. Ice that has been compressed once also retains its additional thickness for the rest of the winter, even if the ice convergence period was short-lived. However, a convergence event does not create more ice, it only creates thicker ice. In contrast, the neighboring, divergent area where open water was created refreezes quickly and thus creates additional sea ice.
The higher ice convergence and above-average thicknesses in the Russian Arctic are therefore potential factors for the relatively normal mean Arctic-wide ice thicknesses in Figure 1 despite a winter with warm air temperatures and low sea ice extent (more information here). Specific regions with very low sea ice extent such as Fram Strait however also show consistently below average thicknesses (Figure 4). The mean thickness in April is not only the result of winter ice growth but also depends on the initial thickness in October. In October 2017 mean ice thicknesses were above-normal due to relatively cool summer conditions with less melt (more information in German language here). Therefore average ice thicknesses in April 2018 could have benefited from larger than normal thicknesses in October 2017. Nevertheless, the change from above average in October to slightly below average in April indicates the impact of the warm winter 2017/18, when CryoSat-2 observed the third lowest ice volume gain in the last 8 winters.
Contacts
- Dr. Stefan Hendricks (AWI)
- Dr. Robert Ricker (AWI)
- Prof. Dr. Christian Haas
Questions?
Contact us via E-Mail or our contact form.
Graphics


.")


.")
.")