“May 2018 was the warmest May in Germany since 1881, and the second consecutive month (together with April 2018) with a new record high.” That was the German Weather Service’s review of the current weather situation, which has been accompanied by a number of extreme events like frequent storms, heavy precipitation and local flooding in the country’s southern and western regions, together with an extremely dry period in the north. It was certainly an unusual month for Germany, but was the situation similar in the Arctic? “Yes, we also had an unusually warm month in the Arctic, as a result of which the melting near the ice margin began earlier in the year,” explains Christian Haas, a sea-ice physicist and head of the sea-ice physics section at the Alfred Wegener Institute.
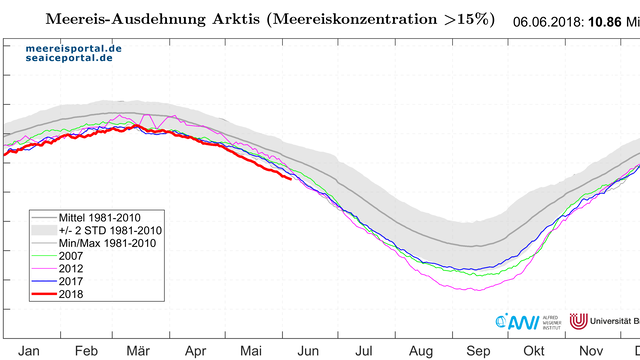
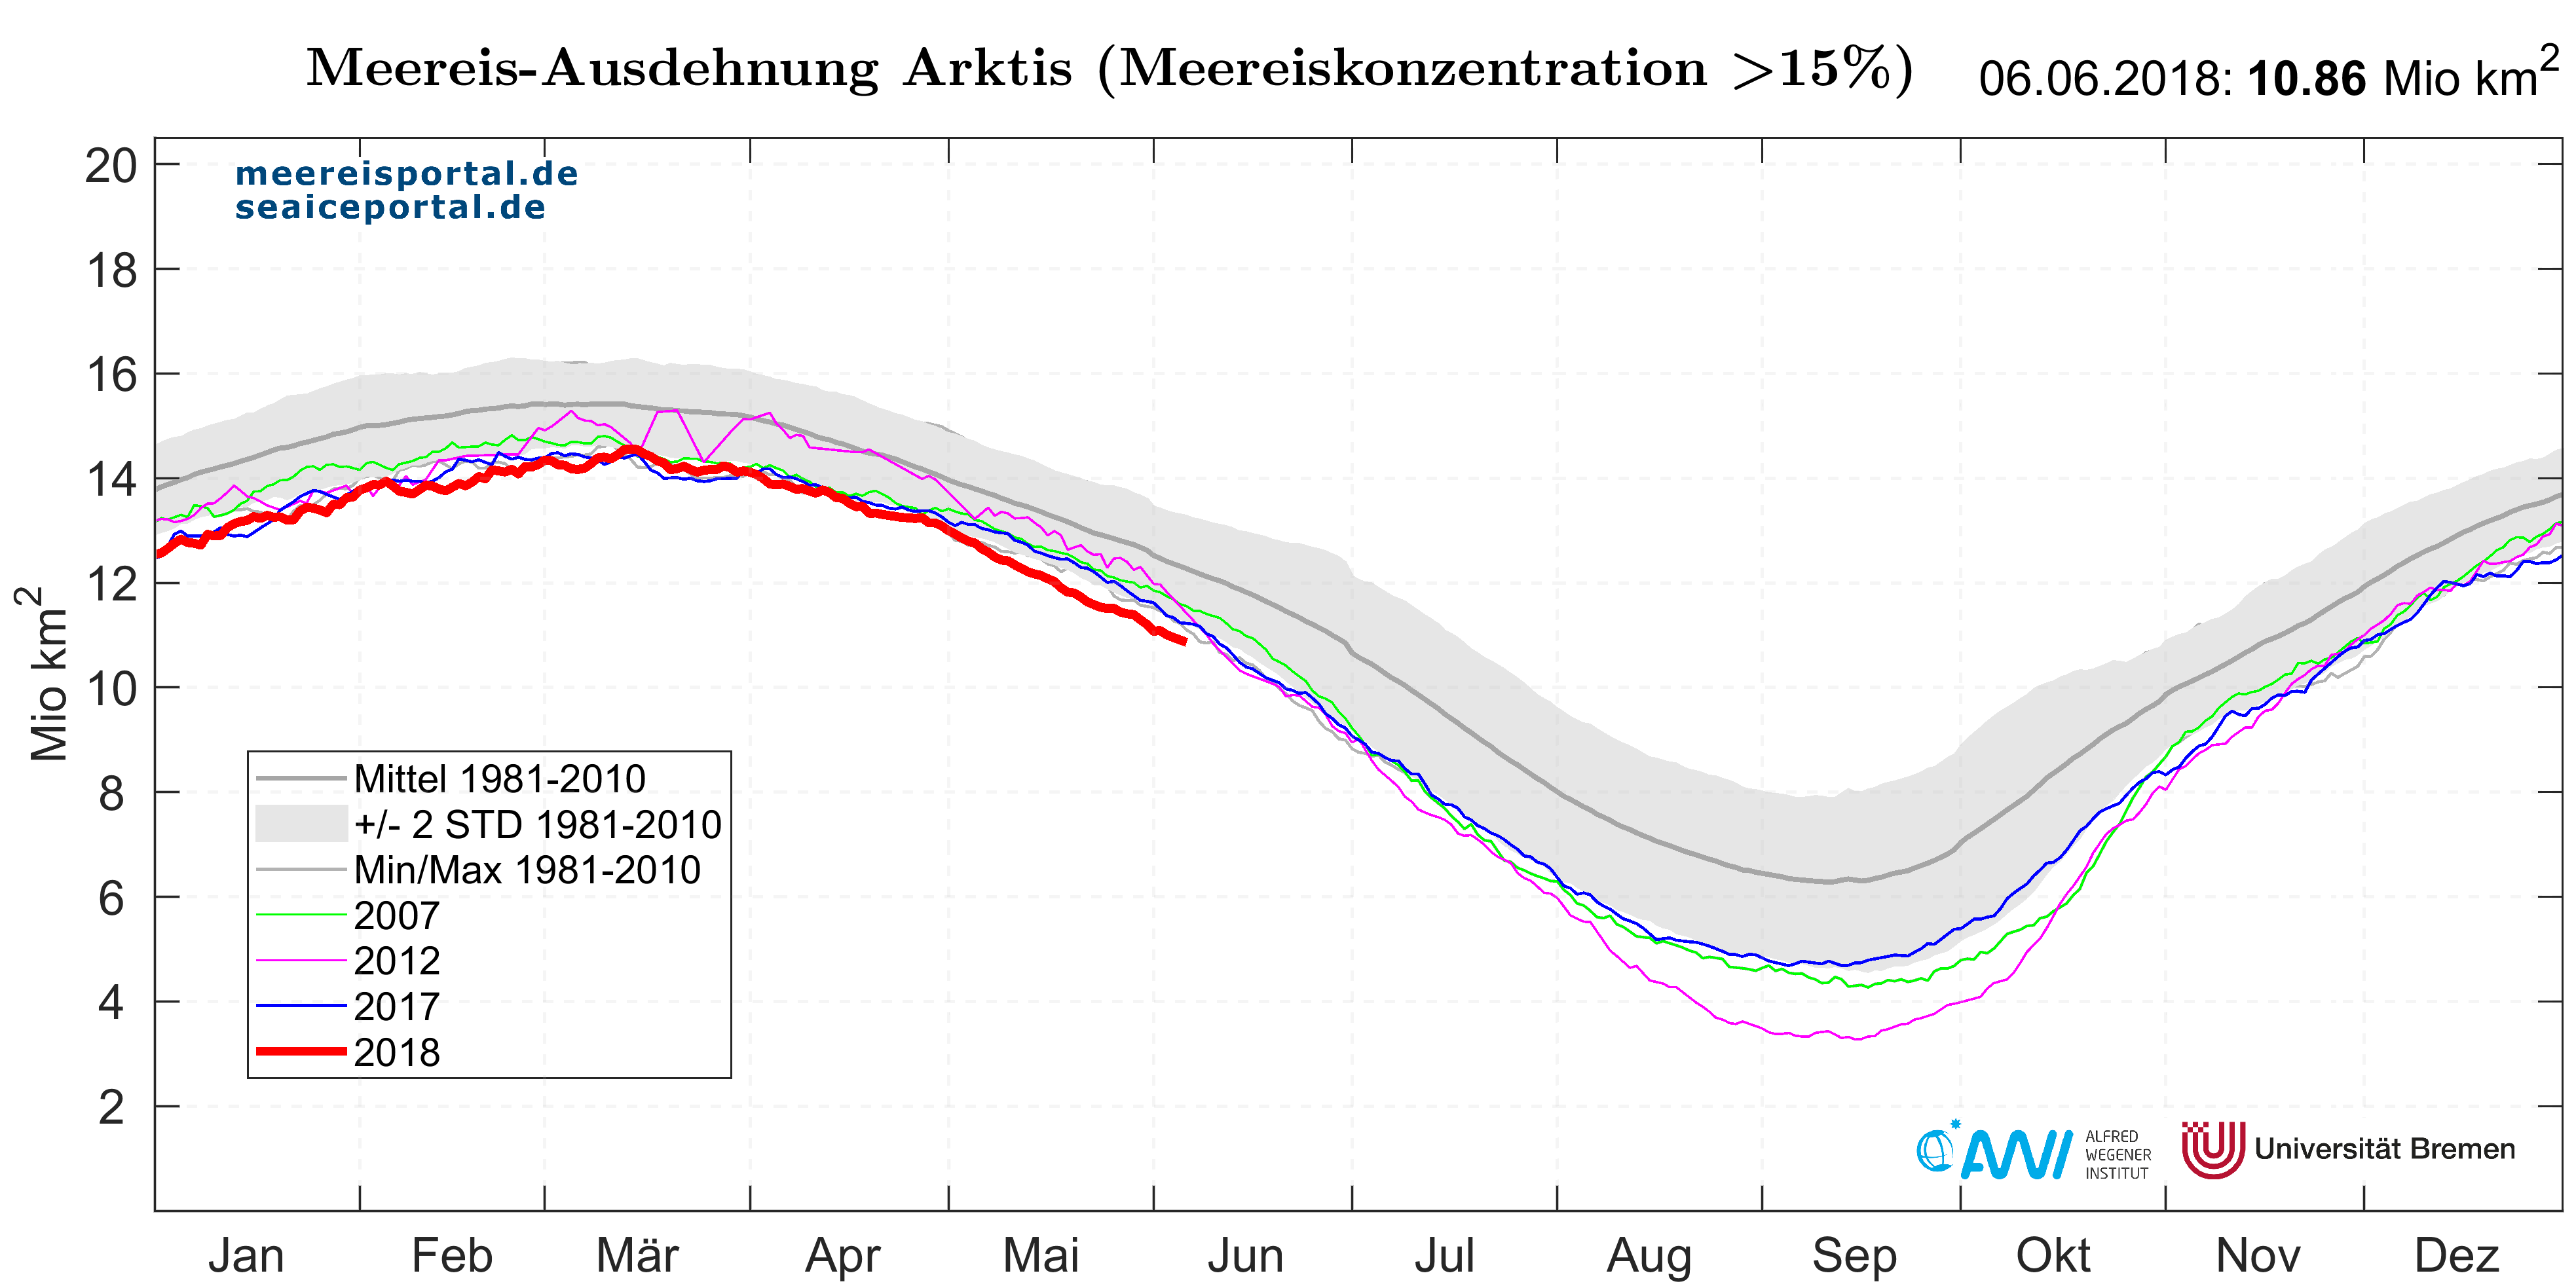
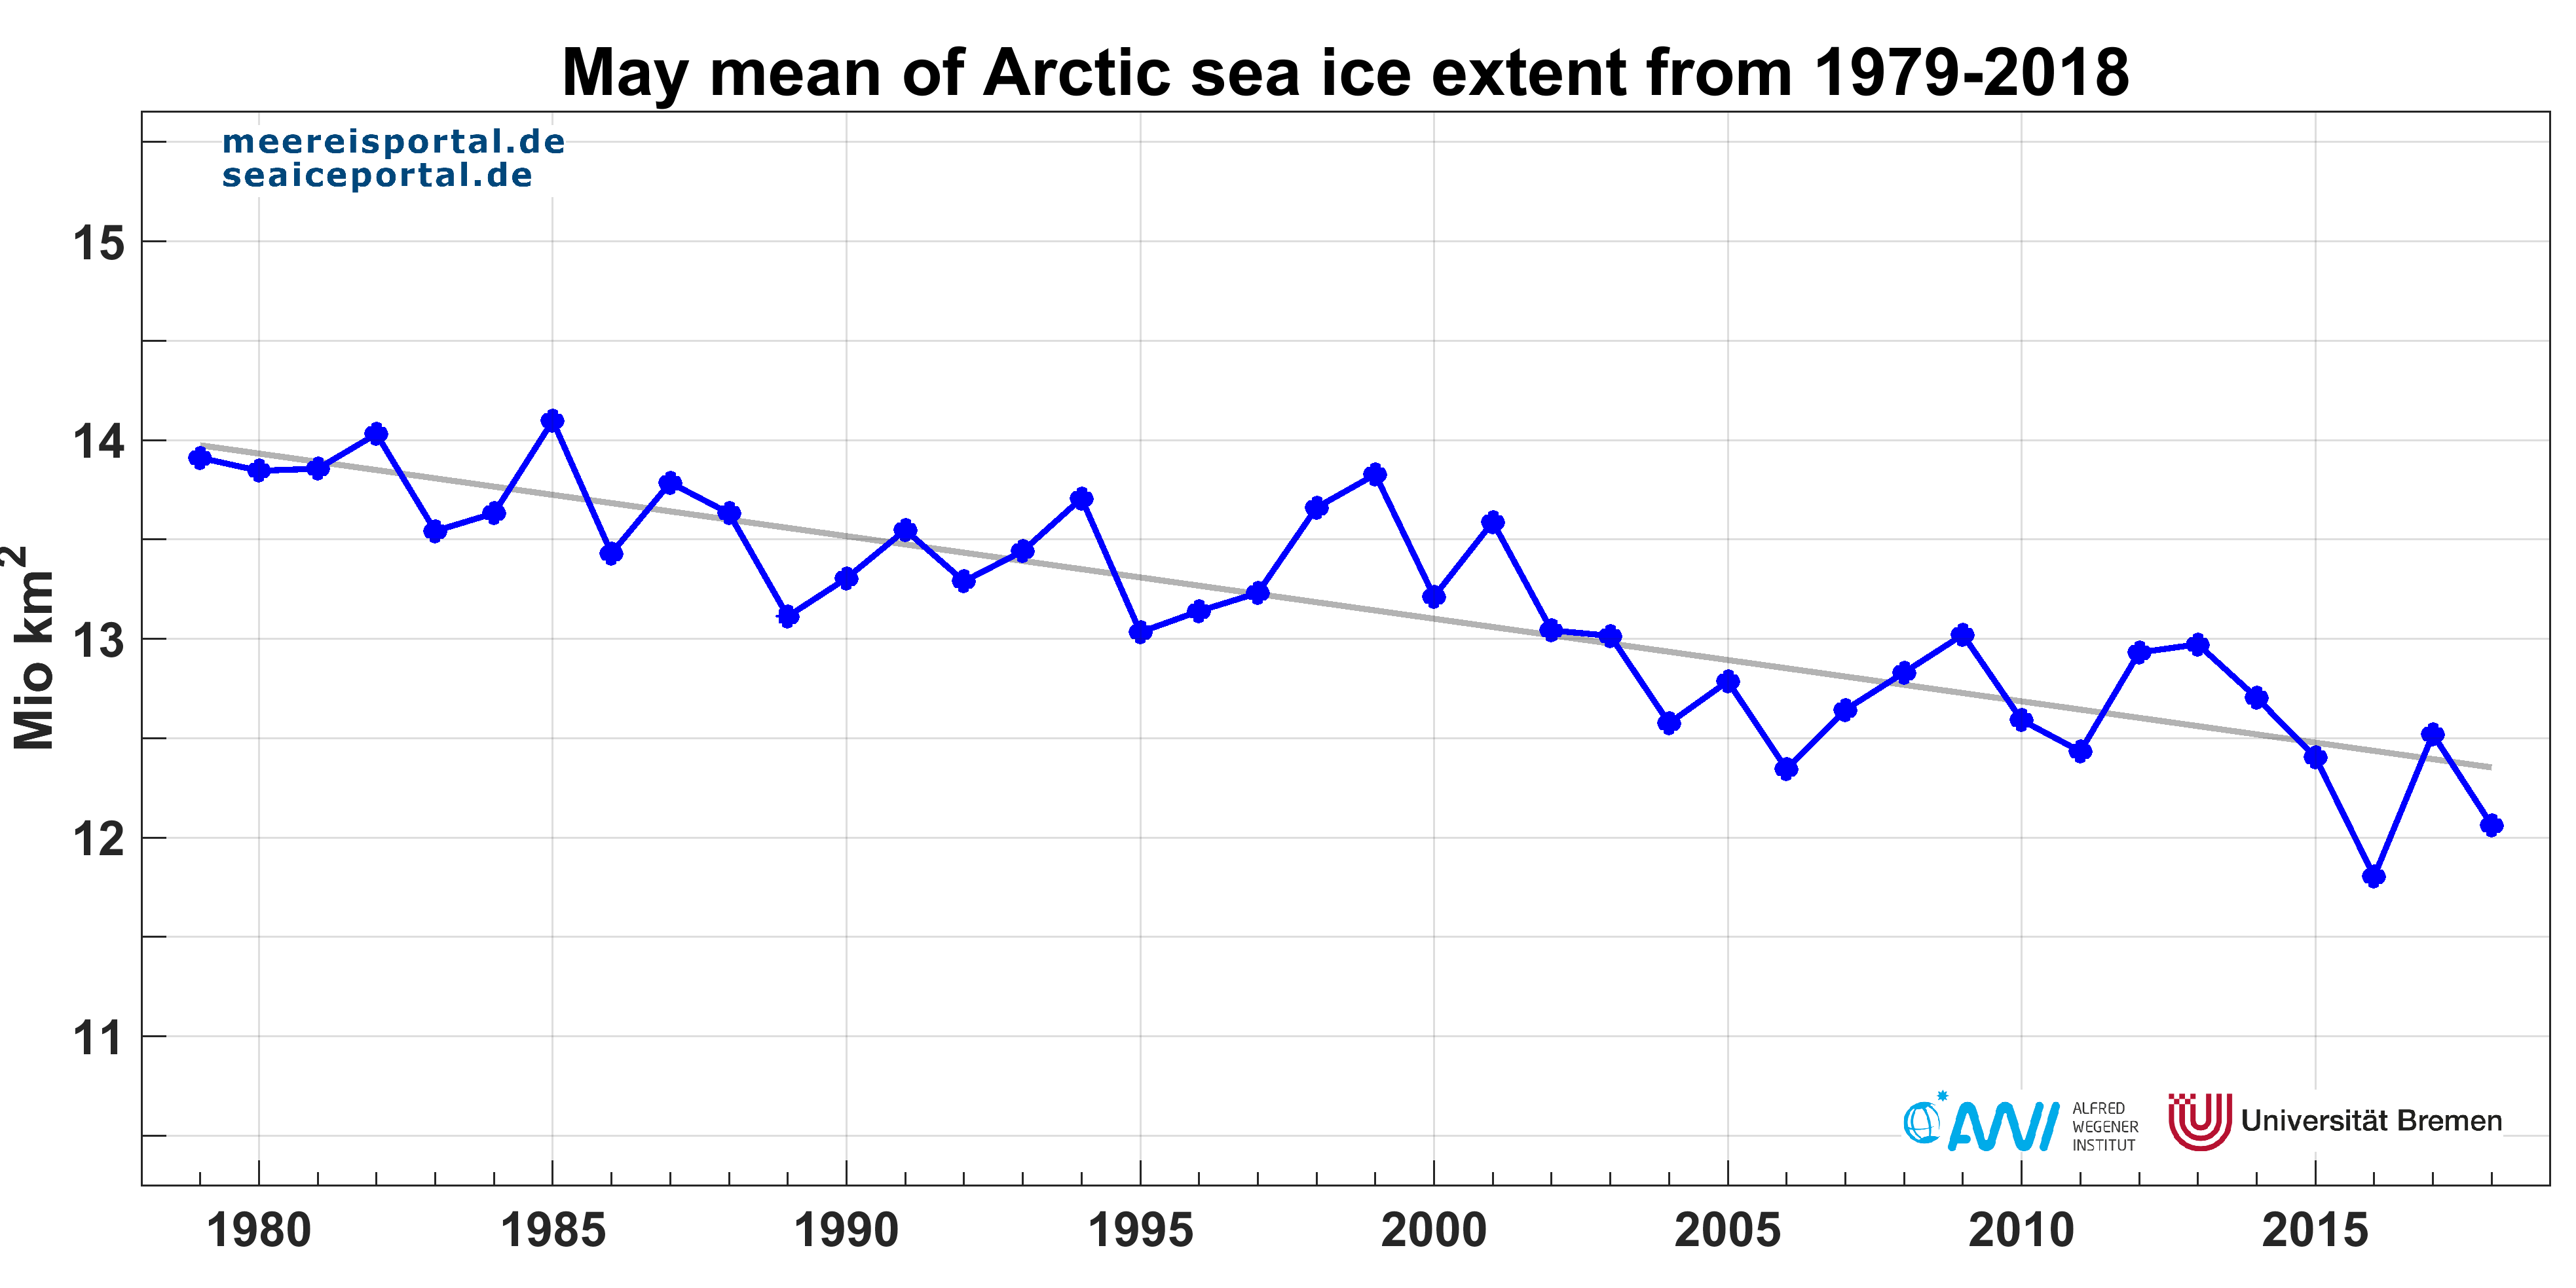
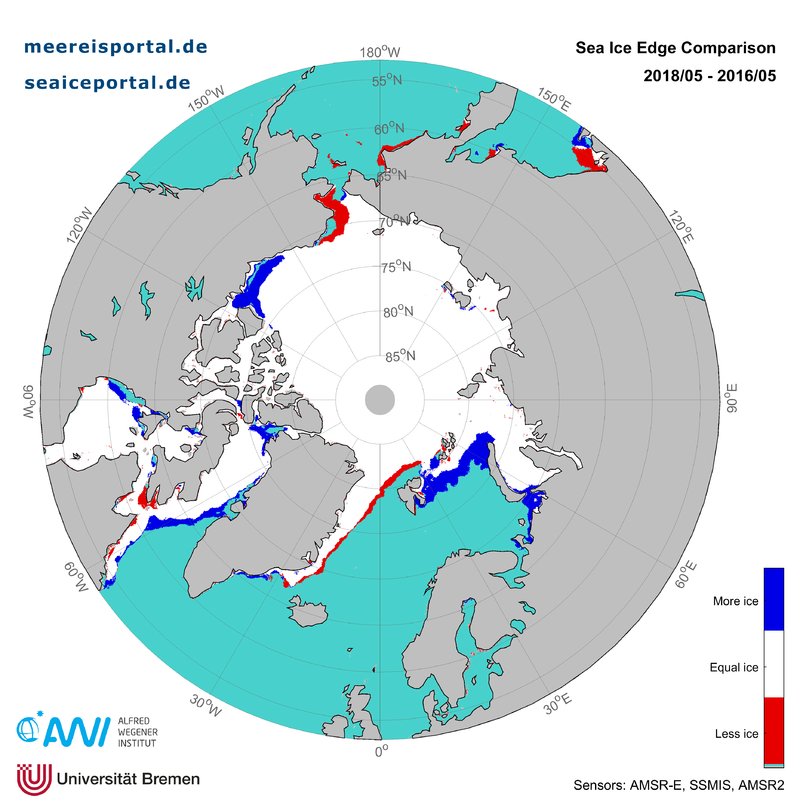
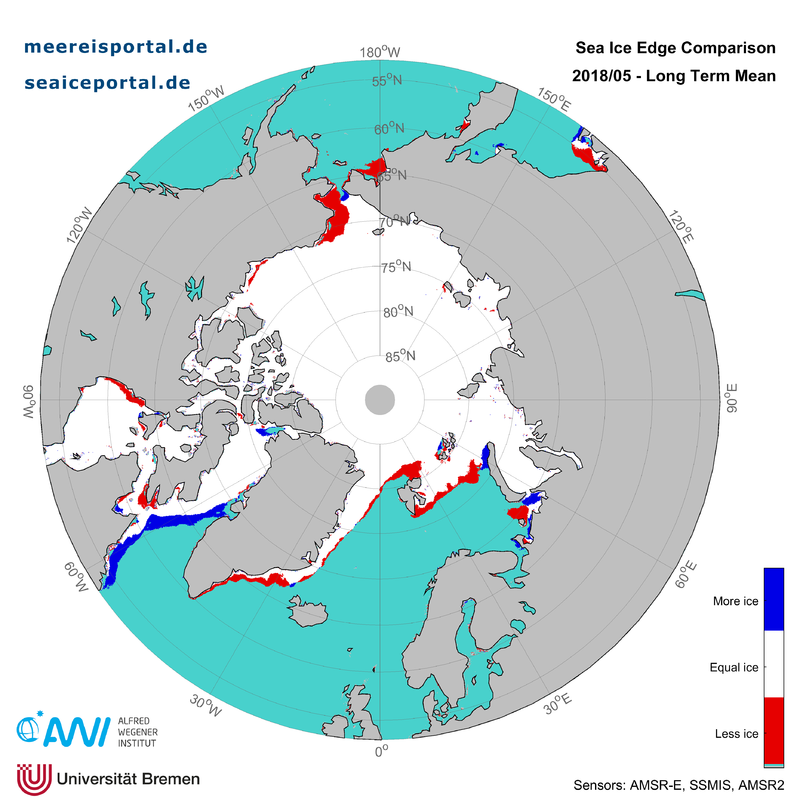
“Ever since winter, the sea-ice extent in the Arctic has been very low for this time of year, and continues to lie below the double standard deviation from the long-term average (see Figure 1). In May we recorded an extent of 12.06 million km², the second-lowest since 2016 (see Figure 2). Back then, it was roughly 260,000 km² less than this year.” In comparison to 2016, the level of sea-ice cover was somewhat higher in the Barents Sea, southern Beaufort Sea (Canadian Arctic) and Davis Strait (west of Greenland). In contrast, there was less sea ice in the Chukchi Sea and eastern Greenland Sea (see Figure 3). Compared to the long-term average, the amount of sea ice declined in many marginal regions of the Central Arctic; it only increased in the Davis Strait, to the west of Greenland (Figure 4).
Climatological situation
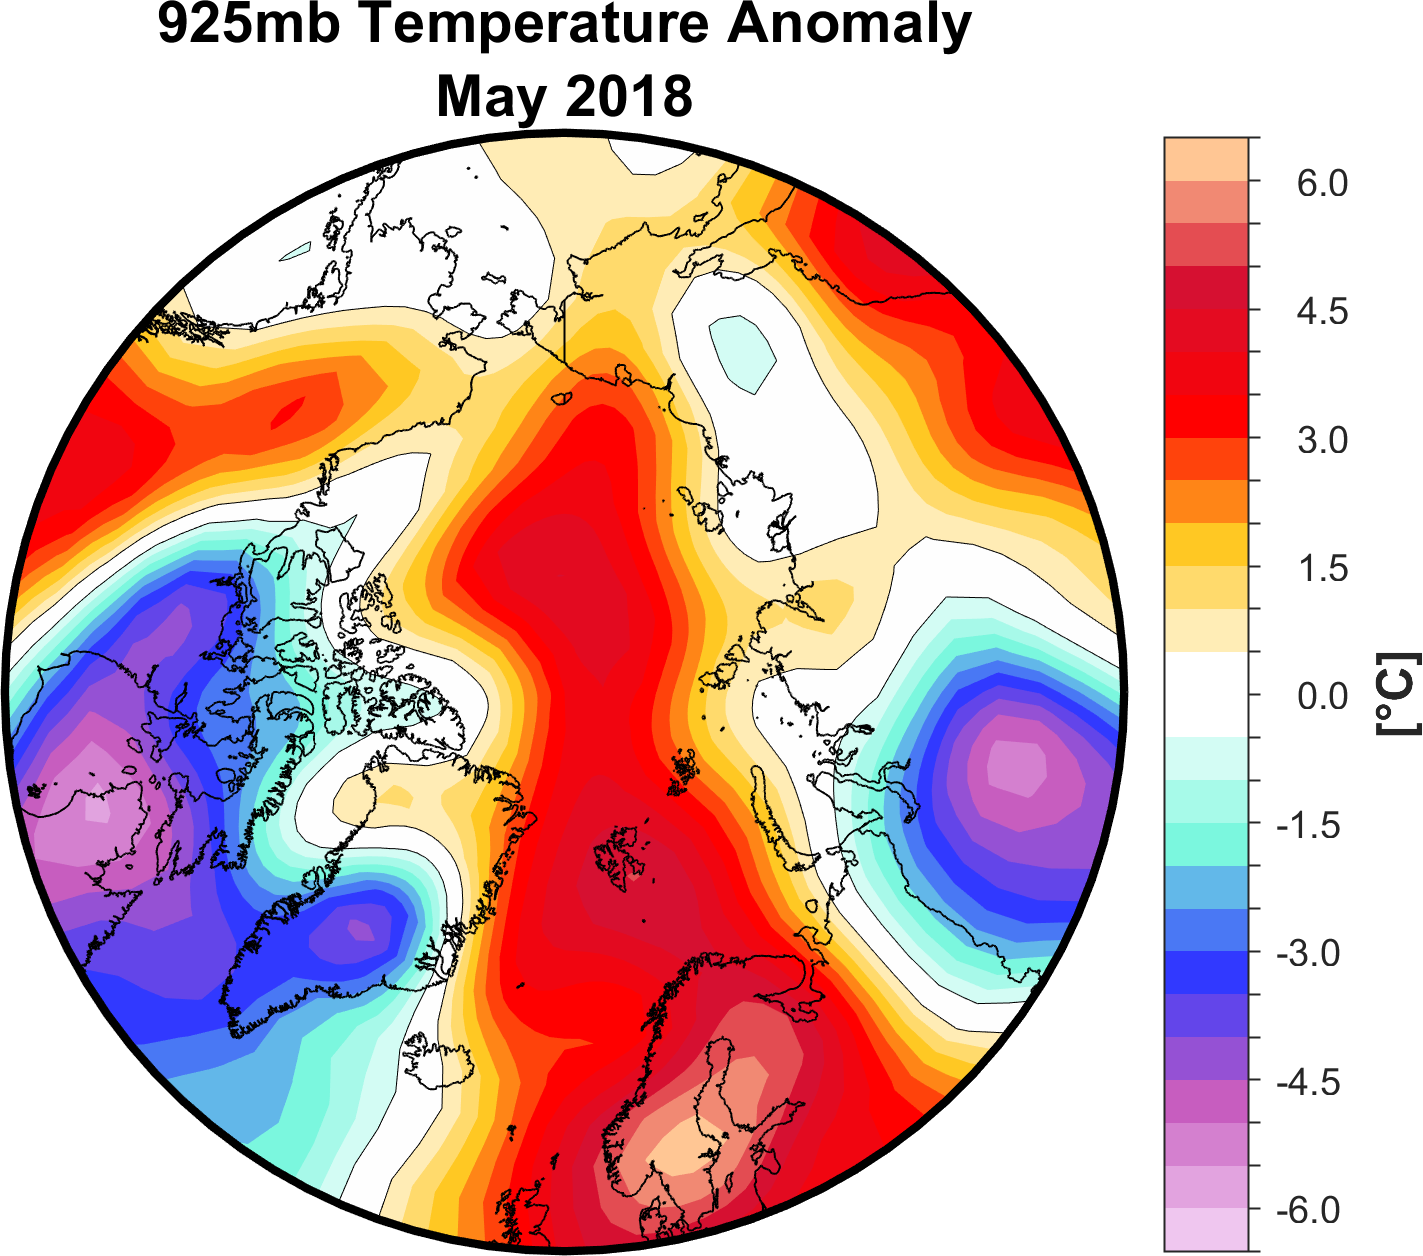
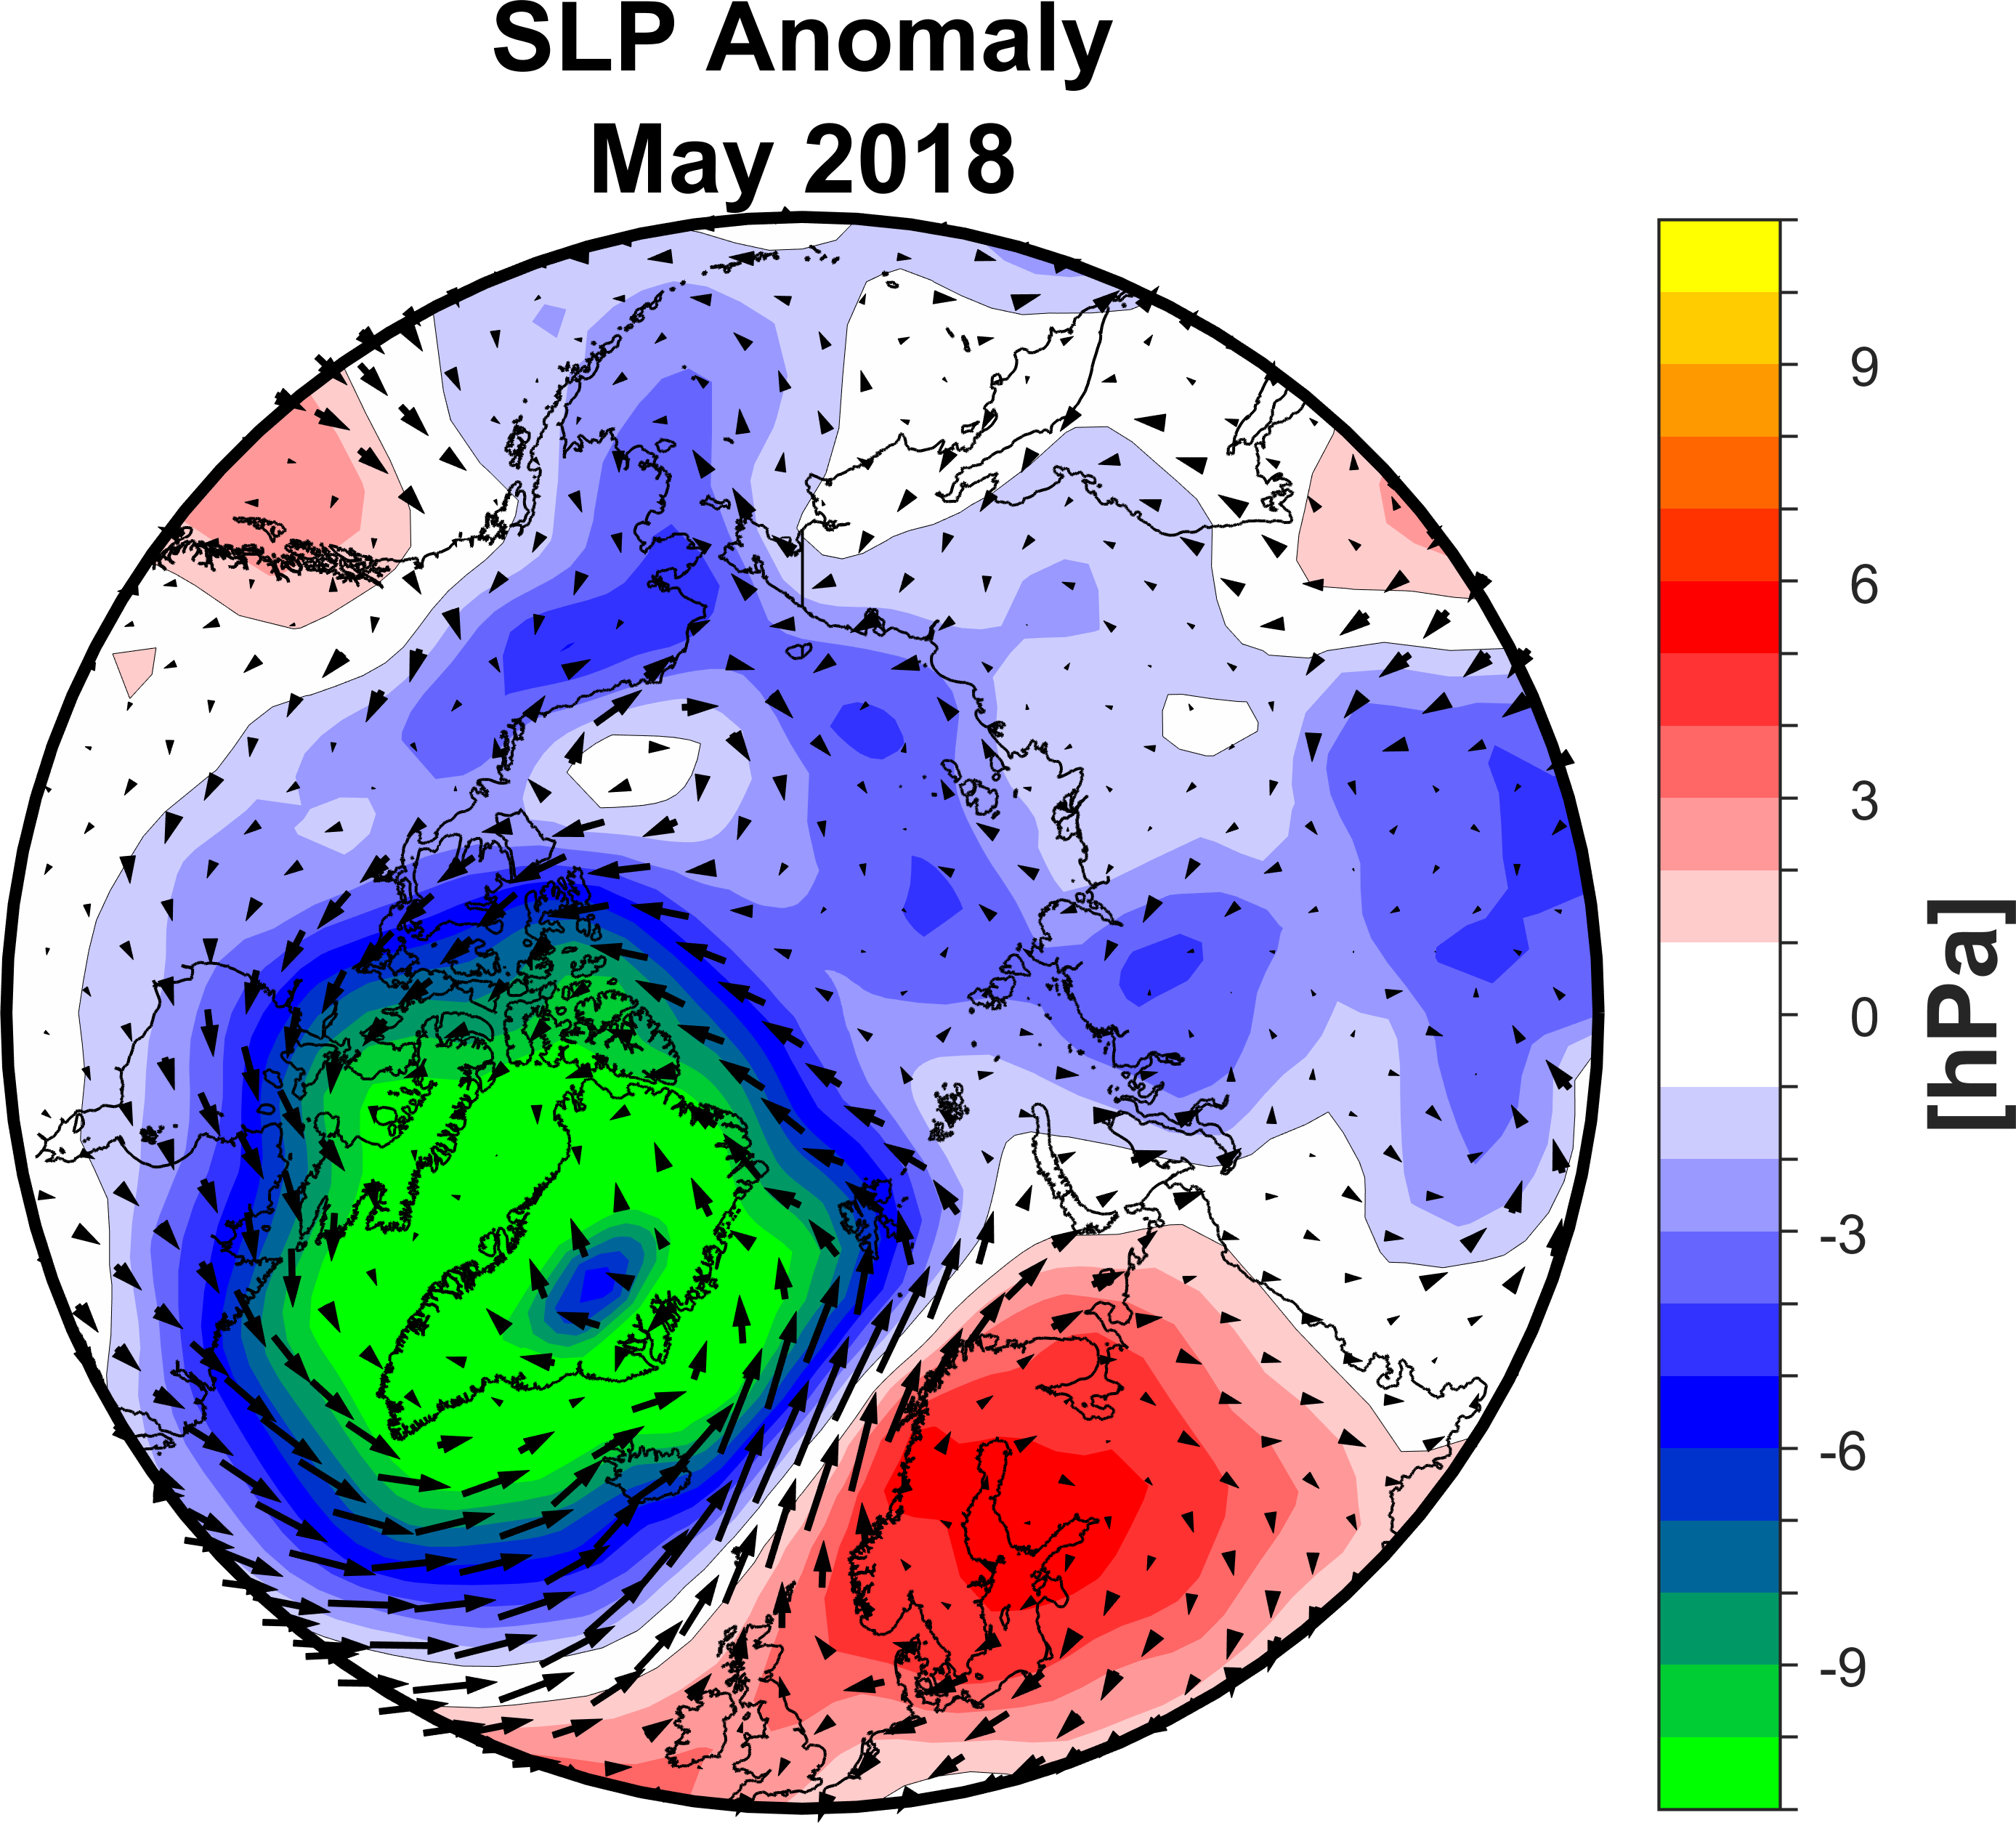
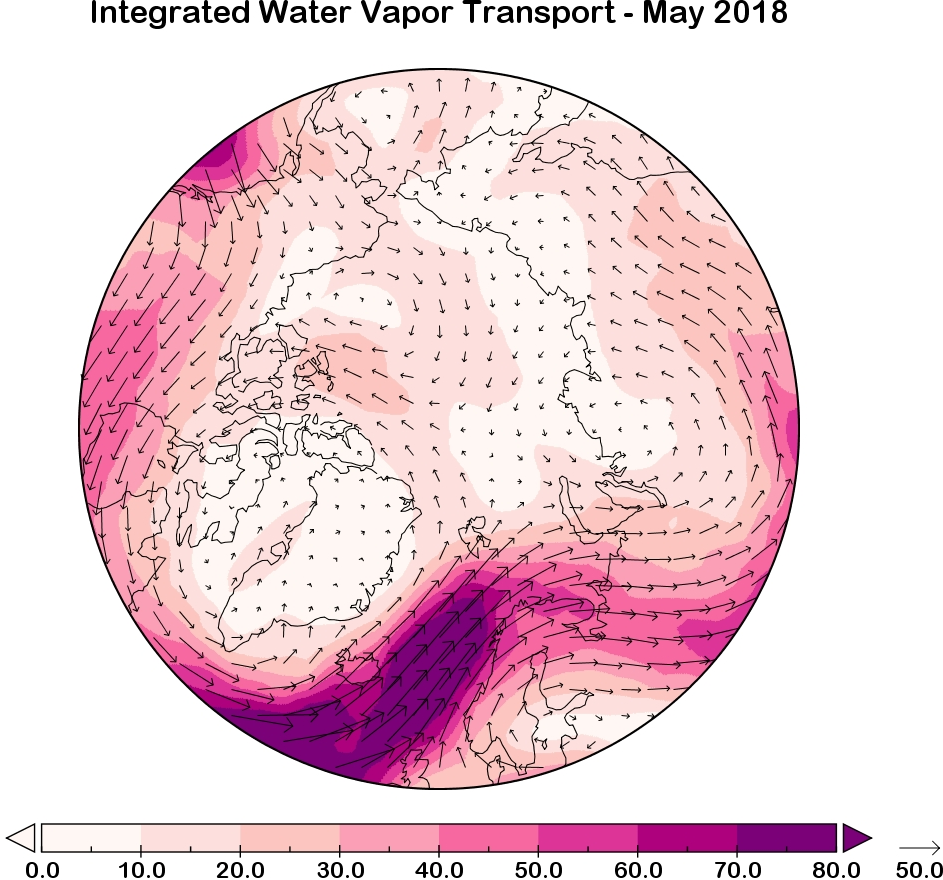
In May, many parts of the Arctic continued to be considerably warmer than the long-term average (see Figure 5). The atmospheric pressure pattern at sea level (Figure 6) was characterised by unusually high pressure over the Fennoscandian Peninsula on the one hand, and by a region of below-average pressure over Greenland on the other. In the Pacific sector, though the mean atmospheric pressure at sea level was lower than the long-term average, it was nonetheless typical for the Beaufort Sea High and the Aleutian Low. This pattern was extremely stable and continued for more than a month. It produced a wedge-shaped inflow of warm winds into the Barents Sea from the south (Figure 6, arrow), and with it an increased input of heat into the Arctic. The dipolar structure of the pressure anomalies (a low-pressure system over Greenland and high-pressure system over Scandinavia) increased the inflow of warm and moist air from the North Atlantic Basin toward the Arctic (Figure 7).
Thanks to the cloud-influenced radiative forcing, the moisture transport is also directly or indirectly influencing sea-ice formation in the polar regions. Moisture input in the Arctic, particularly during the spring months, is an important motor for the melting of sea ice. The intensified inflow of moisture into the Arctic region in May 2018 can at least partly explain the low values for the sea-ice extent at the end of the month. In the course of the month, at 925 hPa (meteorological layer of the lower troposphere at ca. 764 m) there were temperature anomalies of up to plus 5 °C compared to the long-term climatological average and, generally speaking, it was relatively warm over the Arctic Ocean (see Figure 5).
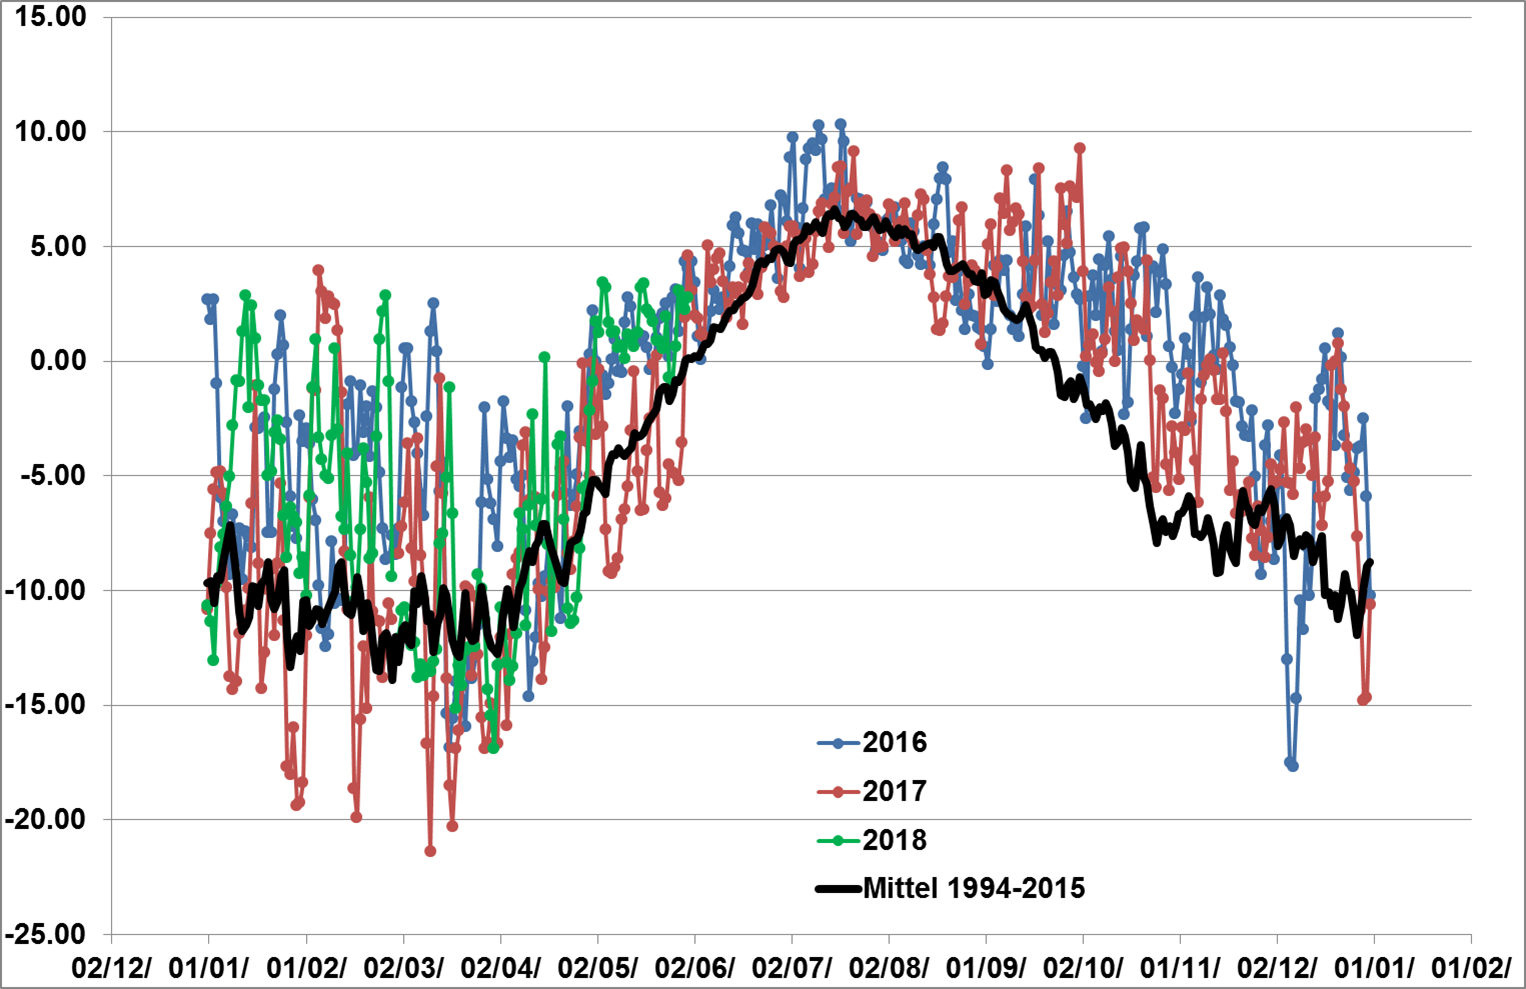
In contrast, the conditions over Greenland and northern Canada were relatively cool, with temperatures below the long-term average. In parts of Central Siberia and Nunavut in northern Quebec (Canada), the temperatures were as much as 5 °C lower than the long-term average. For the majority of the year, the atmospheric temperatures at 925 hPa over the Arctic Ocean remained above the long-term average, and were higher than normal from January to early March. Following a brief cold snap in late March, in April the temperatures were once again near the long-term average, and climbed again in May. These warm conditions could be clearly seen at the AWIPEV Station on Spitsbergen (see Figure 8). In May, the daily mean temperature was at times 5°C above the long-term average. At the end of the month, the northern and western coasts of Spitsbergen were largely ice-free, and to the east of the island, a tongue of open water stretched to the northeast, in the direction of Franz Joseph Land. At the end of May, the open water reached as far as 82° N (see here).
“It’s still very early in the melting season to know what the minimum sea-ice extent this September will look like,” explains Monica Ionita-Scholz, a climatologist at the AWI. That being said, images from the MODIS (Moderate Resolution Imaging Spectroradiometer) satellite already clearly show a major reduction in the multiyear ice floes in the Beaufort Sea. The early appearance of open water around the large floes could accelerate melting by absorbing sunlight. Melt ponds can already be seen on some of the floes.
Start of the sea-ice forecasting season
For several years now, the AWI has been a member of the Sea Ice Prediction Network (SIPN), in which, starting every June, monthly forecasts for the minimum Arctic sea-ice extent in September are gathered and analysed (see the original post-season report from 2017 here). These efforts are coordinated by the Arctic Research Consortium of the United States (ARCUS). This is the SIPN’s second phase and is currently being financed by the National Science Foundation, the Office of Naval Research, and Britain’s National Environment Research Council. Although all forecasting methods are welcome, a new focus is on assessing the scientific value of seasonal ice forecasts. Further, in an attempt to make forecasts more useful for stakeholders, more attention is being paid to predicting the spatial distribution of ice cover for September, and not merely the overall size. The “Sea Ice Outlook” summarises all contributions and publishes the seasonal development of conditions every month until summer, and in after-season reports on the SIPN website. Just as in previous years, the AWI is submitting two contributions based on different approaches: a statistical method and a numerical model. Over the past several years, both have displayed a high degree of agreement with and similarity to the actually observed sea-ice extent in September (descriptions of the methods).
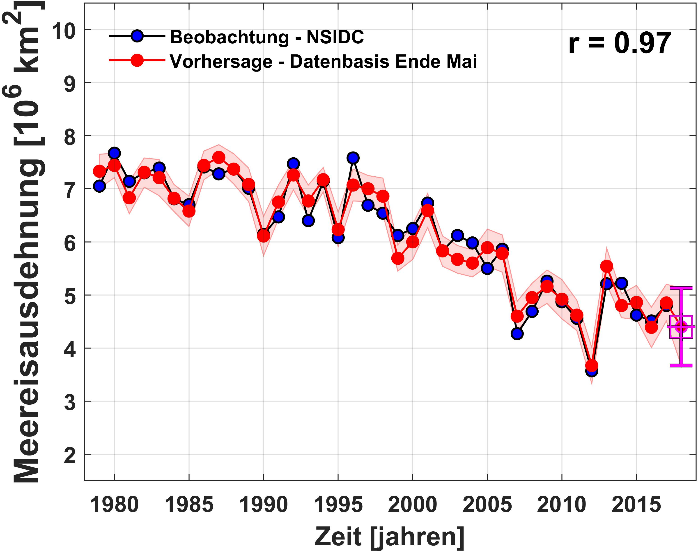
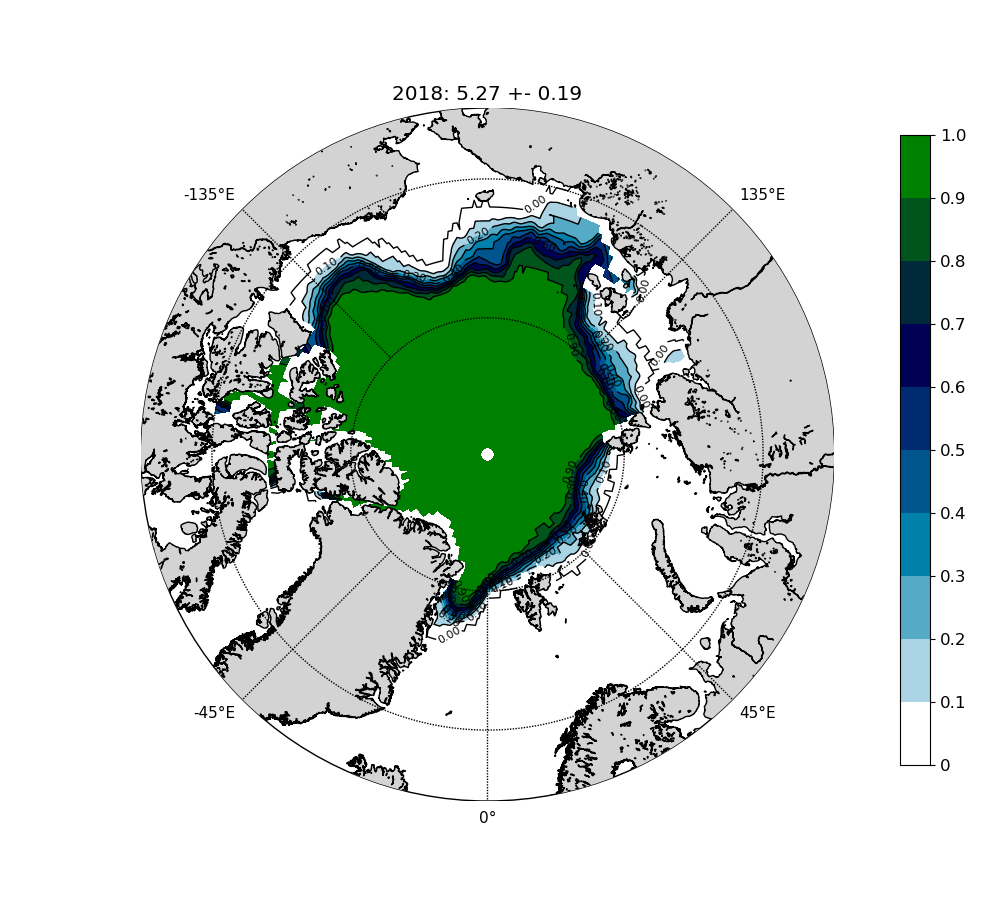
On the basis of climatological observation data, Monica Ionita-Scholz used the statistical model to calculate a sea-ice extent of 4.4 million km² for September 2018 (Figure 9). This would be the third-lowest summer minimum in the Arctic for the observational period starting in 1979, after the record low of only 3.6 million km² in 2012 and the second-lowest value of 4.3 million km² in 2017. In turn, the numerical model created by Frank Kauker, a member of the AWI’s sea-ice physics section and an expert on sea-ice modelling, predicts a value of 5.27 +/- 0.19 million km². In addition, the numerical model can predict the regional distribution of the sea-ice extent. Figure 10 shows that, especially in the region of the Barents and Kara Seas, as well as the Beaufort and Chukchi Seas, intensive sea-ice retreat is likely. It’s still too early to say whether or not the Northeast and/or Northwest Passages will be ice-free. According to Frank Kauker, “The discrepancy in the outcomes of the two approaches at this early point in the season reflects their methodological differences, as well as the different initial data they used.” As Monica Ionita-Scholz adds, “We’re very curious to see how the low sea-ice extent and the lower mean ice thickness in the winter of 2017/2018, together with the unusually warm atmospheric conditions in the Arctic up to this point, will affect the sea-ice retreat.” At meereisportal.de, we’ll continue to monitor the development of forecasts, and comment on the outcomes of the SIPN in our monthly reports.
Contacts
- Prof Dr Christian Haas (AWI)
- Dr Monica Ionita-Scholz (AWI)
- Dr Frank Kauker (AWI)
Questions?
Contact us via E-Mail or our contact form.
Graphics


.")


.")


