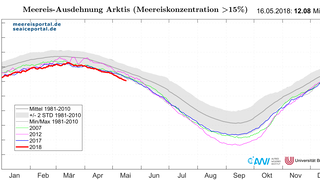
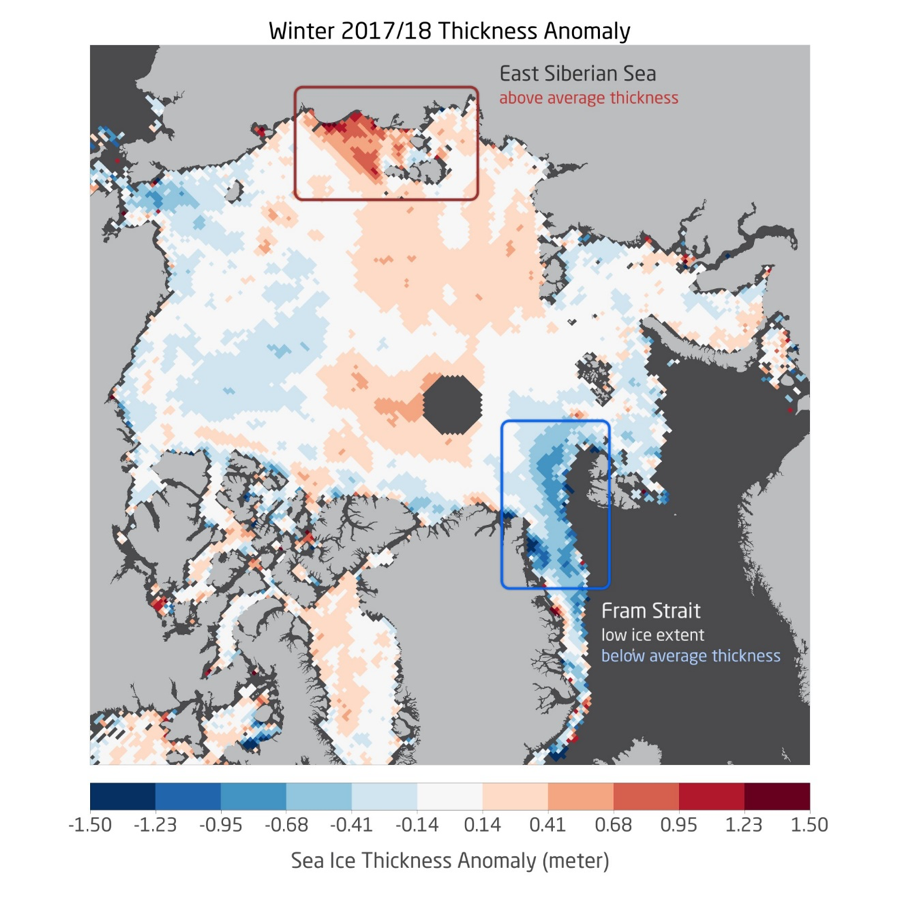
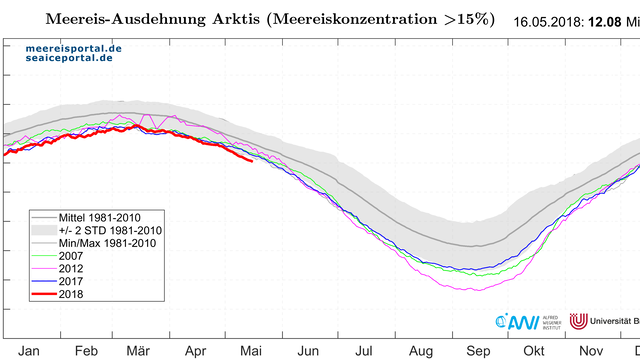
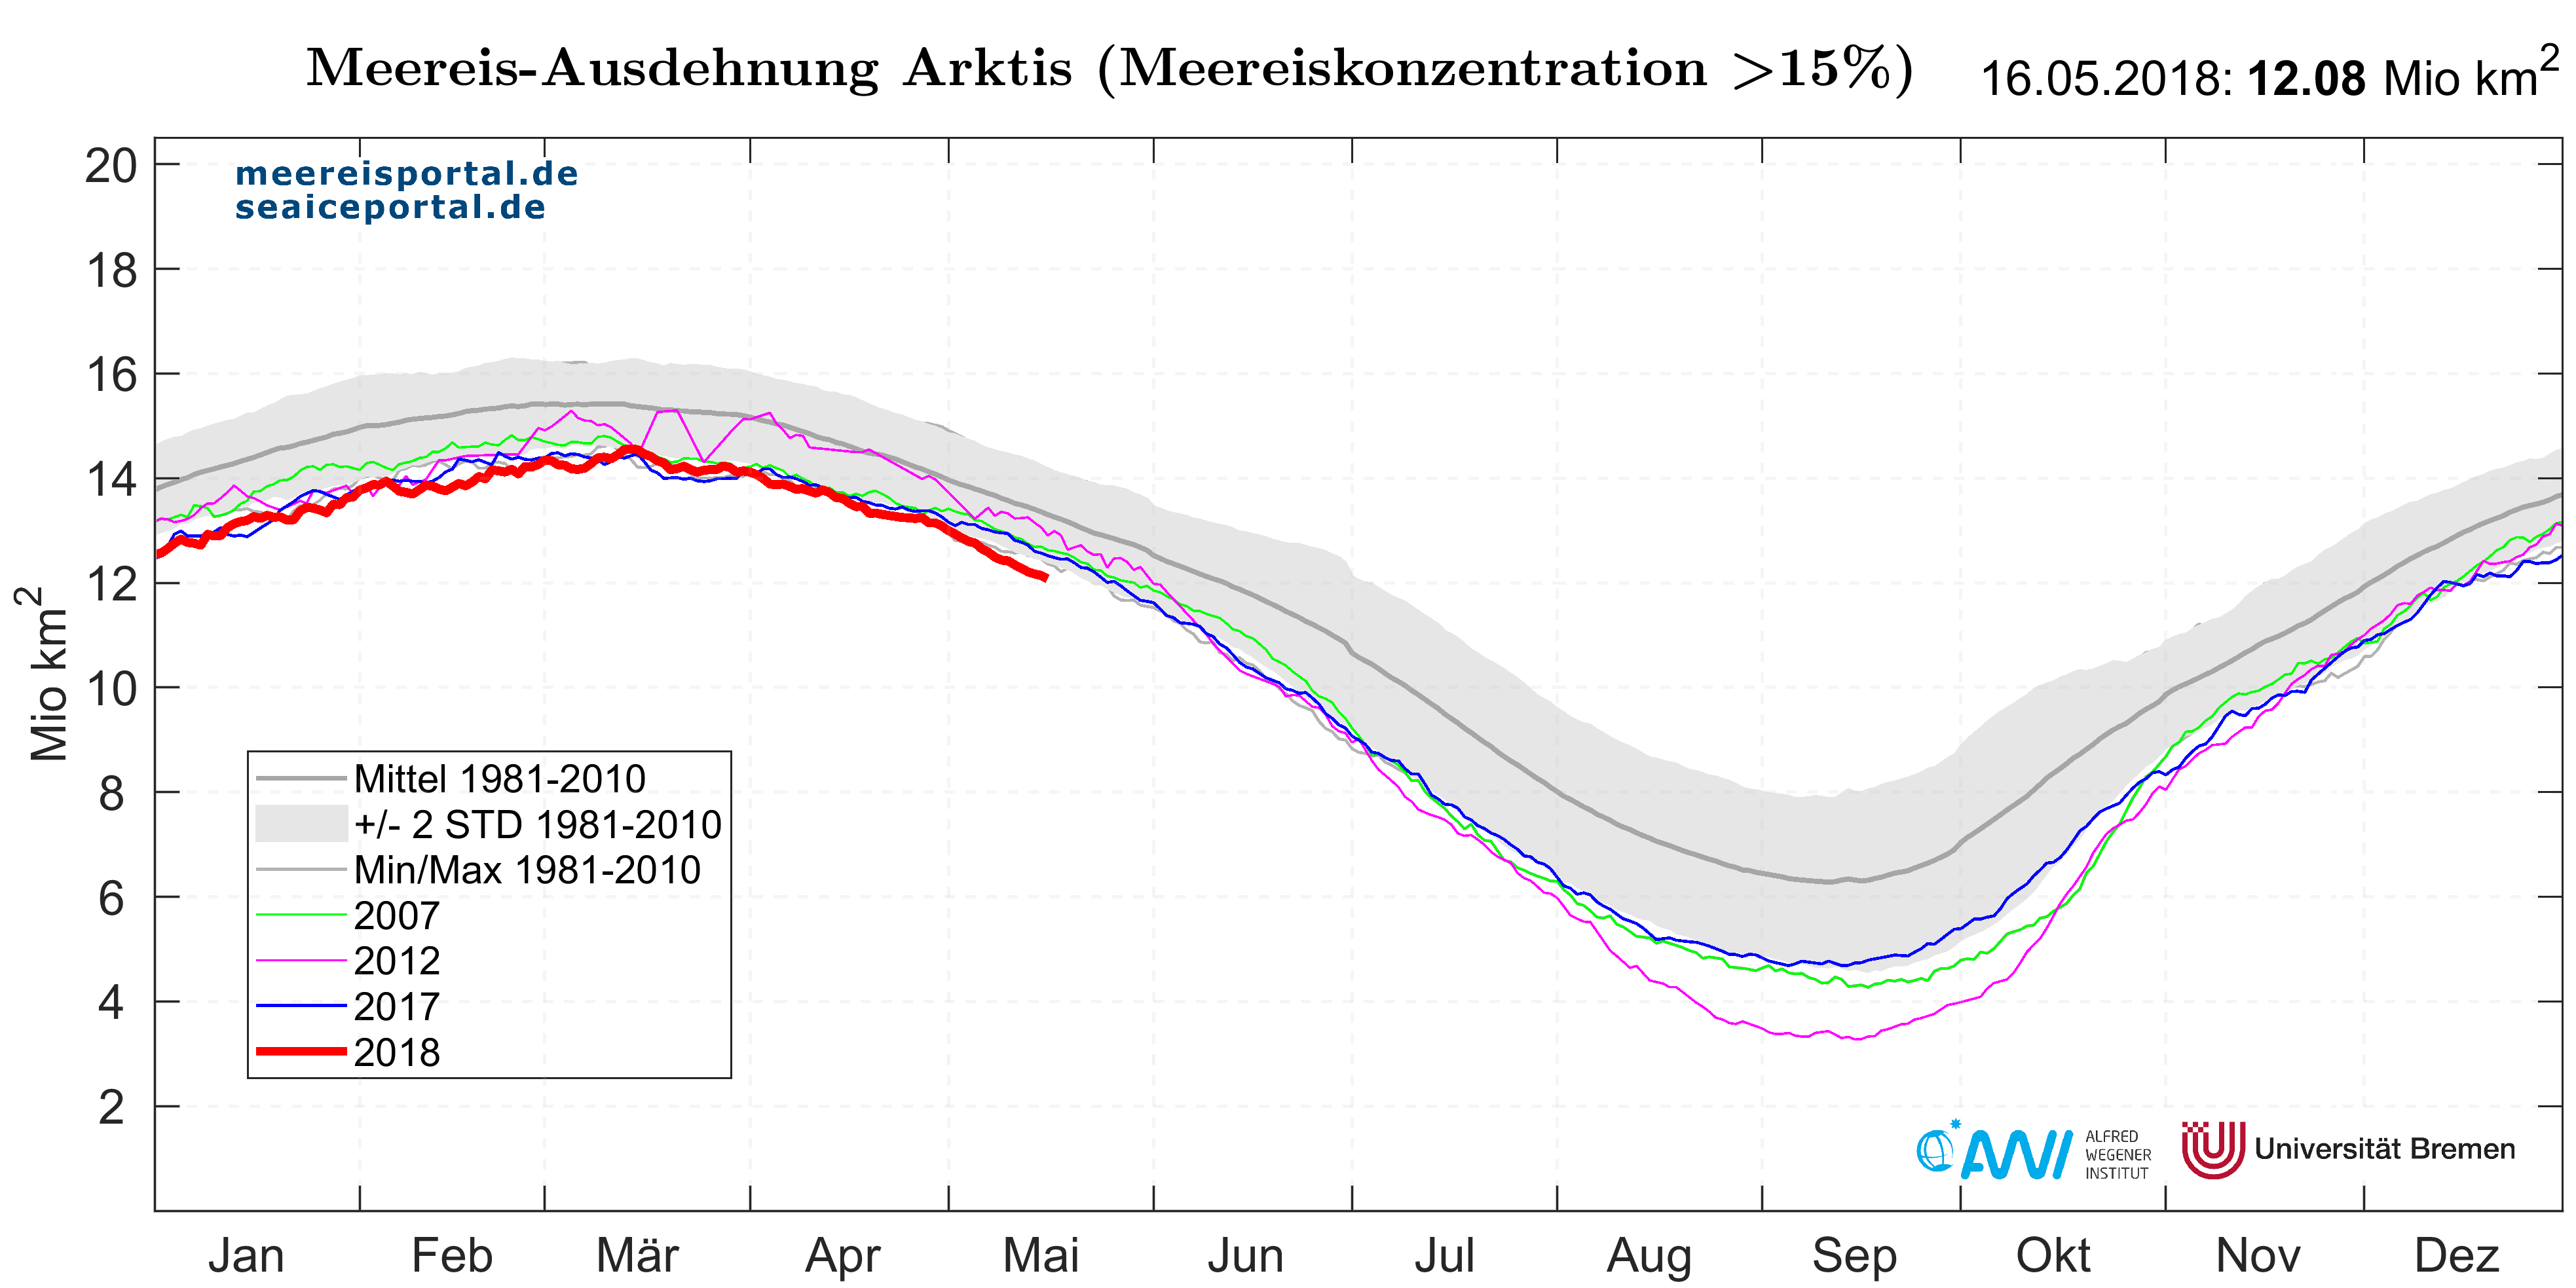
The arctic sea-ice extent was 12.08 million km² on 16 May, putting it clearly below the double standard deviation from the long-term average. “The trend toward low values for the Arctic sea-ice extent continued in the spring, while at the same time, the mean ice thickness was slightly below the average for the past seven years,” stresses Dr Marcel Nicolaus, a sea-ice physicist at the AWI. The sea-ice extent was 12.08 million km² on 16 May, putting it clearly below the double standard deviation from the long-term average (see Figure 1). The monthly mean extent for April (13.56 million km²) was the lowest since the beginning of satellite observation (see Figure 2), and in March, it was only slightly (69,378 km²) above the value from last year, which was the lowest ever observed for the month of March. “This represents a steady continuation of the sea-ice development from the winter of 2017/2018 (see Figure 3), which was characterised by extremely low extents of sea ice in the Bering, Barents and Greenland Seas, below the long-term average,” Nicolaus explains. The trend toward low sea-ice extent in the Bering Sea, which was sparked by various winter weather extremes near the coast, also continued in the spring. In addition to the low sea-ice extent, a lower mean ice thickness can be observed in the Arctic. At the end of the winter of 2017/2018, the mean ice thickness was 2.14 m, slightly below the average for the past seven years (2.19 m). These findings are based on readings from the CryoSat-2 satellite. Regions with a lower ice extent, like the Fram Strait, also had lower ice thicknesses. In contrast, the thicknesses in Russia’s marginal seas were somewhat higher than average (see Figure 4). “One reason for this are the above-average ice thicknesses at the end of last summer (October), together with comparatively low growth rates,” explains Dr Stefan Hendricks, a fellow sea-ice physicist at the AWI, whose work focuses on analysing the CryoSat-2 data. An extensive analysis of the ice thickness compared to the past several years, based on CryoSat-2 data, will soon be released here at meereisportal.de.
Climatological context
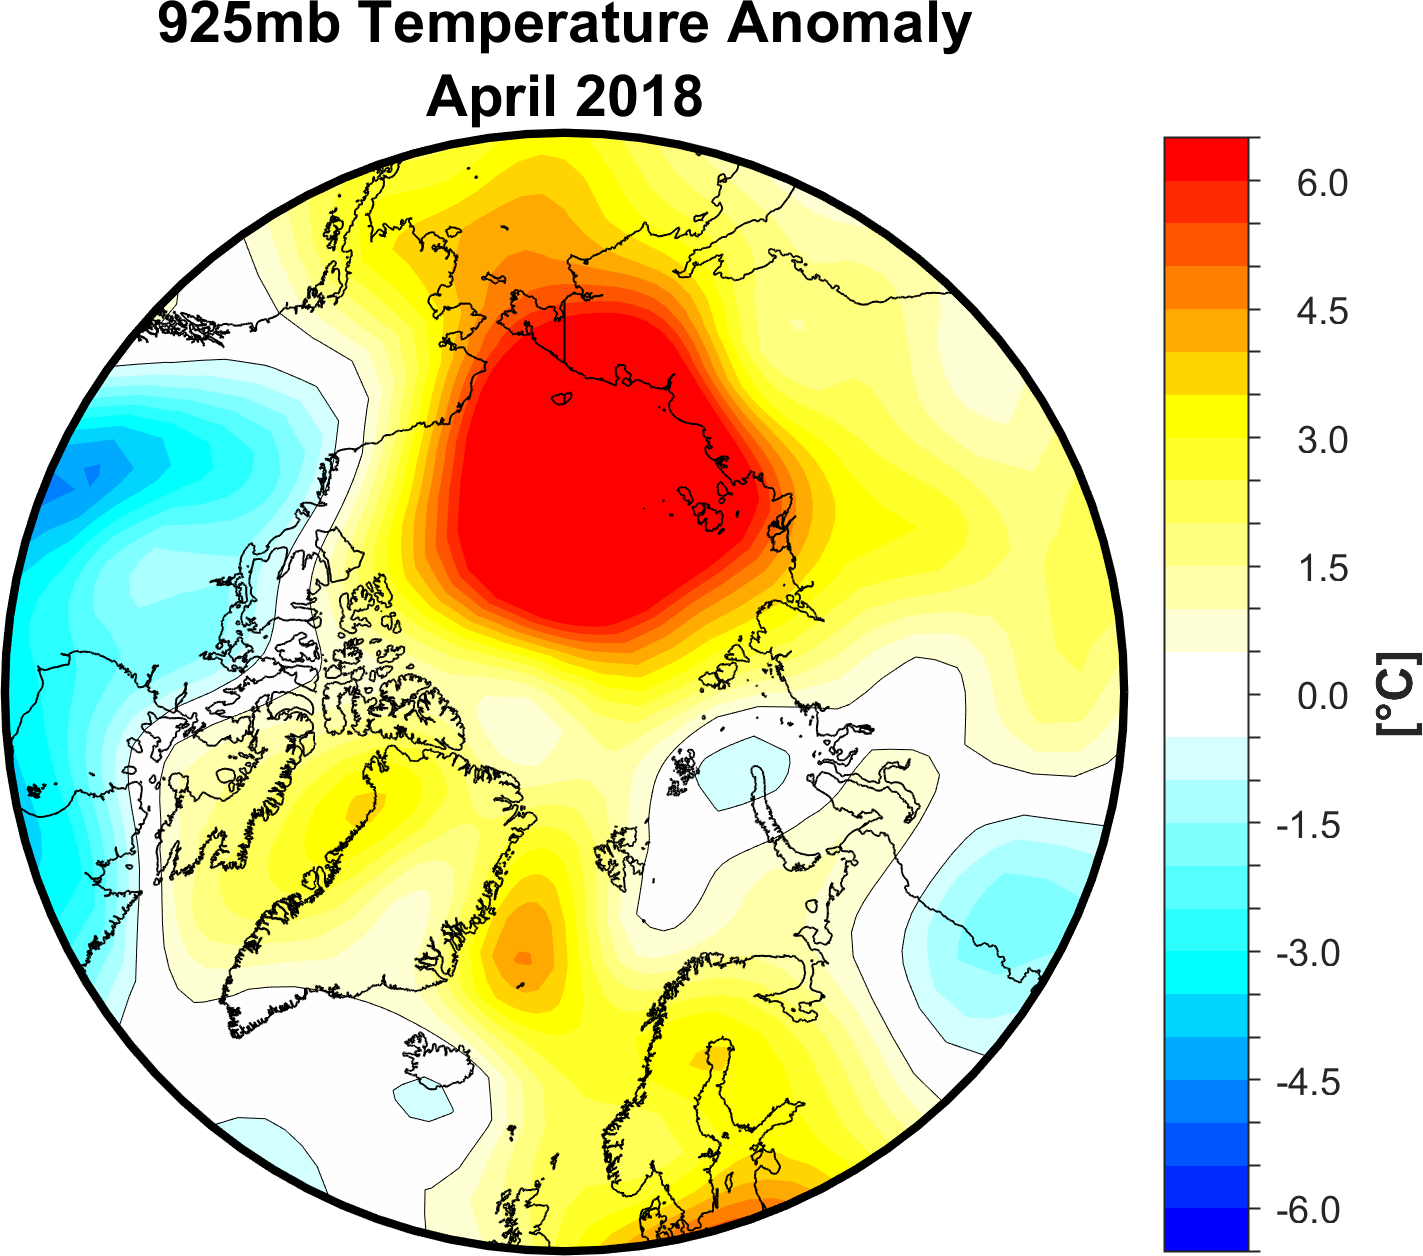
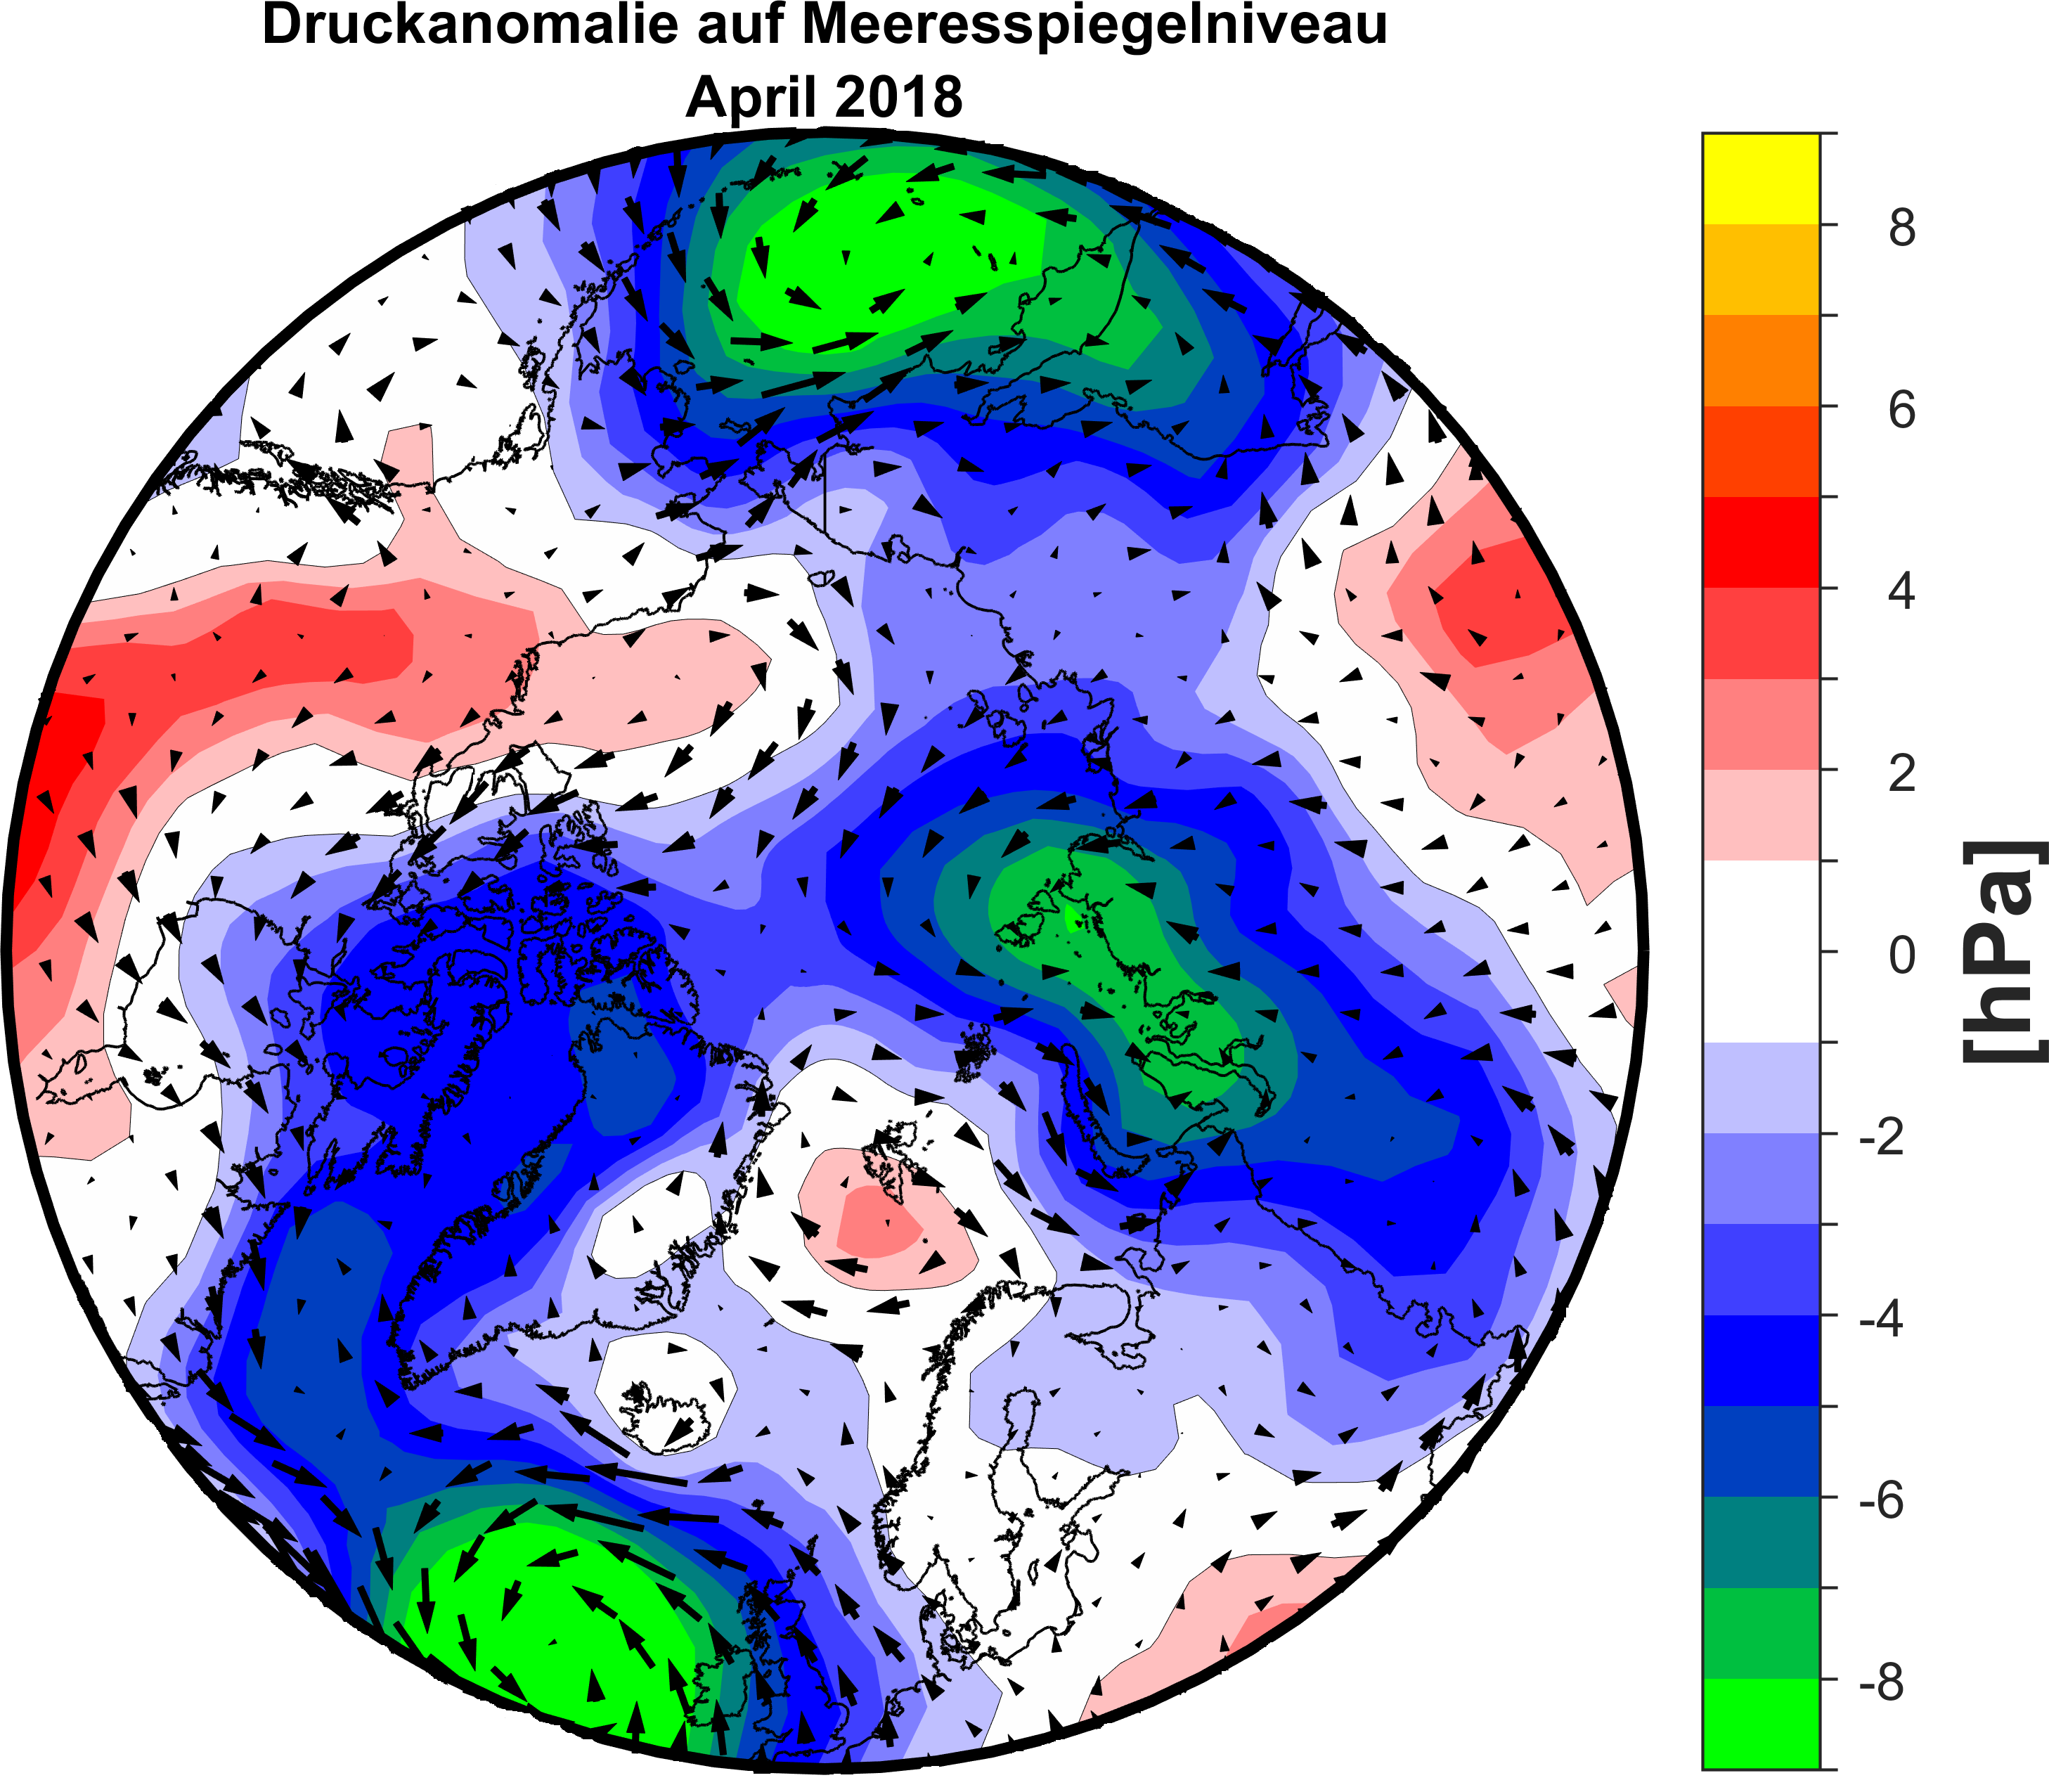
In the East Siberian Sea this April, the temperatures were predominantly up to 10°C above the long-term average at a pressure altitude of 925 hPa. Atmospheric temperatures in the eastern Greenland Sea were up to 5°C, and in Baffin Bay up to 3°C higher than the long-term average. In other regions, e.g. the Barents and Kara Seas, the temperatures were very close to the average, and in Canada and Hudson Bay, they even exceeded it (see Figure 5). These temperatures are the product of a sea-level pressure differential. Over the Beaufort Sea and the North Atlantic, the sea-level pressure is higher than the long-term average, while it is lower than average over Eurasia and from western Greenland to Eastern Canada (see Figure 6). On the Pacific side of the Arctic, these conditions led to an inflow of warm air from the south, over the East Siberian Sea and the Chukchi Sea, while cold air spilled into northern Canada. The higher sea-level pressure over the North Atlantic and the lower pressure over western Greenland and the Canadian Arctic Archipelago led to a southern influx of warm air over Greenland and Baffin Bay. (Source: NSIDC)
Progressive decline of multiyear ice (5 years or older)
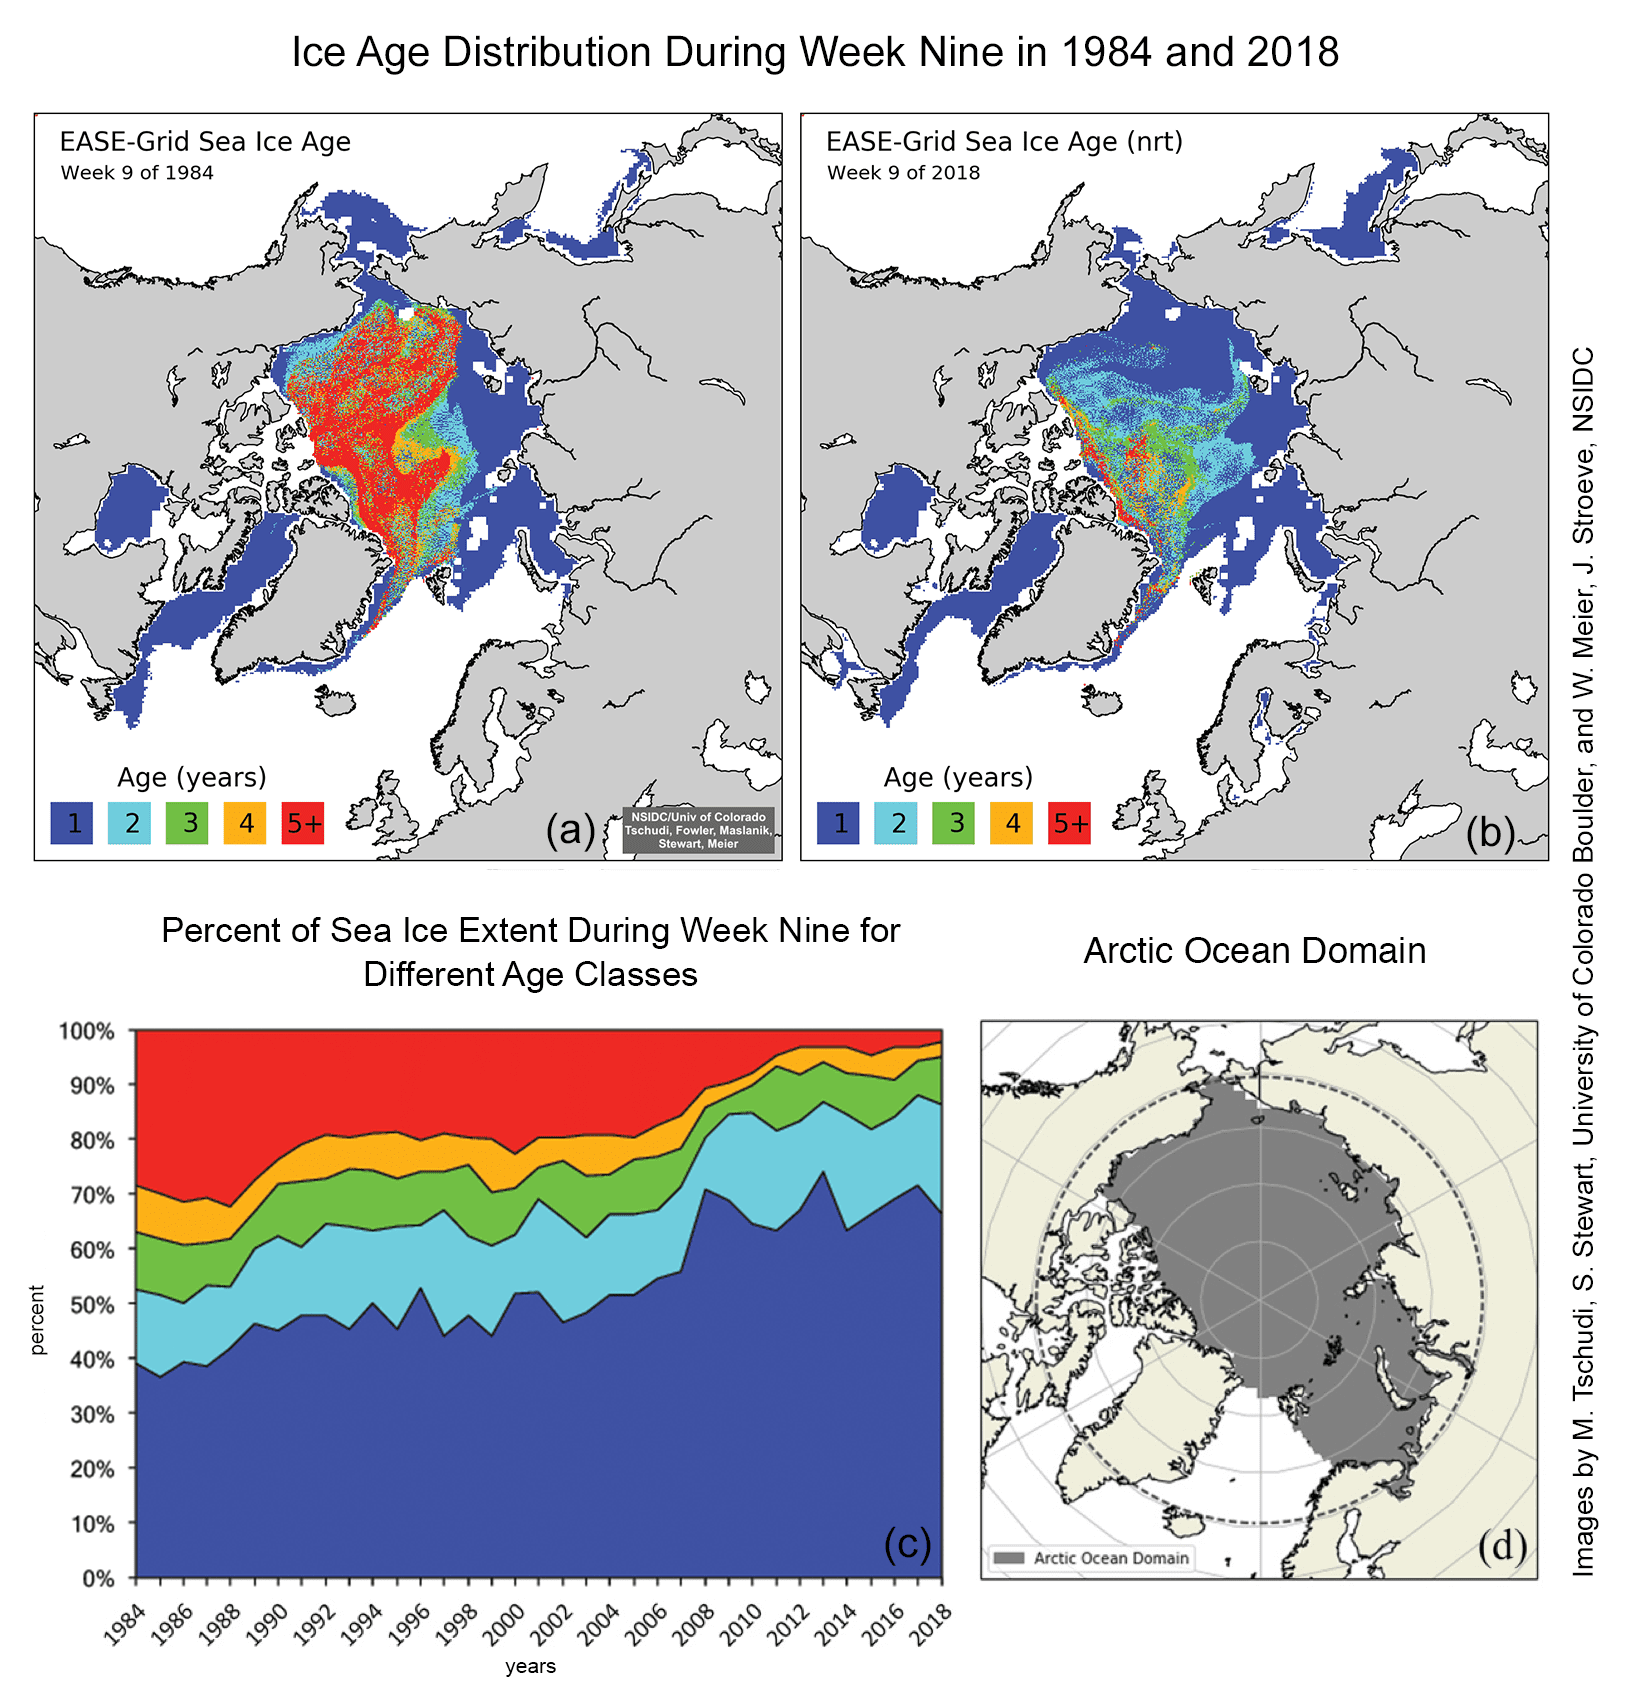
Seasonal sea ice is characterised by a thickness of 1.5 to 2 m during the winter period. In contrast, several-year-old sea ice is often three to four metres thick; this also makes it less vulnerable to rising temperatures. An analysis conducted in calendar week 9 (late February / early March) showed a considerable amount of first-year sea ice in the Beaufort, Chukchi, East Siberian, Laptev, Kara and Barents Seas (see Figure 7). Multiyear ice near the coast of Alaska and Siberia can only be found sporadically in the Beaufort and Chukchi Seas, and a small tongue of two- and three-year-old ice stretches from an area near the North Pole to the New Siberian Islands and the Russian archipelago Severnaya Zemlya. If we consider the Arctic Ocean as a whole, the proportion of multiyear ice has dropped from 61% in 1984 to 34% in 2018. Of that number, only 2% of the ice is more than five years old: the lowest-ever percentage recorded during a winter period. The proportion of first-year ice to multiyear ice depends on the intensity of summertime melting, and on how much ice is exported via the Fram Strait in winter. (Source: NSIDC)
Do warmer winters lead to reduced sea-ice growth?
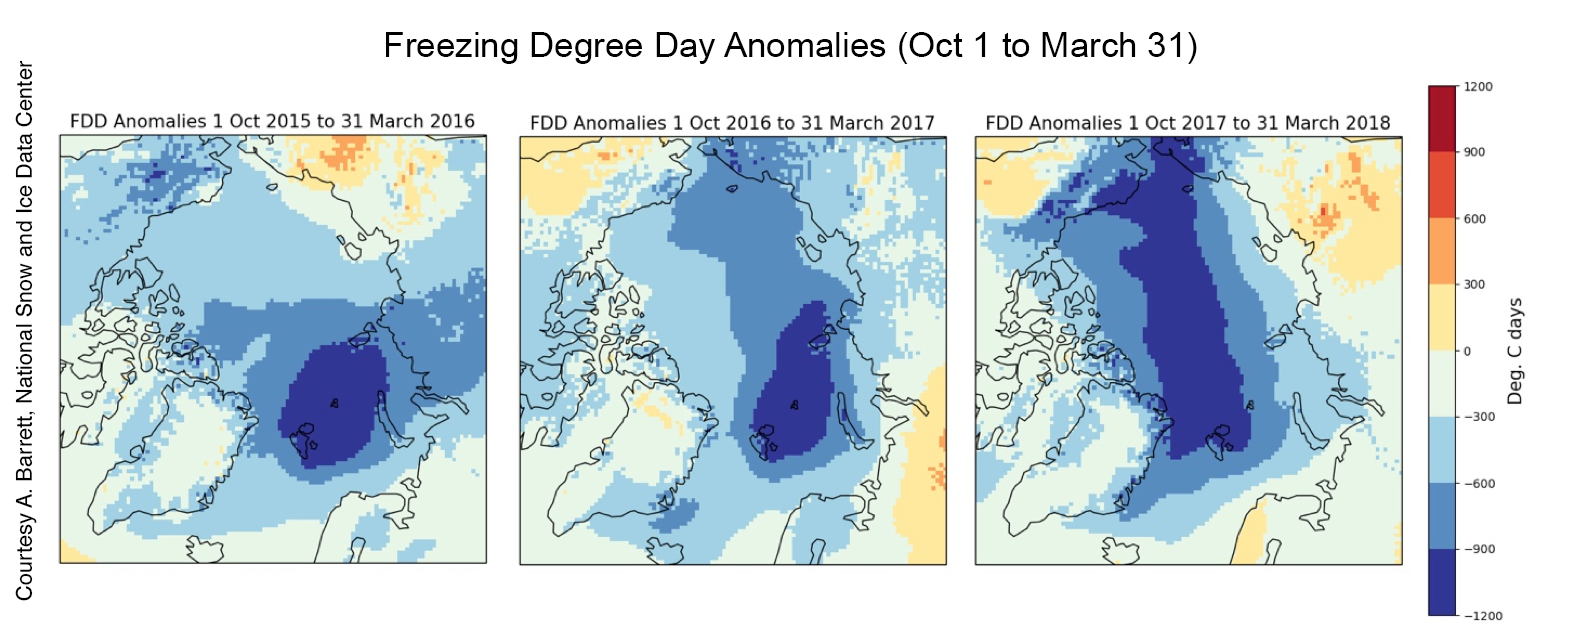
During the past three winters, temperatures at the North Pole have exceeded 0°C. The number of “freezing degree days”, defined as the number of days below the freezing point, multiplied by the number of temperatures below the freezing point (depicted here as 32 degrees Fahrenheit instead of 0° Celsius, as it is based on an American approach), can help us assess the relationship between a warm winter and its effects on sea-ice cover. It offers a simple value upon which to judge how cold it was, and for how long. The number of freezing degree days reflects a wide-scale reduction in the past three winter periods. The greatest drop came last winter (2017/2018) (see Figure 8). (Source: NSIDC)
The general consensus of opinion is that atmospheric-temperature fluctuations during the winter have no significant effects on sea-ice growth. The temperatures are primarily below the freezing point, and the rate of sea-ice growth is higher for thin sea ice than for thicker sea ice. Despite a rise in winter atmospheric temperatures, thermodynamic growth throughout the winter has generally intensified, accompanying the thinner sea ice at the end of the summer. However, this relation appears to have changed since 2012. The sea-ice growth in the winter of 2016/2017 was similar to that in 2003, yet the November sea-ice thickness varies considerably between the two years; in 2016/2017 the ice was substantially thinner. Though no similar analysis is available for the winter of 2017/2018 at this time, it would appear likely that the thermodynamic sea-ice growth last winter was below the long-term average (see Figure 9). (Source: NSIDC)
Unusual polynya forms north of Greenland
In mid-February, an unusually large polynya formed north of Greenland and persisted throughout the first week of March. The polynya was produced by strong southern winds and unusually high atmospheric temperatures. On 24 February 2018, when the polynya reached its maximum size, the atmospheric temperature at Cape Morris Jesup, Greenland’s northernmost station, rose as high as 6.1°C. However, the mean daily average temperature was comparatively low, at just above the freezing point. There have never been such high temperatures since the beginning of record-keeping there (in 1981); normally the temperatures remain below 0°C in February. (Source: NSIDC)
Contacts
- Dr Marcel Nicolaus (AWI)
- Dr Stefan Hendricks (AWI)
Questions?
Contact us via E-Mail or our contact form.
Graphics


