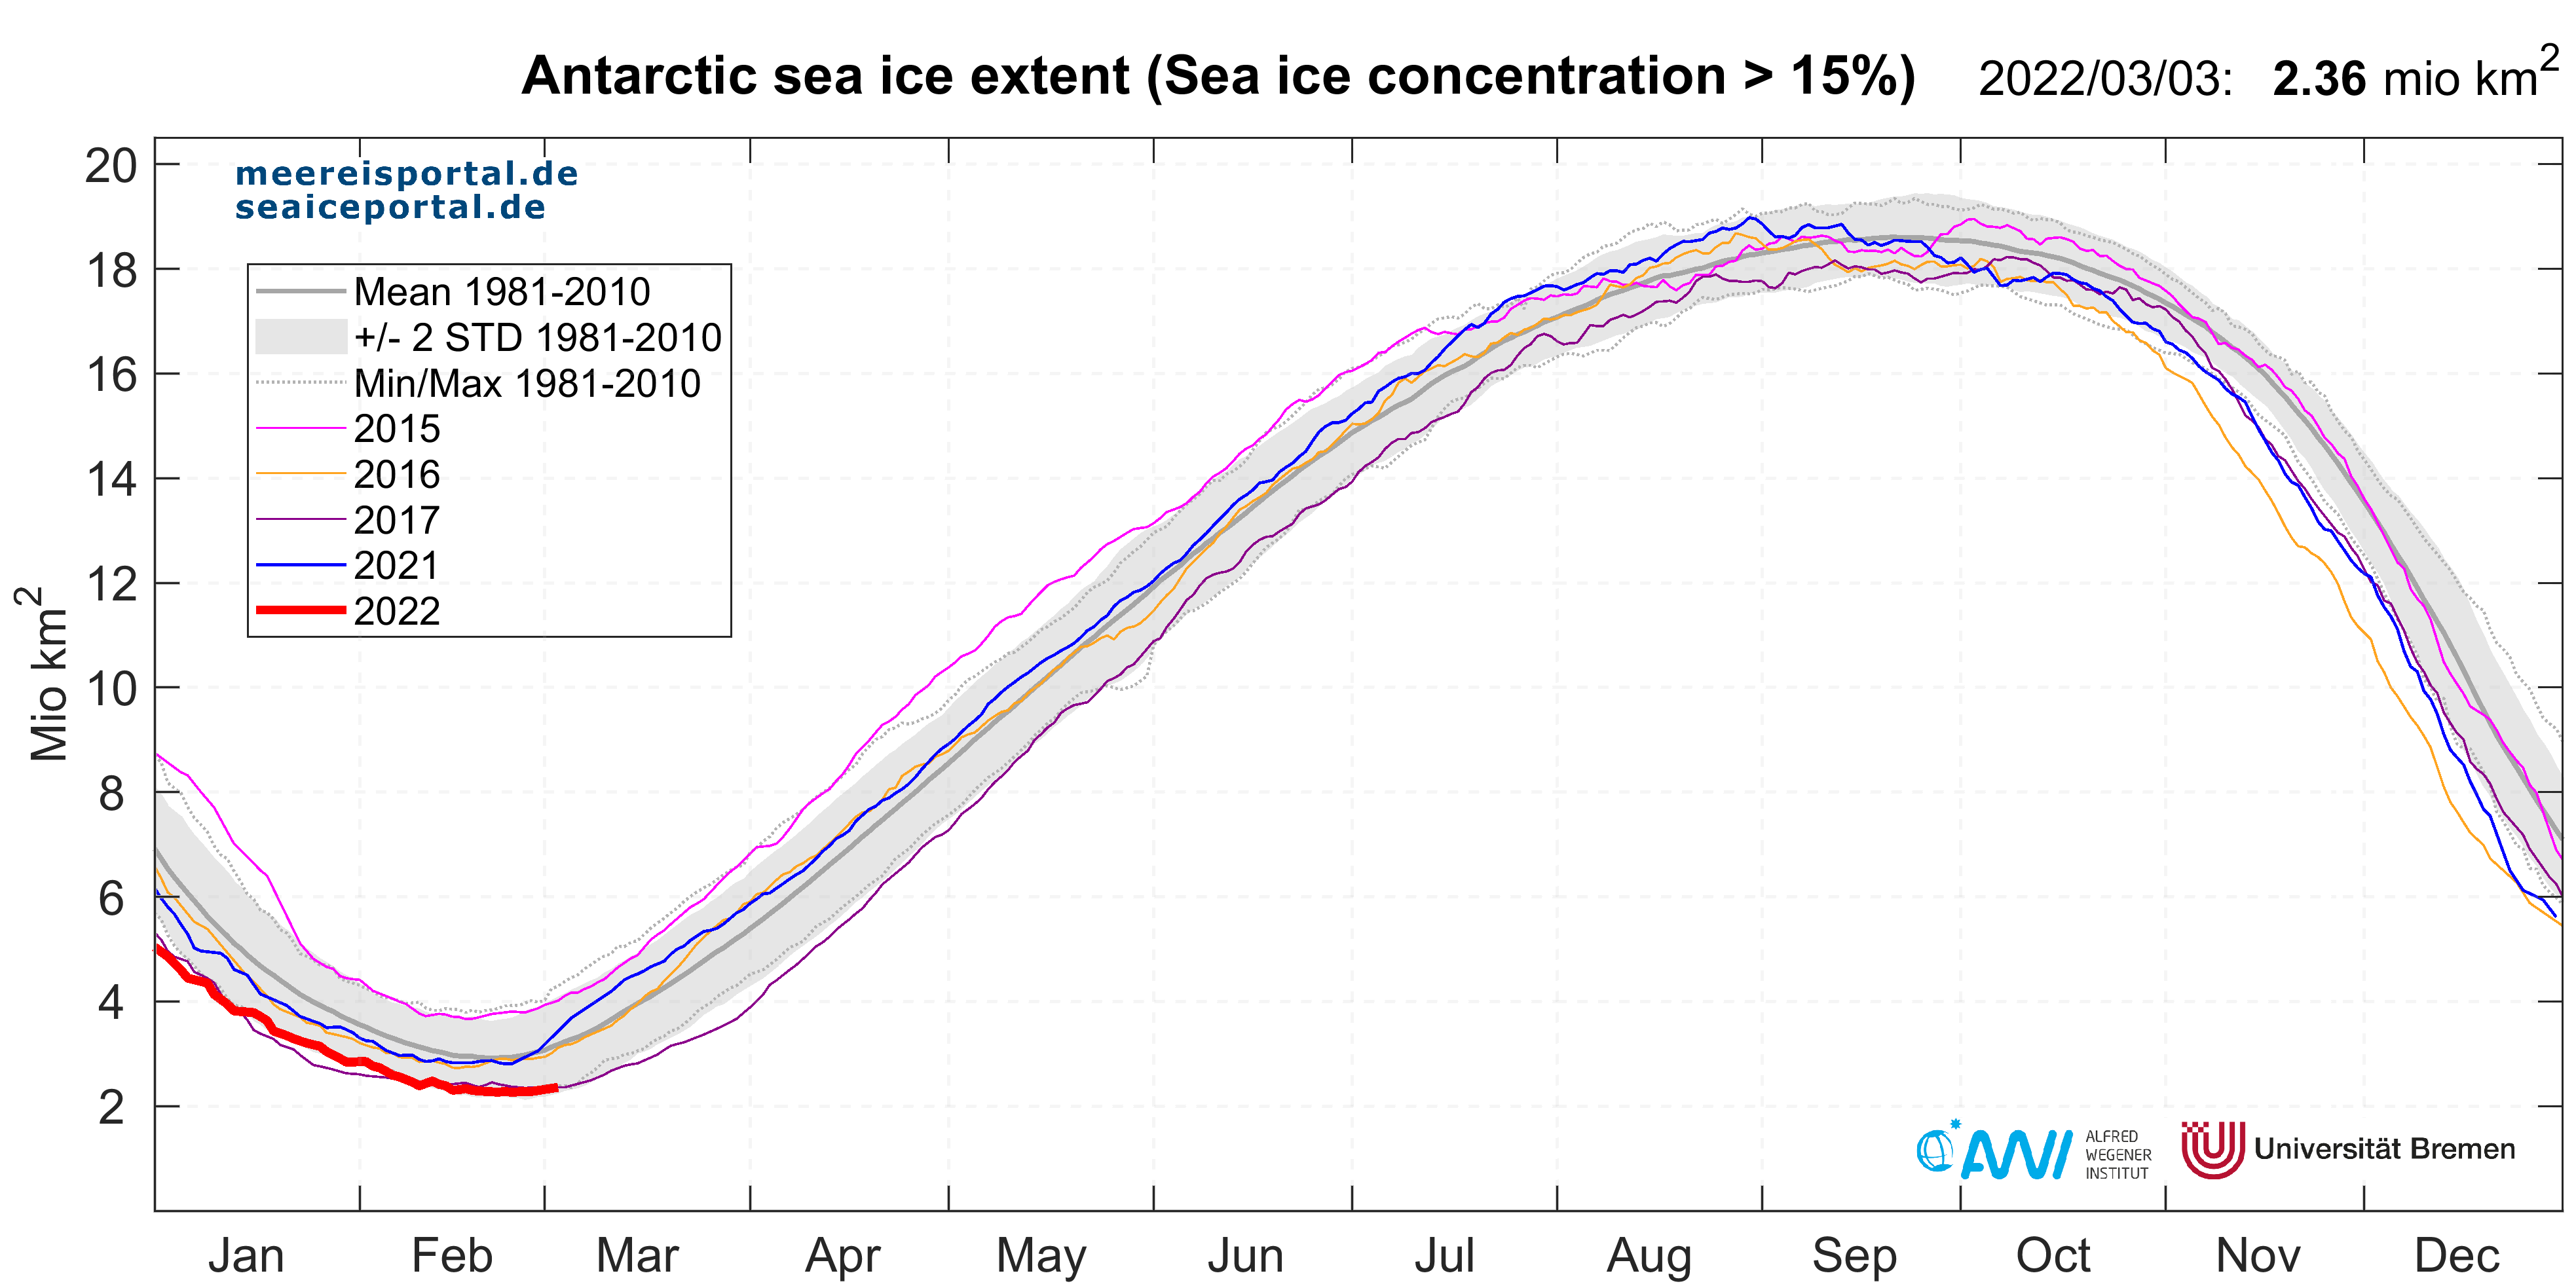
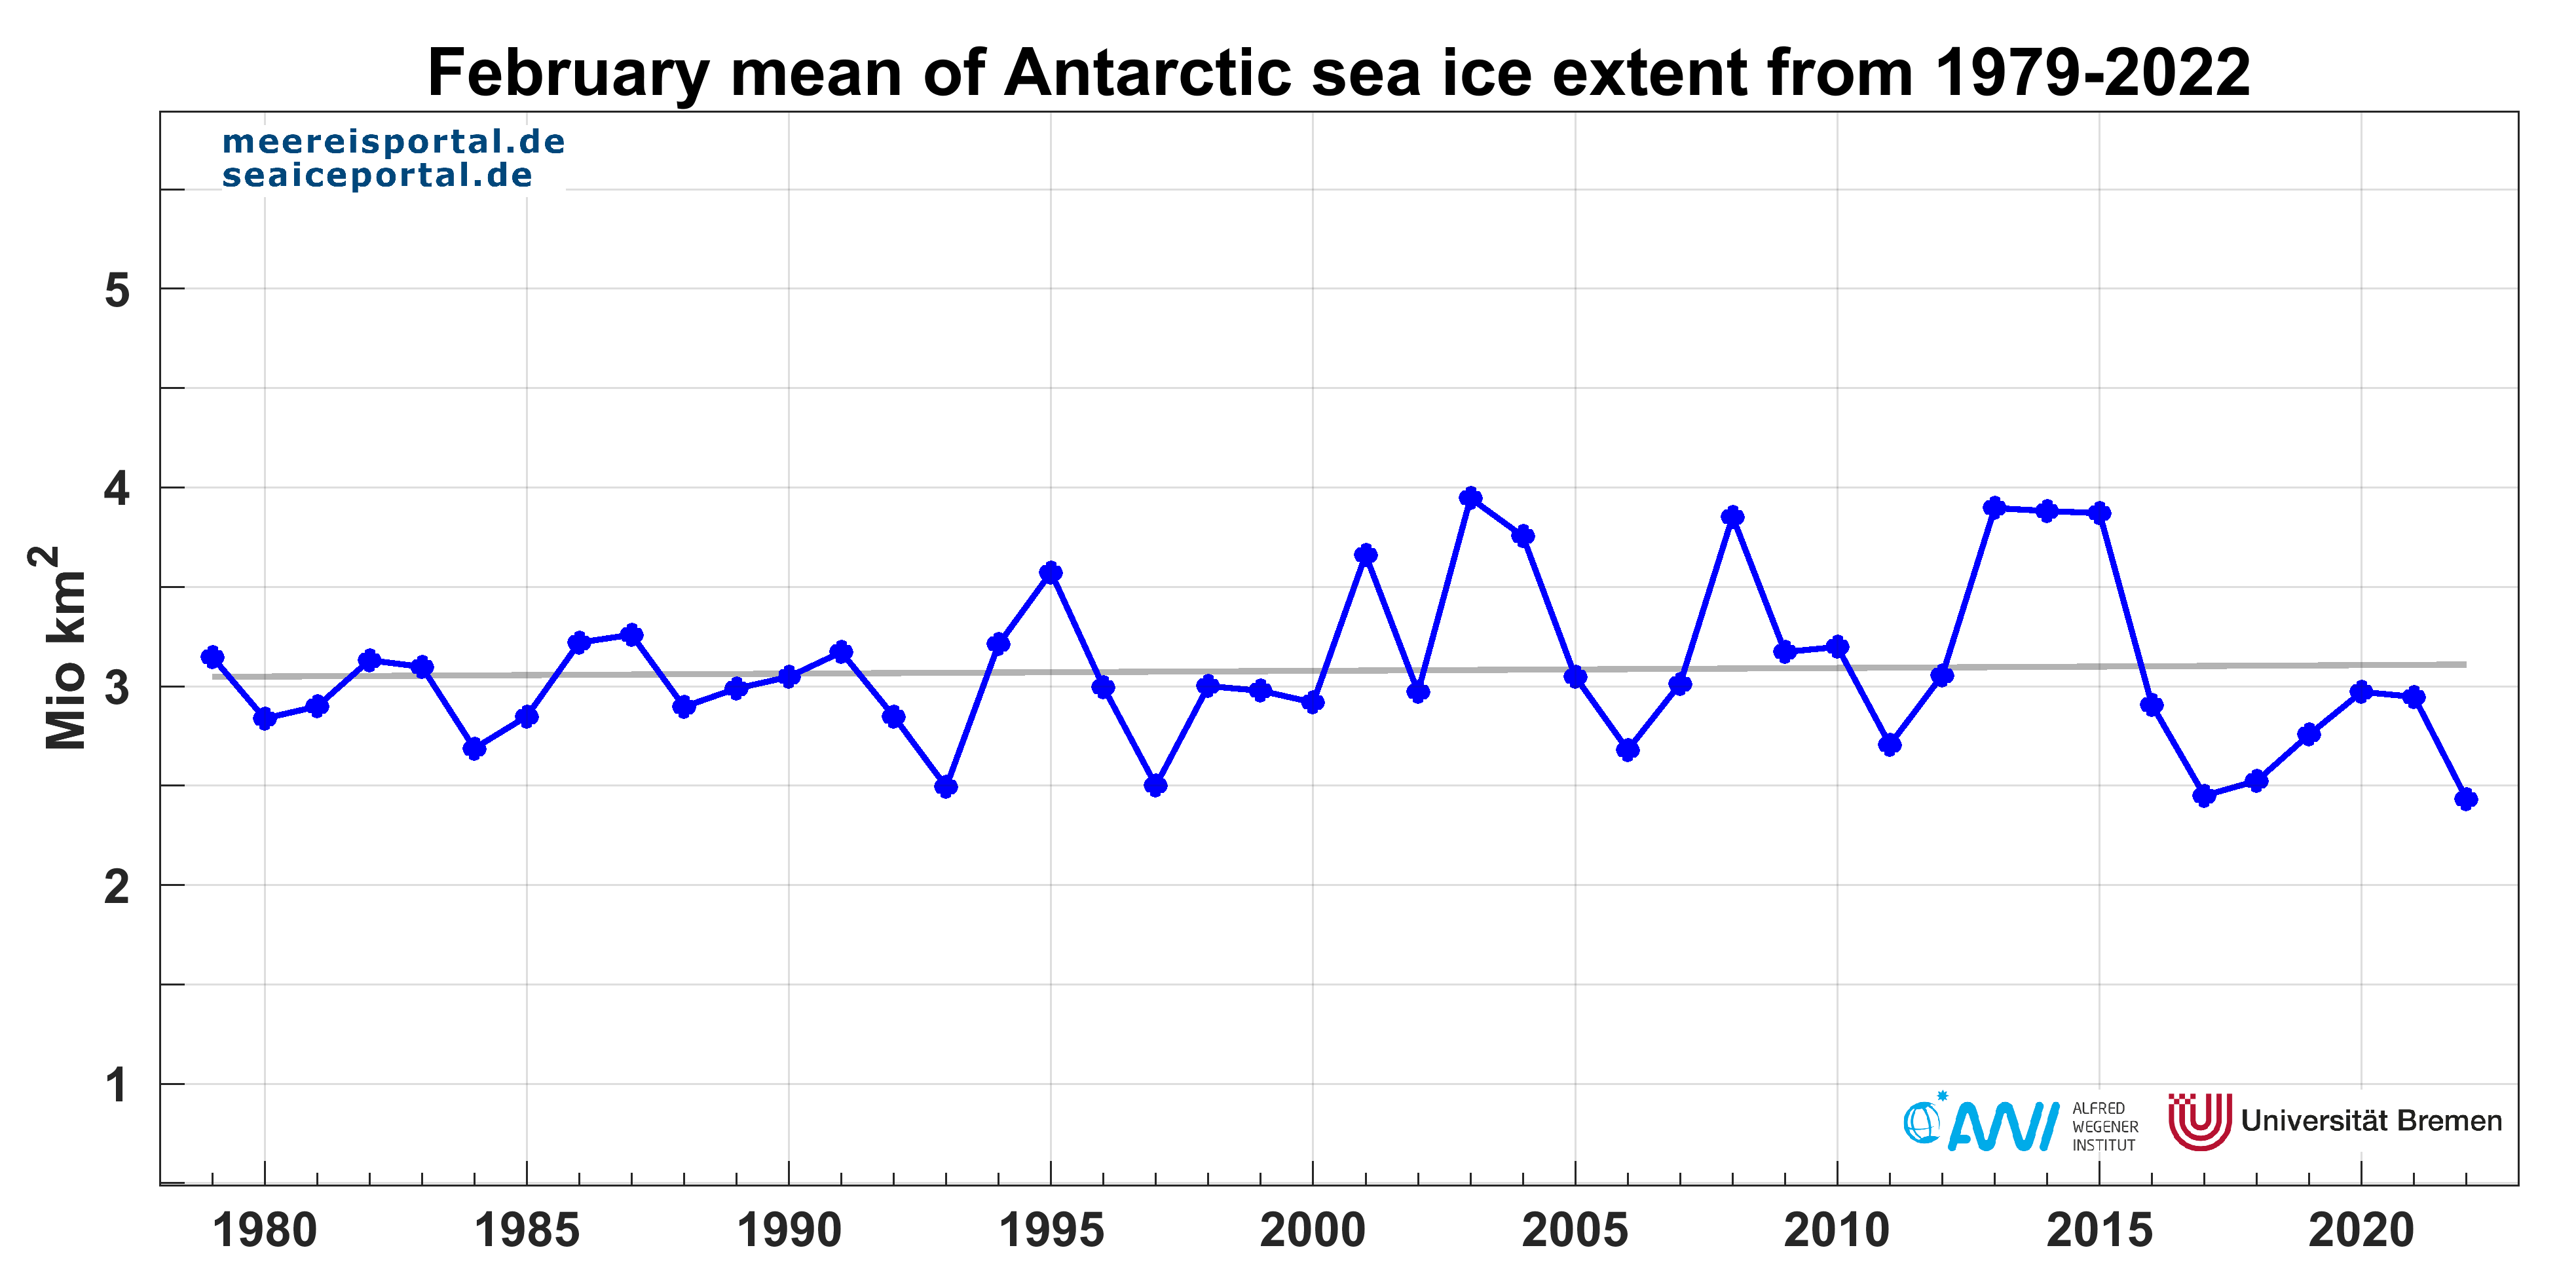
This was a few thousand km2 below the previous record low from 1997. The mean sea-ice extent for February, at 2.4 million km², was another historical low (Figure 2). This minimum is the result of very low ice cover in all sub-regions of the Antarctic, particularly in the Weddell and Ross Seas (Figures 6 and 7). What do these observations tell us about the general climatological trend?
In the Southern Winter, the Antarctic sea ice covers up to 20 million km2 of the Southern Ocean, roughly 25% more area than the maximum extent in the Arctic. In February, the Antarctic sea-ice extent normally reaches its minimum, with values ranging from 2.3 to 3.8 million km2. Consequently, the extent that remains, the February minimum, is only 10-20% the size of the maximum (Figures 1 and 2). While an obvious and statistically significant decline in the summertime minimum (in September) has been observed in the Arctic over the past few years, the trend in the Antarctic had been slightly positive overall, growing by nearly 0.5% per decade (Figure 3). Since 2016, however, a change to increasing ice loss can also be seen in the Antarctic; in the past seven years, the mean sea-ice extent in the month of February has been below the long-term trend. In 2022, the sea-ice extent in the Antarctic is ca. 670,000 km² below the long-term average, an area roughly twice the size of Germany. Given the expected decline in sea ice due to global warming, the long-term increase previously observed is referred to as the Antarctic sea-ice paradox. A study recently released by the Alfred Wegener Institute (AWI) and including high-resolution climate simulations based on the AWI Climate Model offers a possible explanation for the paradox. According to the study, the Antarctic Ocean may absorb more energy than previously assumed, delaying sea-ice retreat. If correct, this could mean that significant sea-ice decline on a scale similar to that in the Arctic isn’t likely to occur until mid-century.
But back to the latest observations. Is the current situation in the Antarctic unusual?
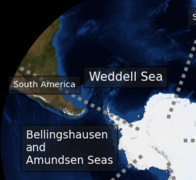
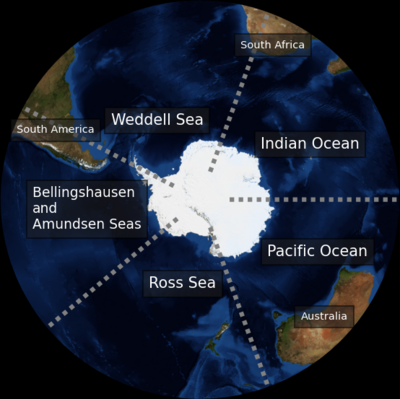
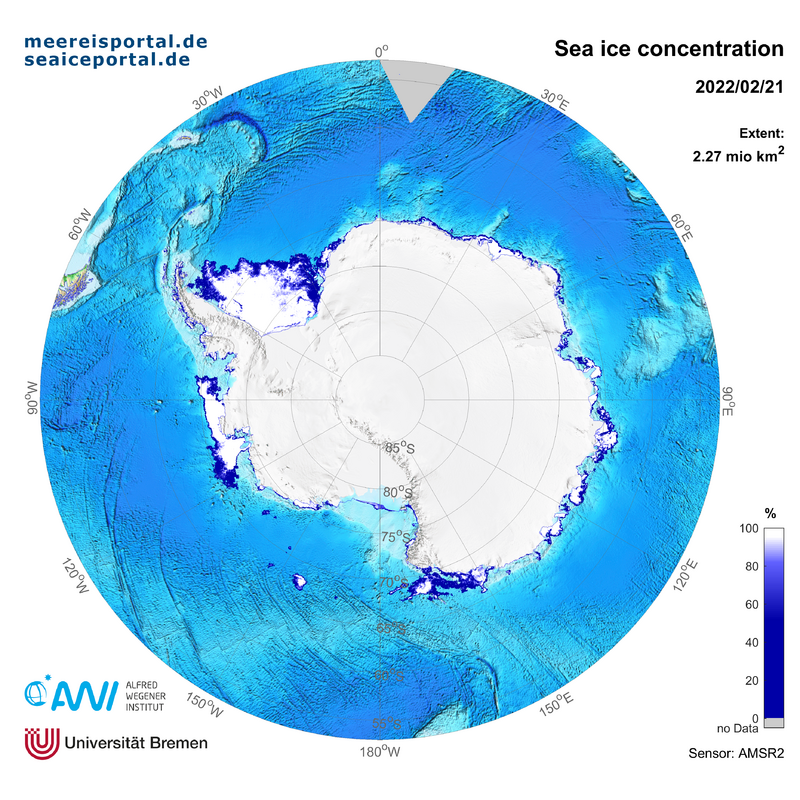
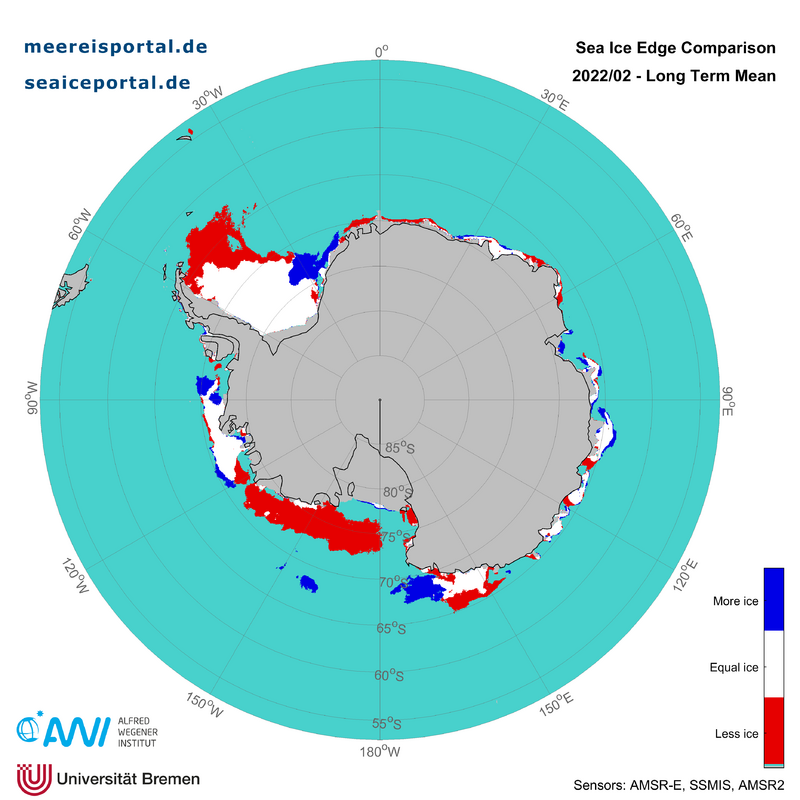
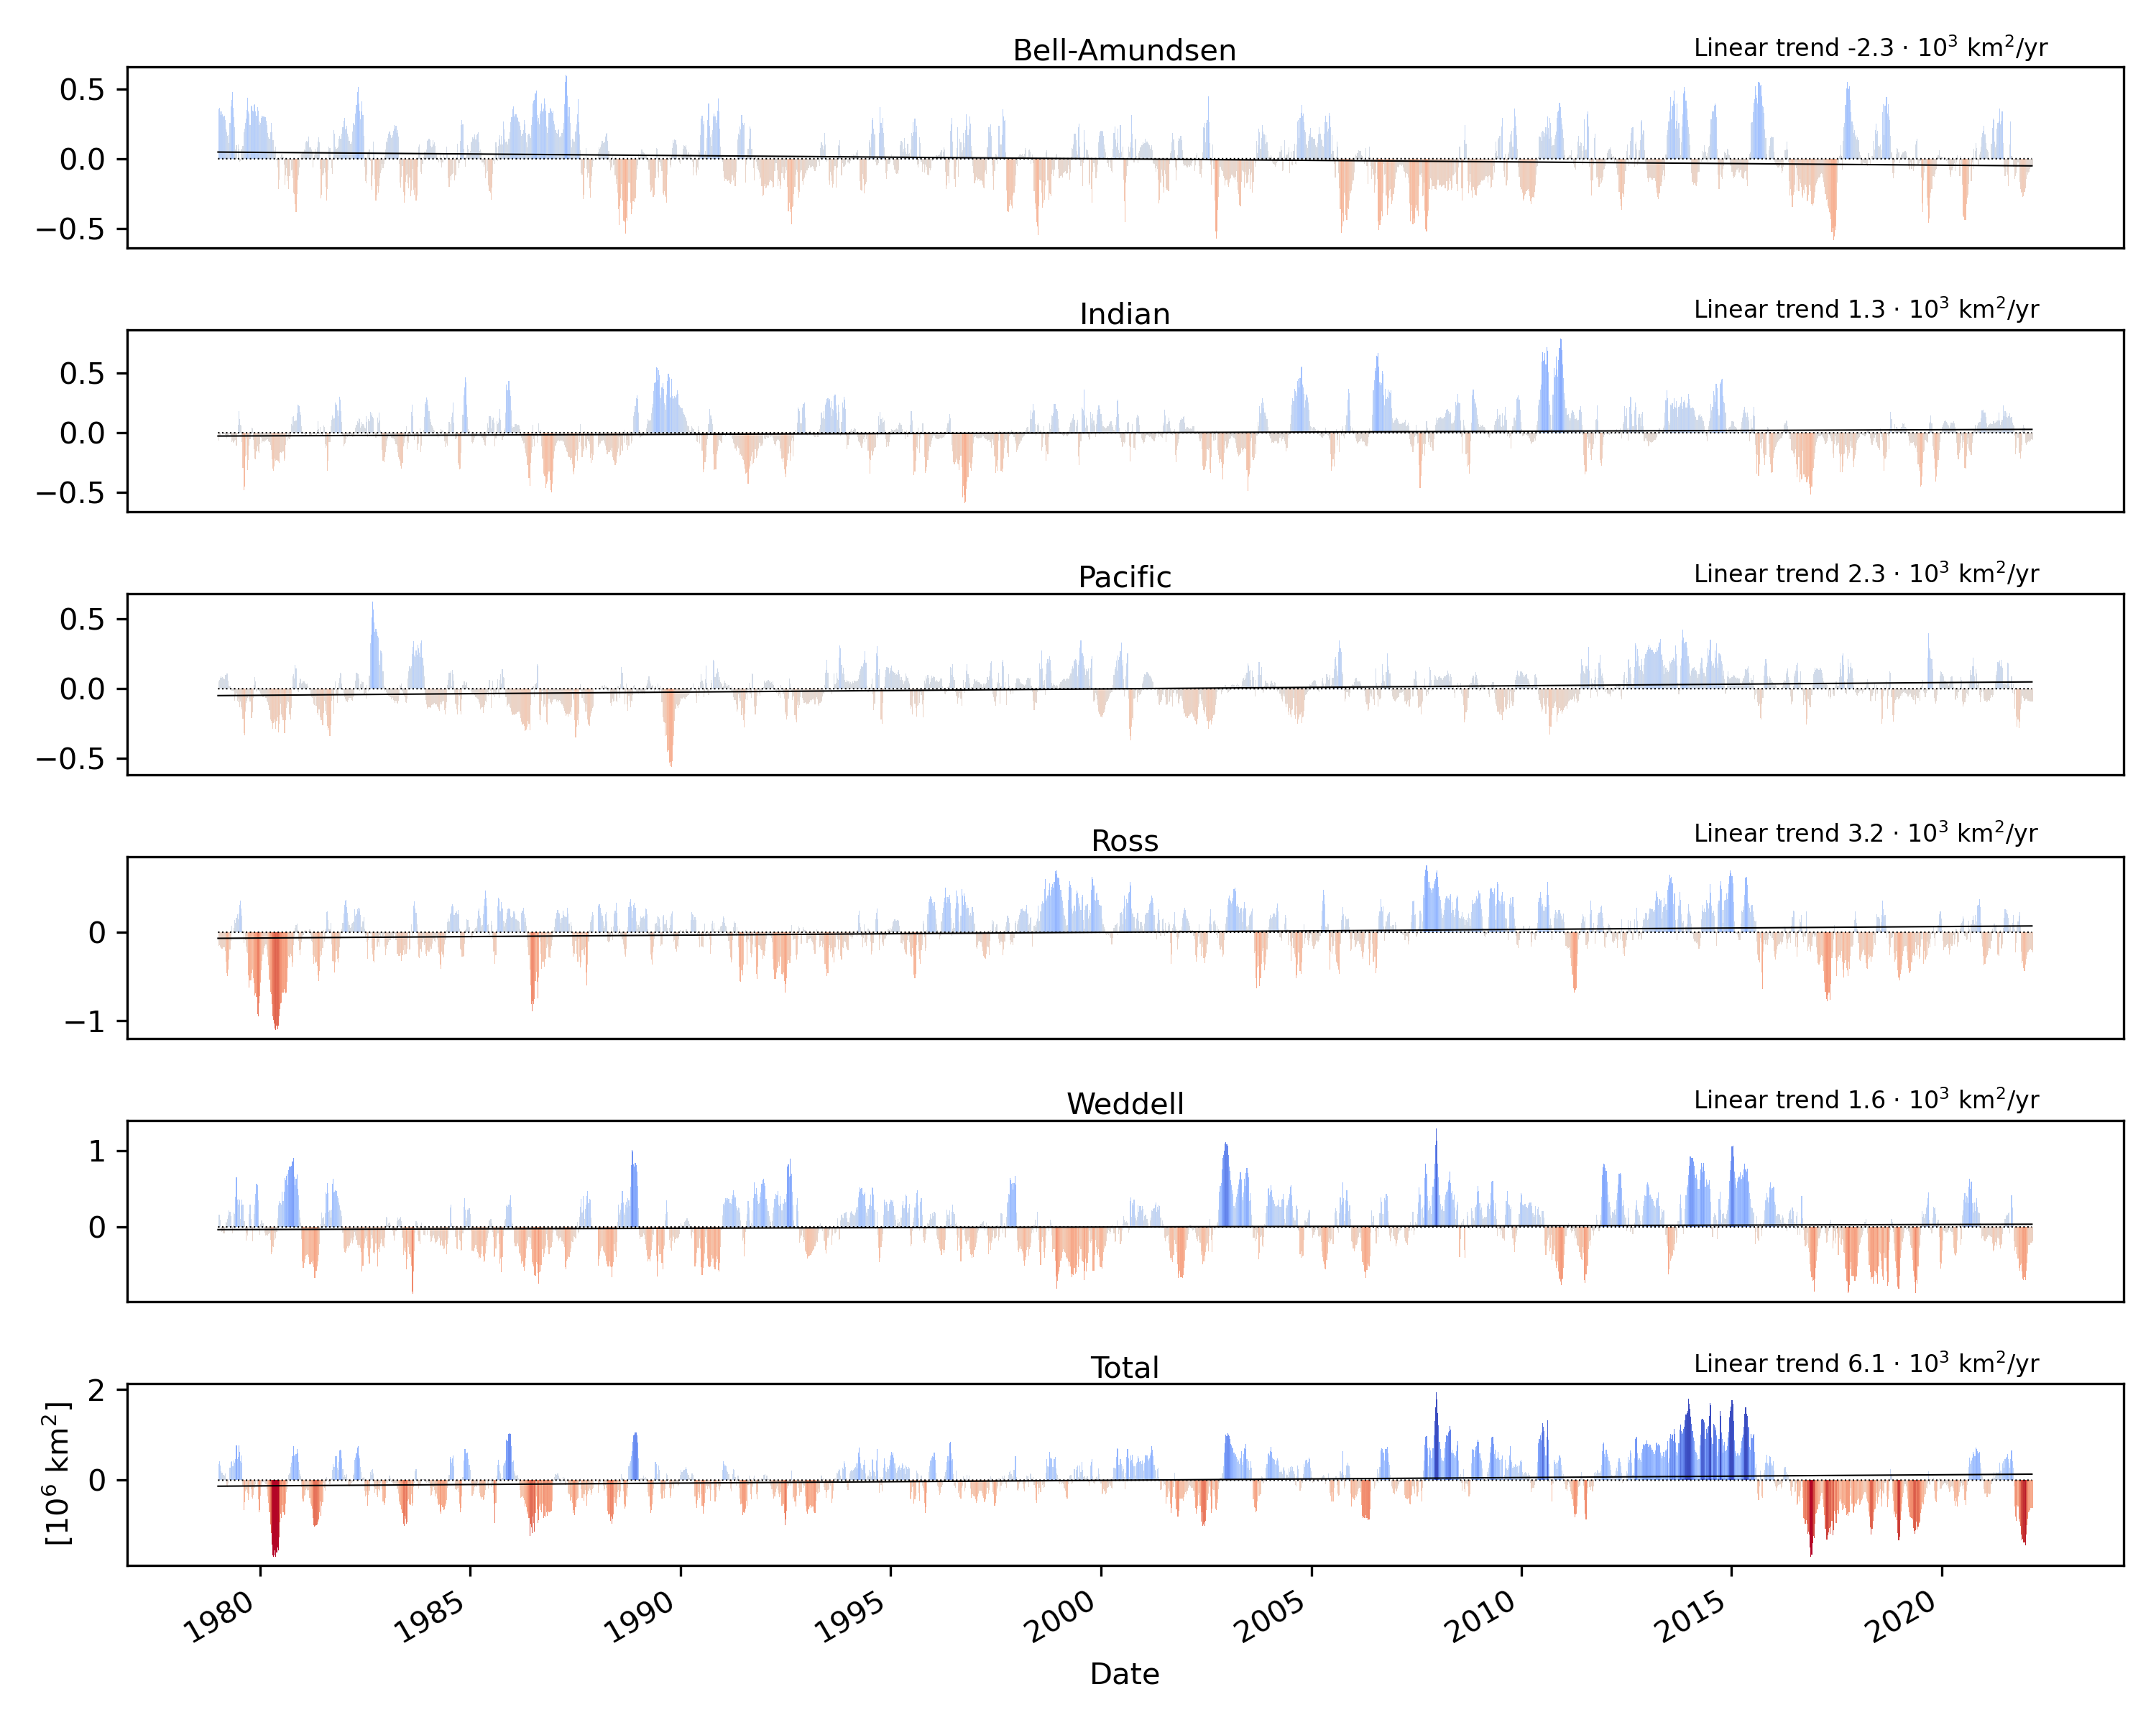
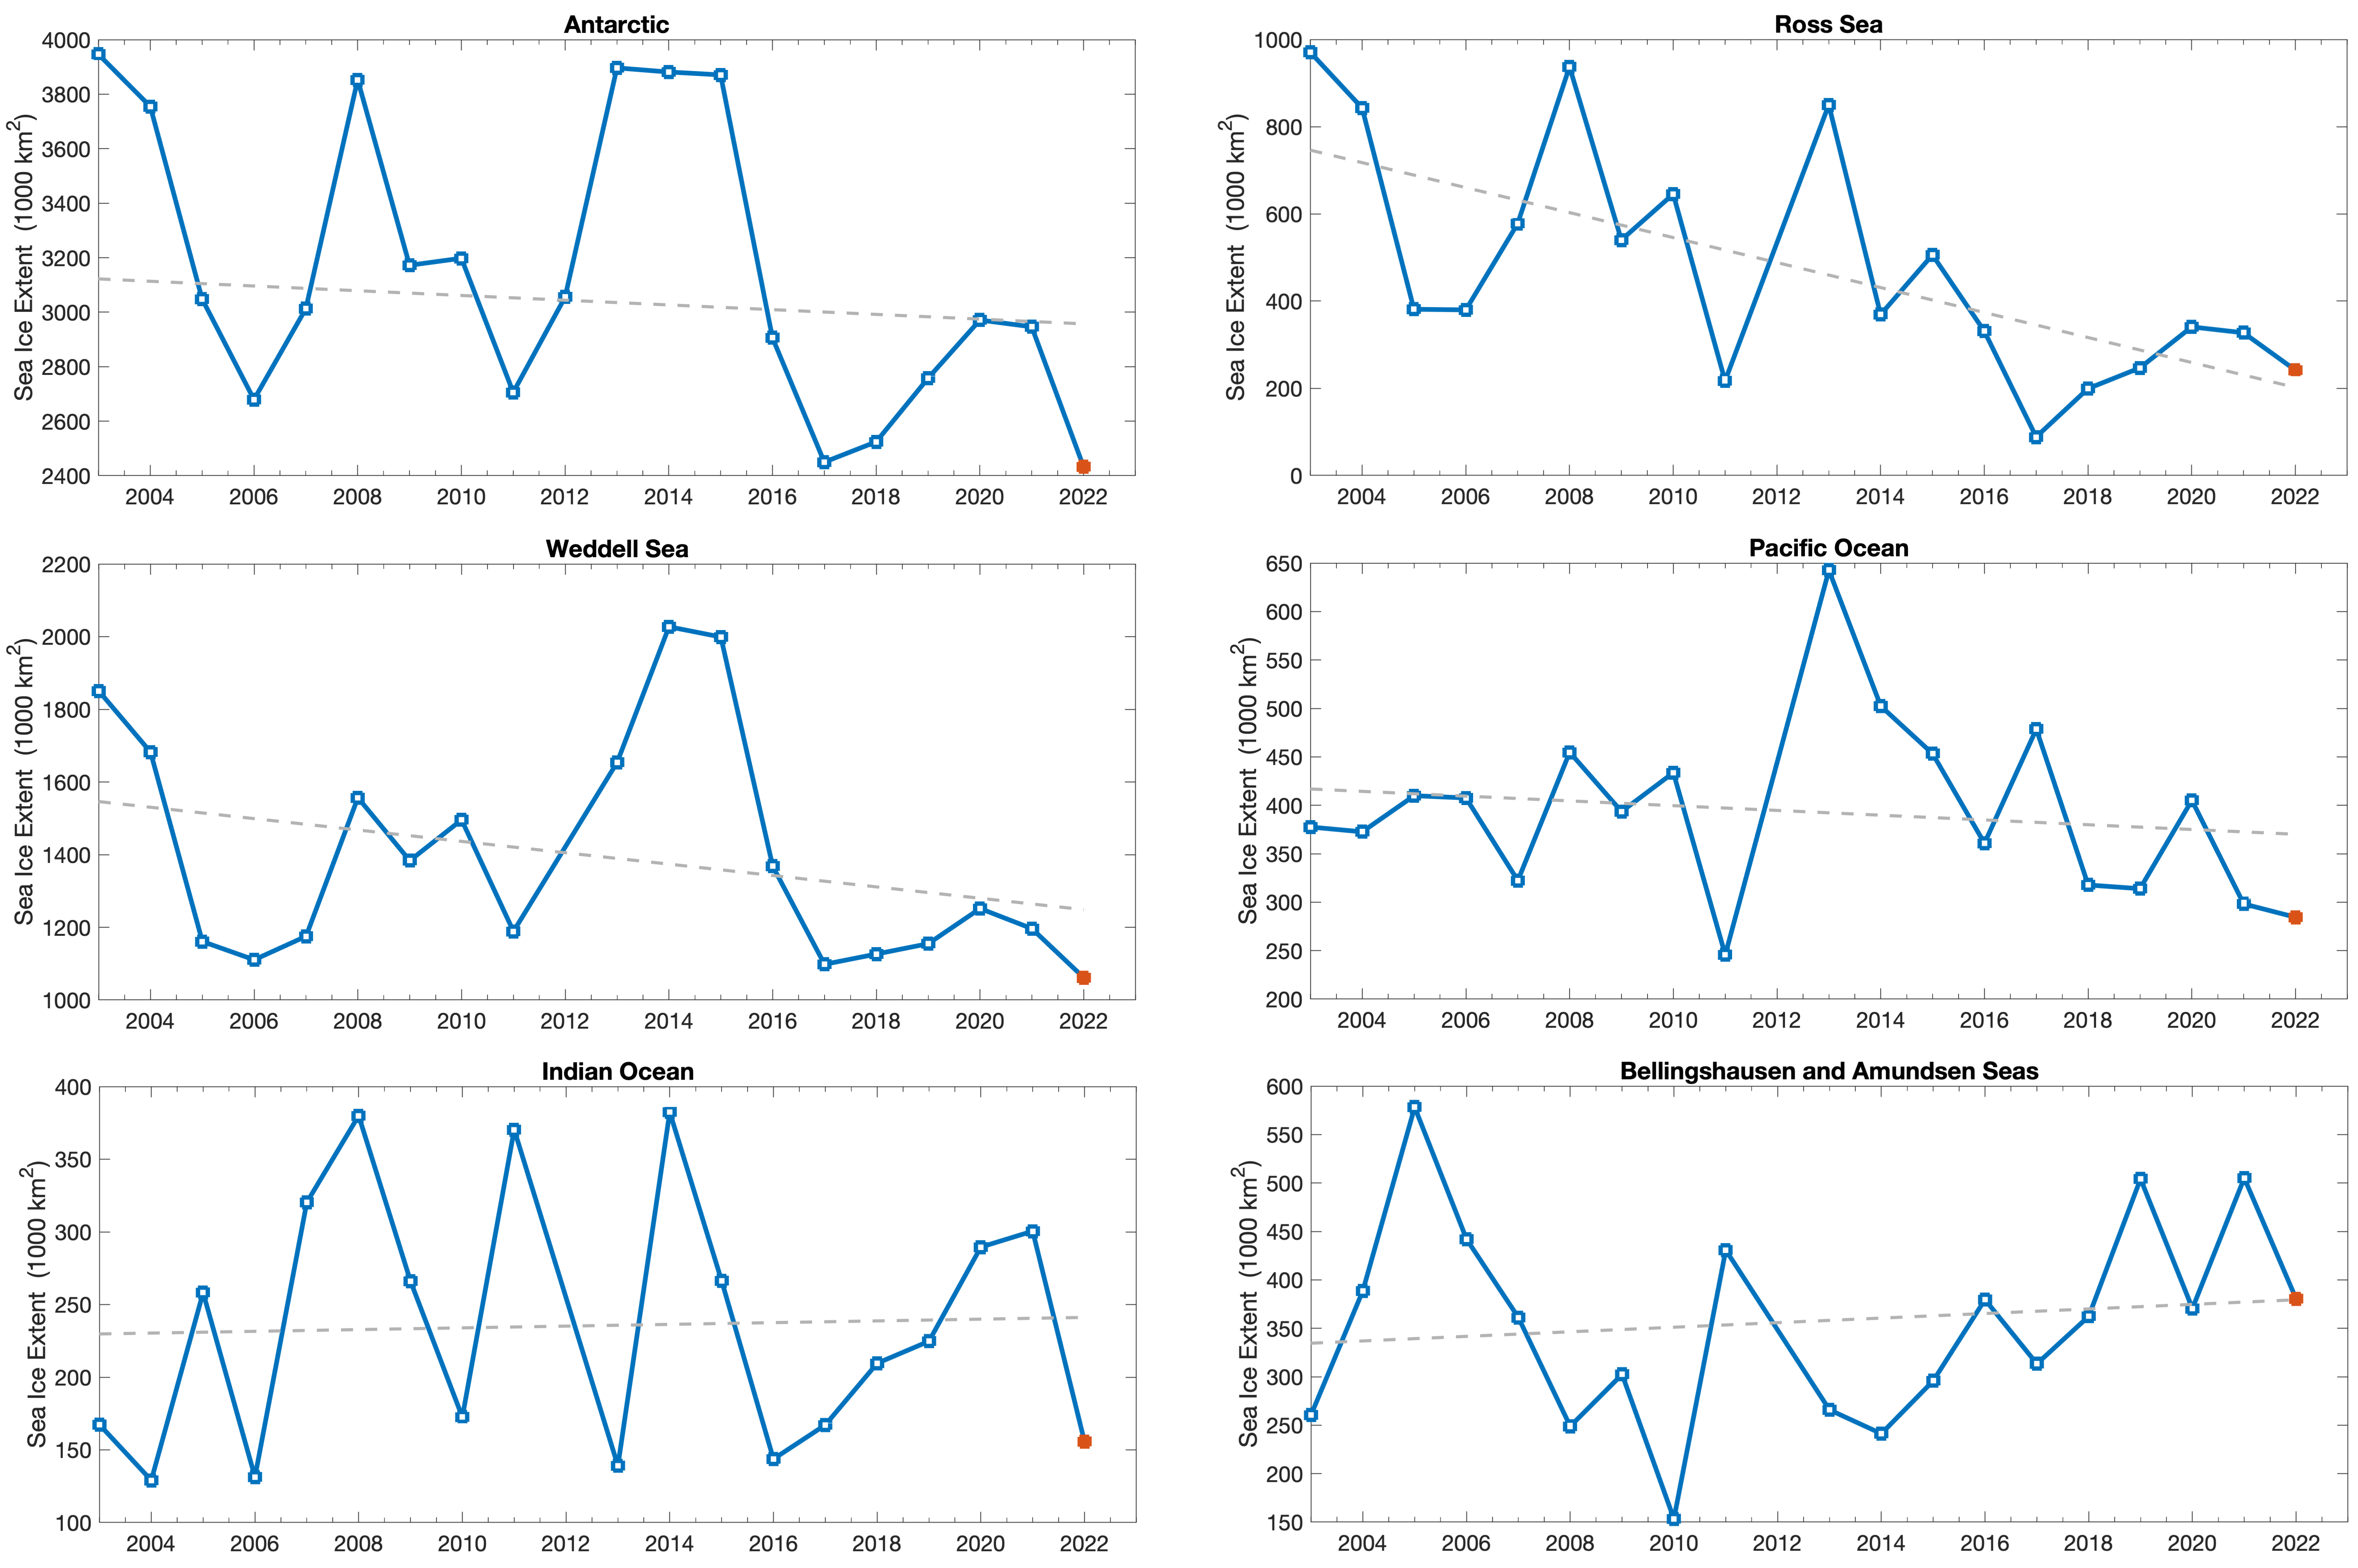
This question shouldn’t be answered solely on the basis of the overall sea-ice extent: there are three regions in which the extent is substantially lower than the long-term average for the years 1981 – 2010. The first region is the northwest Weddell Sea, where the ice edge has retreated far below 65° S (Figure 4). In addition, the shelf margin in the eastern Weddell Sea is nearly ice-free to ca. 30° E. The third region is the Ross Sea in the Pacific sector of the Antarctic. Here, the sea ice virtually disappeared in February, something that has only been seen once before, in 2017. These changes are especially clear in Figures 6 and 7, which show the changes in the sea-ice extent for each region over time. Figure 6 shows the difference between the current sea-ice extent and the mean seasonal fluctuations for the years 1981 – 2020 (Figure 2) in the five regions (Figure 5) and the Antarctic as a whole. It can be clearly seen that in all regions except the Bellingshausen Sea, Amundsen Sea and the Pacific sector, the sea-ice extent has been in decline since 2016. There has been considerable interannual variability in the Bellingshausen and Amundsen Seas, although this is the only sector characterised by a slightly negative overall trend (-2,300 km² / year) in the period 1979 – 2022. These figures on regional ice cover, divided by sector, are provided by the NSIDC for the years of satellite observation from 1979 to the present (Fetterer et al., 2017). A detailed analysis of the Antarctic sea-ice extent for the past 20 years from meereiportal.de AMSR-E/2 satellite data (Spreen et al., 2008) (Figure 7) shows very low values in all regions except the Bellingshausen-Amundsen Sea region. Though the absolute minimum was only reached in the Weddell Sea, given the fact that the sea’s summer extent is at least twice as large as in the other regions, it also produced an absolute low for the Antarctic as a whole this year. Regarding the past 20 years, the loss of sea-ice extent has been highest in the Ross Sea (-60% / decade), followed by the Weddell Sea (-11% / decade). The other regions are characterised by slightly positive and negative trends, none of which are significant. But this time series, starting in 2003, is still relatively short, and trends can be influenced by decadal variability.
The animation in Figure 8 shows the development of the sea-ice extent since December 2021, while Figure 9 shows the current situation in comparison to the previous record low monthly mean (in February 2017) as a detail view of the Bellingshausen-Amundsen Sea and Weddell Sea sectors.
If we compare the time series on the regional sea-ice extent in February with the current value, we arrive at the following conclusions:
- The Ross Sea has experienced the greatest loss of summer ice cover in the past two decades.
- In the Weddell Sea, too, the sea-ice extent in February was very low in comparison to the climatological mean and the lowest in the past 20 years. However, there were even lower values in the 1980s and 1990s than in 2022.
- In the remaining sectors, the extent in February 2022 was also low. But here, too, there were even lower values than in February 2022 in the past.
Generally speaking, the 2022 sea-ice minimum can be explained by relatively low extents in all regions (Figures 6 and 7), which have been particularly pronounced in the Weddell and Ross Seas. There is no absolute record value to be found in the regional time series; the record concerns the sum of the values in all sectors, i.e., the overall sea-ice extent.
Is the record low in February 2022 remarkable from a statistical standpoint?
In fact, there were two new record lows: in the daily data on overall sea-ice extent, and in the monthly mean. The latter was still relatively close to the value from February 2017 and still just inside the span of two standard deviations from the long-term average. As such, it’s not improbable that this value was produced by random natural variability. It is well established that there is a pronounced variability – on a decadal and even centennial scale – in the oceanic and atmospheric conditions that influence the Antarctic sea ice (Latif et al., 2013). Consequently, this individual record value has no particular relevance in a statistical sense. Yet the record low is also part of a seven-year series of relatively low summer sea-ice extents in the Antarctic, following on the heels of several unusually high sea-ice extents in the years 2013 – 2015 (Figure 3). This increased variability is remarkable.
For the purposes of climatological observations, a seven-year string of low sea-ice extents isn’t remotely long enough to rule out decadal variability as the cause. On the other hand, it could be the beginning of a new period of low sea-ice extents in the Antarctic. Only the next several years will tell us. At the moment, the long-term, slightly positive trend for the Antarctic as a whole is not significant (IPCC, 2021).
The previous long-term increase in Antarctic sea-ice extent was largely driven by changed local ice dynamics in the Ross Se and eastern Weddell Sea (in particular by a changed wind regime; Holland and Kwok, 2012). Accordingly, regional observations are highly relevant in the Antarctic. For example, ice loss has been observed in the vicinity of the Antarctic Peninsula in past decades. When these effects coincide with ice loss in the Ross and Weddell Seas, as was the case this year, the result can be record low Antarctic sea-ice extents like the one observed in 2022.
Contact
- Lars Kaleschke (AWI)
- Gunnar Spreen (Uni Bremen)
- Marcel Nicolaus (AWI)
- Christian Melsheimer (Uni Bremen)
- Klaus Grosfeld (AWI)
Questions?
Contact us via E-Mail or our contact form.
References
- Fetterer, F., K. Knowles, W. N. Meier, M. Savoie, and Windnagel, A. K. (2017): updated daily. Sea Ice Index, Version 3. [Indicate subset used]. Boulder, Colorado USA. NSIDC: National Snow and Ice Data Center. doi: doi.org/10.7265/N5K072F8
- Holland, P. R. and R. Kwok (2012). Wind-driven trends in Antarctic sea-ice drift. Nature Geosci., 5(12), 872-875. doi: doi.org/10.1038/ngeo1627
- IPCC (2021): Summary for Policymakers. In: Climate Change 2021: The Physical Science Basis. Contribution of Working Group I to the Sixth Assessment Report of the Intergovernmental Panel on Climate Change [Masson-Delmotte, V., P. Zhai, A. Pirani, S.L. Connors, C. Péan, S. Berger, N. Caud, Y. Chen, L. Goldfarb, M.I. Gomis, M. Huang, K. Leitzell, E. Lonnoy, J.B.R. Matthews, T.K. Maycock, T. Waterfield, O. Yelekçi, R. Yu and B. Zhou (eds.)].
- Latif, M., Martin, T., and Park, W. (2013): Southern Ocean Sector Centennial Climate Variability and Recent Decadal Trends. Journal of Climate, 26(19), 7767–7782. doi: doi.org/10.1175/jcli-d-12-00281.1
- Parkinson, C. L. and Cavalieri, D. J. (2012): Antarctic sea ice variability and trends, 1979–2010, The Cryosphere, 6, 871–880, doi.org/10.5194/tc-6-871-2012.
- Spreen, G., L. Kaleschke, & G. Heygster (2008). Sea ice remote sensing using AMSR-E 89-GHz channels. J. Geophys. Res. Oceans, 113, C02S03. doi: doi.org/10.1029/2005JC003384
- Stöckli, R., Vermote, E., Saleous, N., Simmon R. and Herring, D. (2005): The BlueMarble Next Generation - A true color Earth dataset including seasonal dynamics from MODIS. Published by the NASA Earth Observatory.
Graphics
.")


.")


