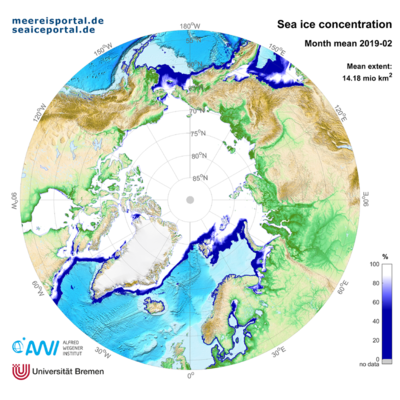
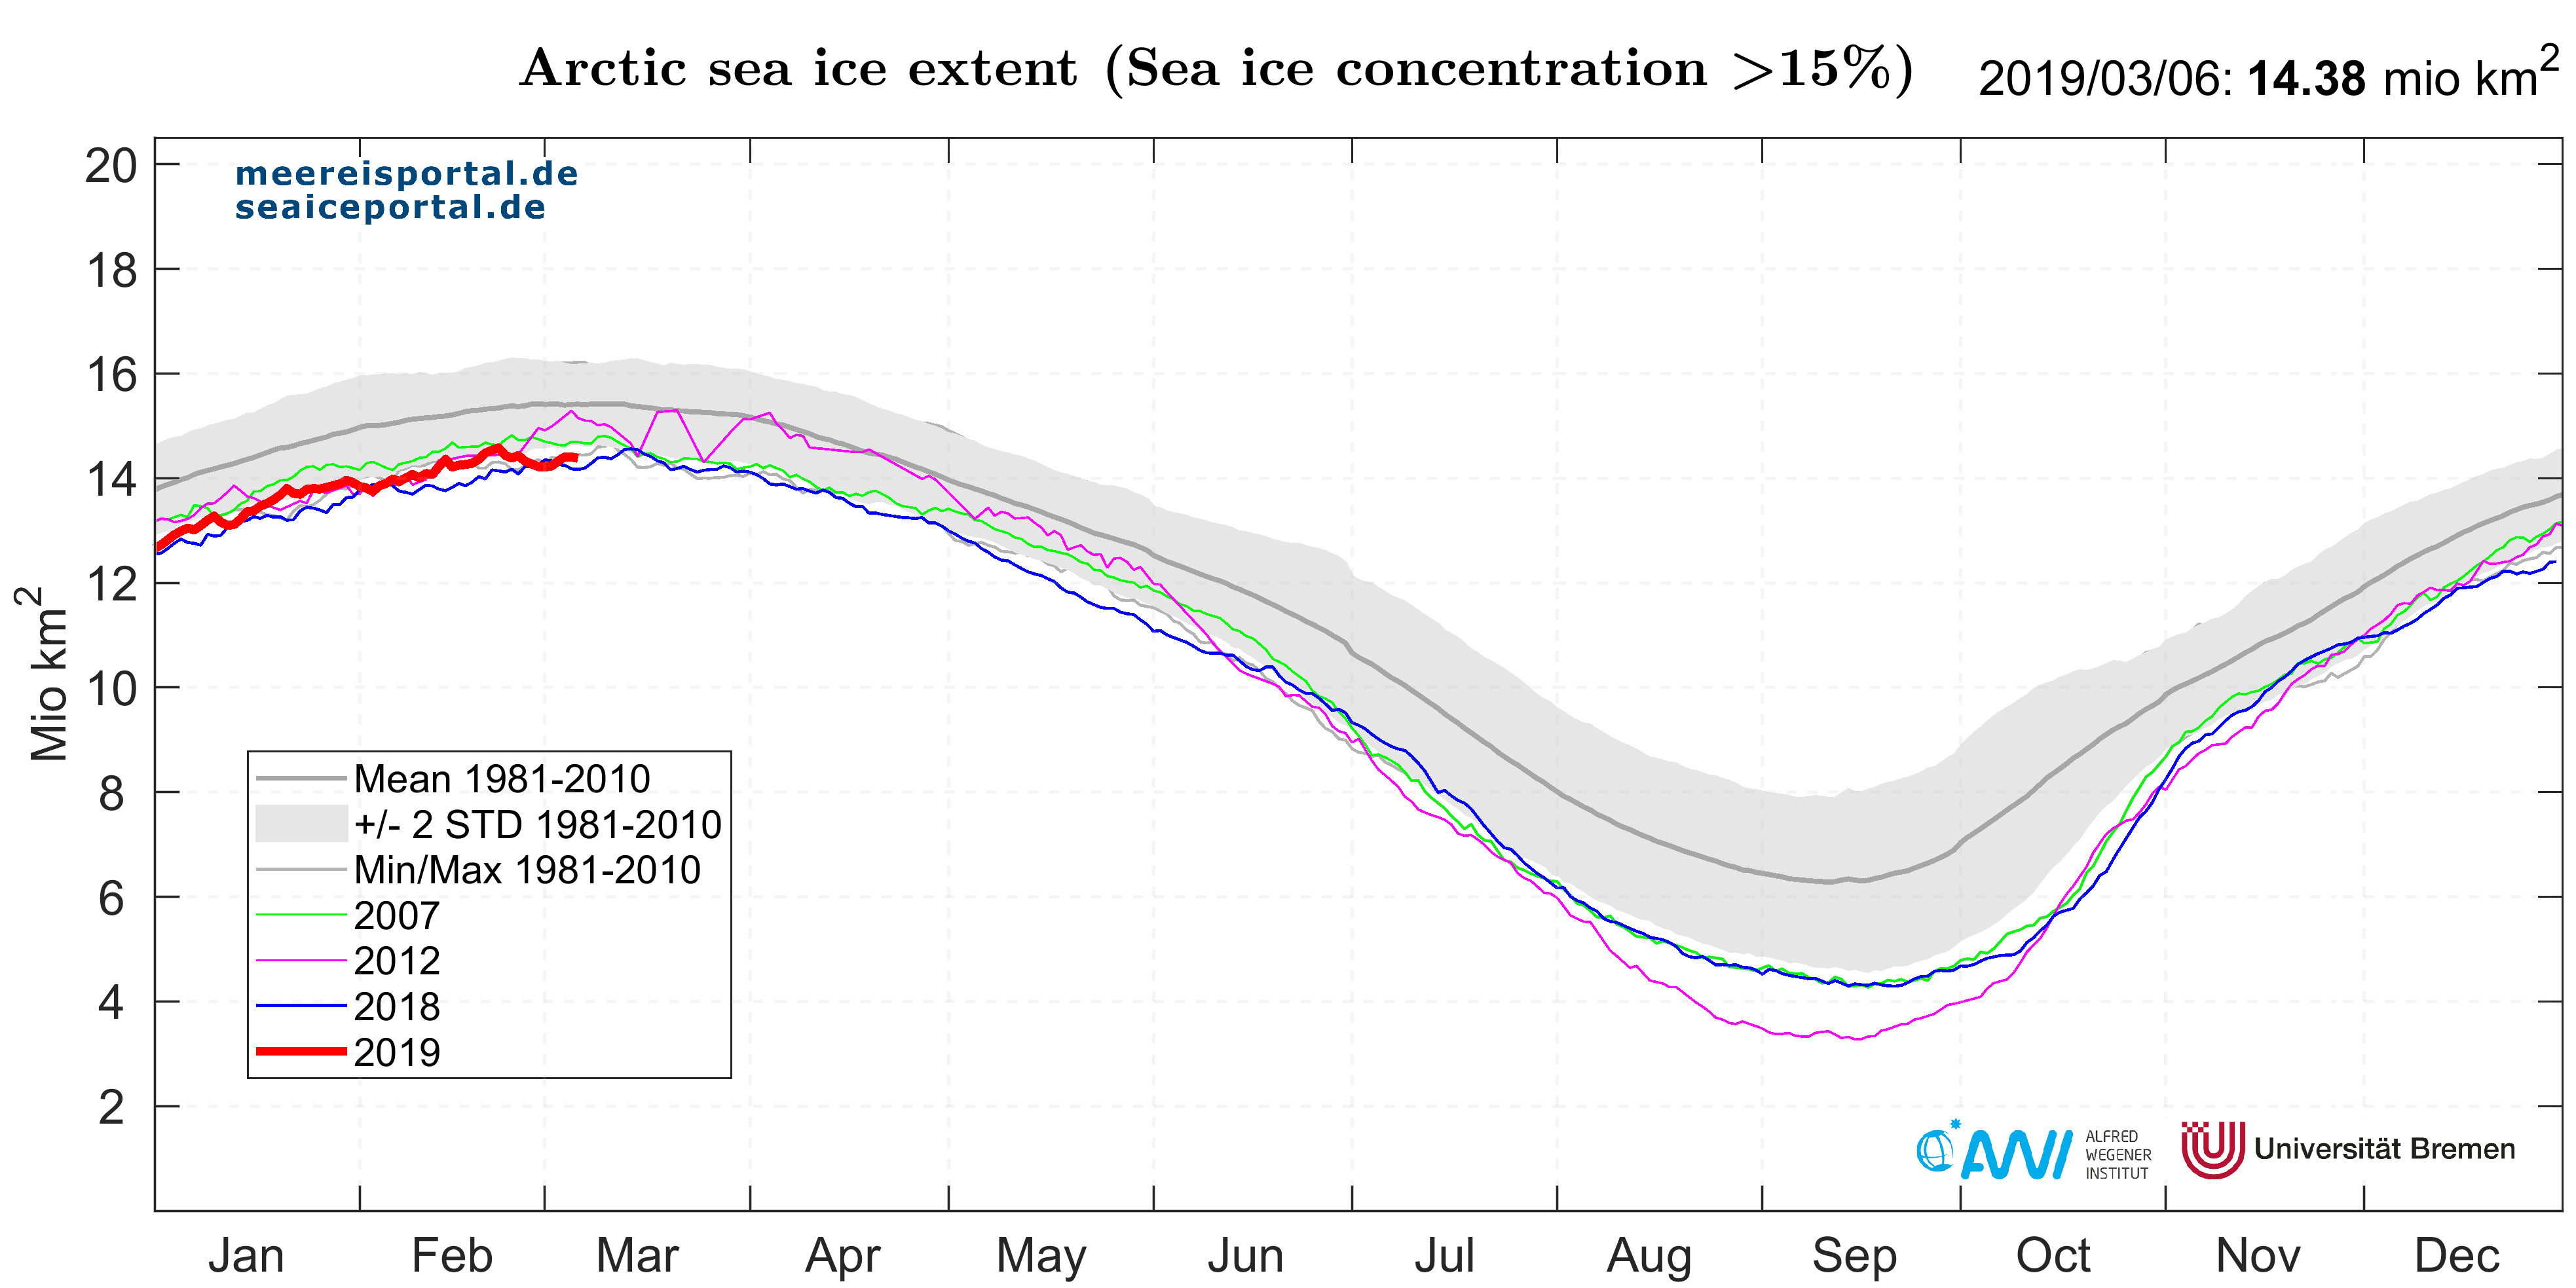
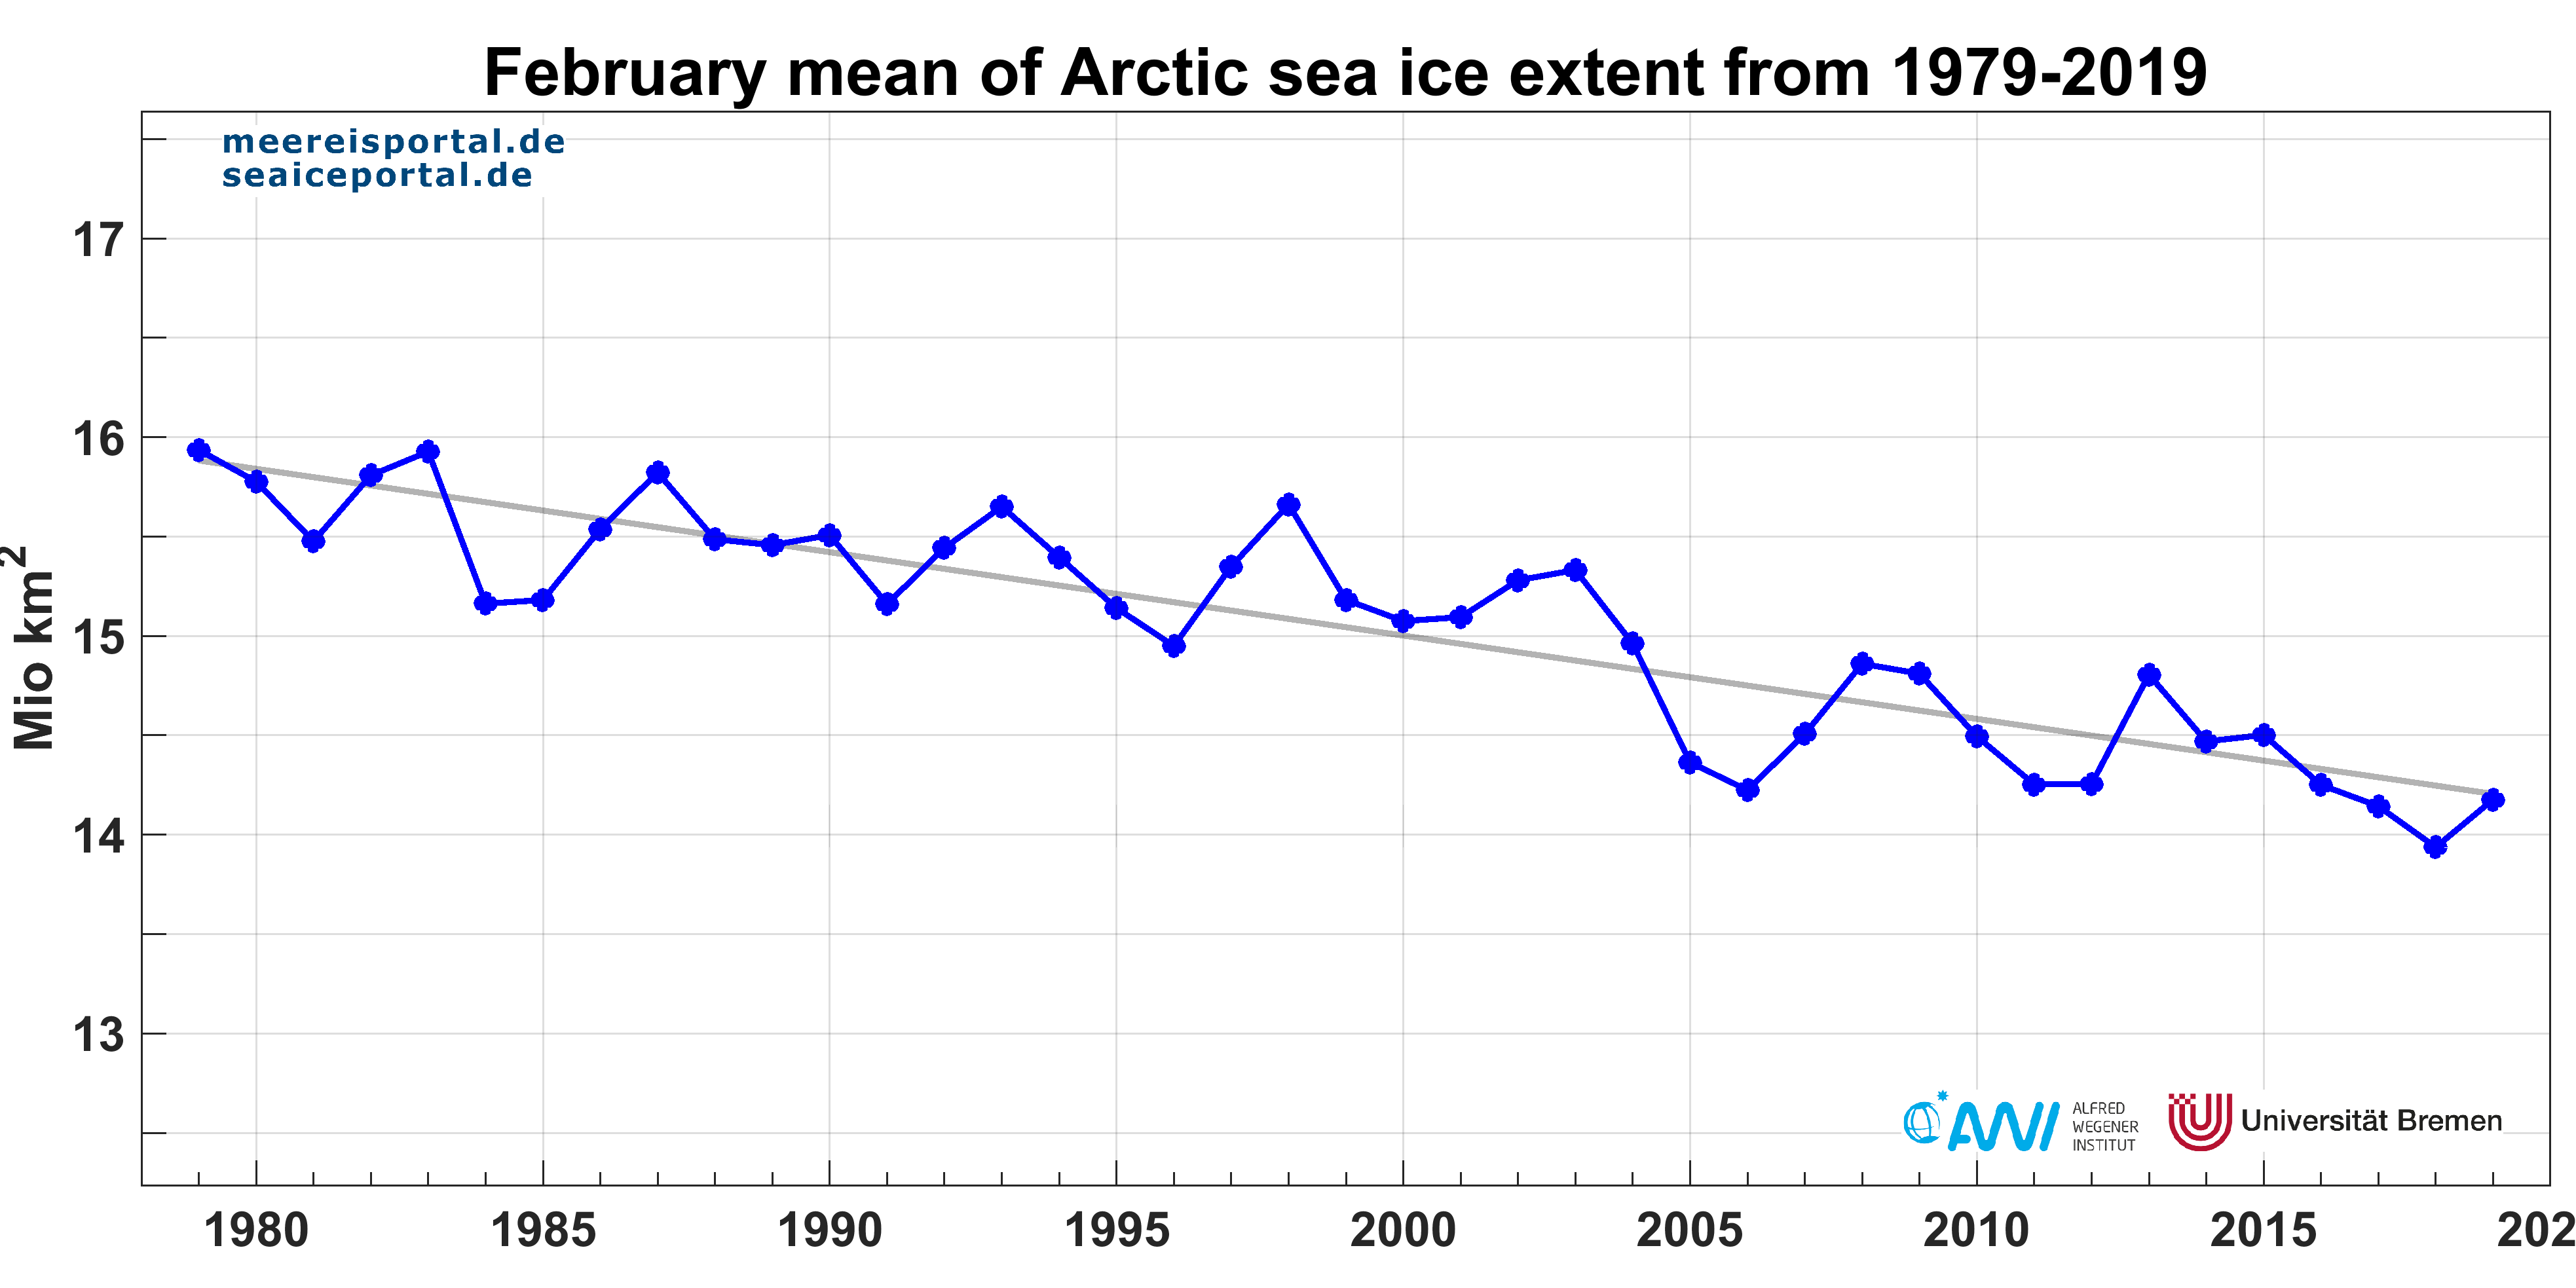
In February, the sea-ice cover in the Arctic remained below the double standard deviation from the long-term average (see Figure 1) and followed a similar progression as in the years 2007 and 2018. In February 2019 the ice covered an average area of 14.18 million square kilometres (see Figure 2); this is ca. 0.24 million square kilometres above the lowest value recorded in 2018 (see Figure 3). “The current sea-ice situation is hardly an unexpected development, after the sea ice ‘recovered’ from its extreme values in the early winter,” explains Dr Marcel Nicolaus from the AWI’s Sea-ice Group.
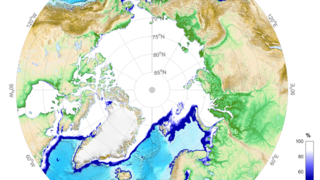
Ice growth primarily took place in the Barents Sea, Sea of Okhotsk, and Labrador Sea. In previous years, reduced ice cover was observed in the northern Barents Sea, which can be attributed to “Atlantification”, an intensified influx of warm water masses from the Atlantic. The sea-ice development in the Bering Sea stands in glaring contrast.
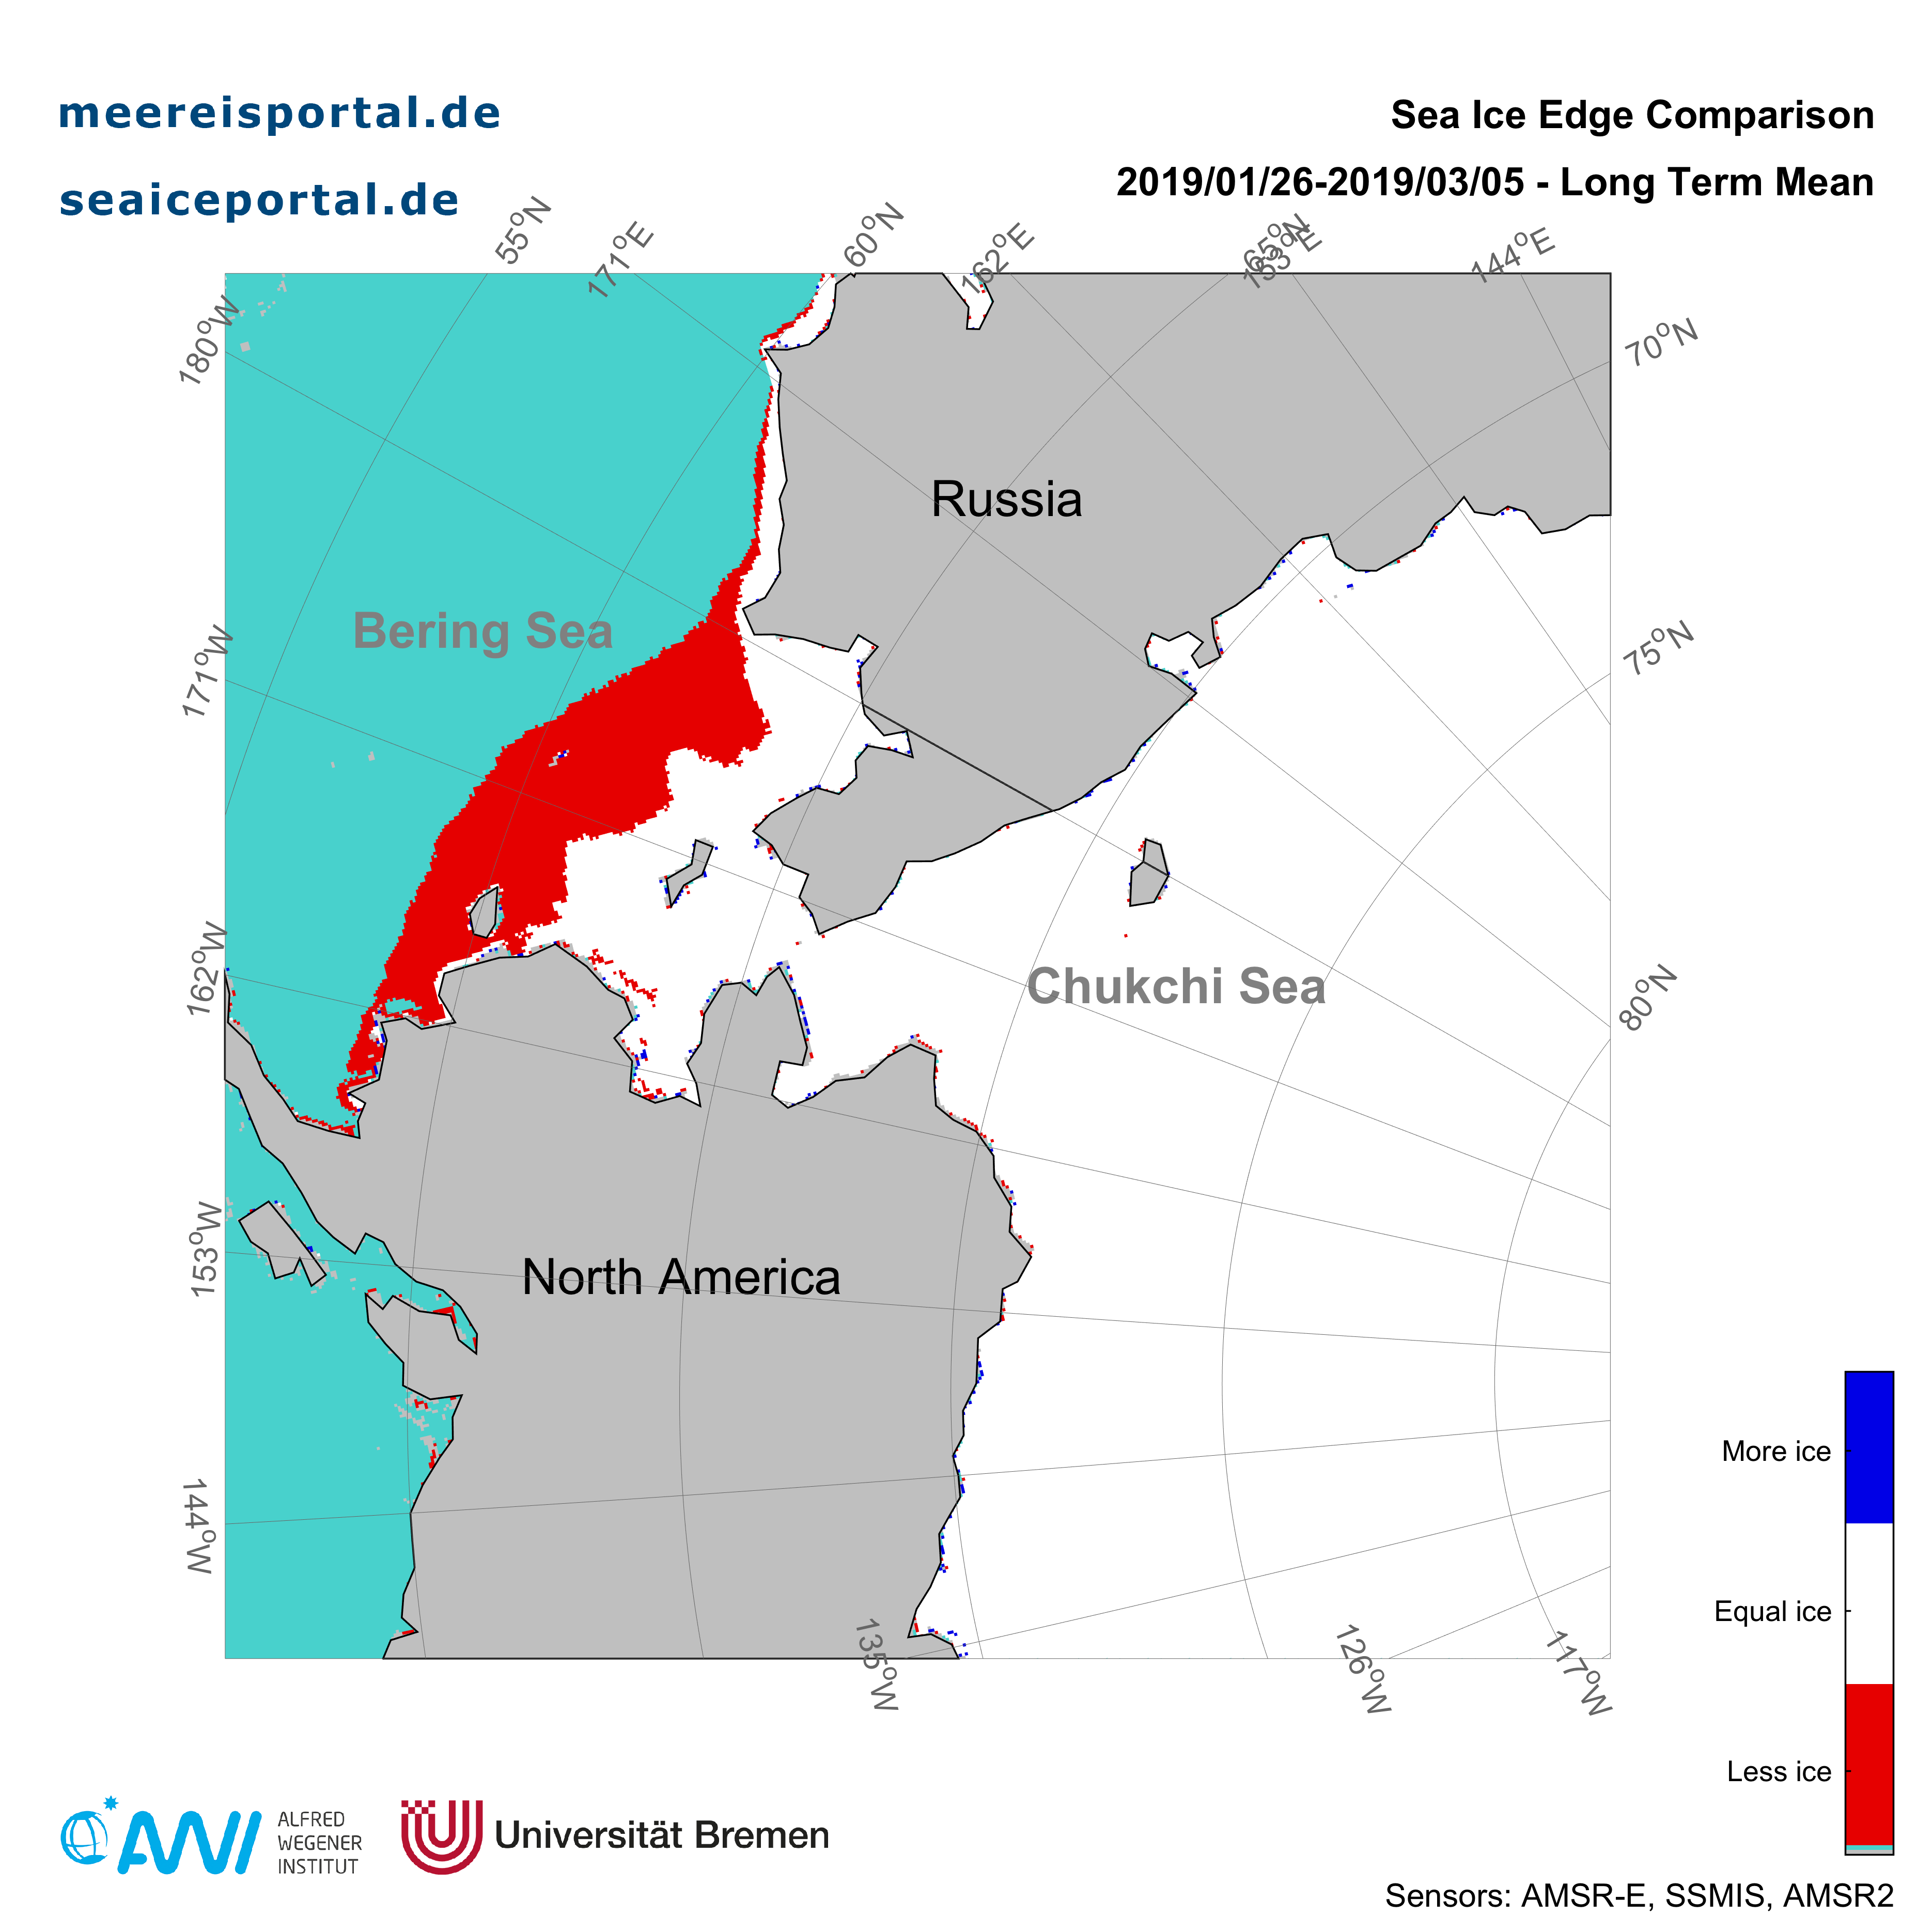
The Bering Sea showed the most dramatic development this month. Normally the amount of sea ice in the Bering Sea continues to grow until late April / early May; the ice is unstable and reacts to the effects of wind and waves. The extent often varies throughout the winter, when the thin marginal ice drifts northward or southward, causing it to melt or grow. This year the changes were dramatic: between 28 January and 5 March, a massive amount of ice cover was lost (see Figures 4 and 5).
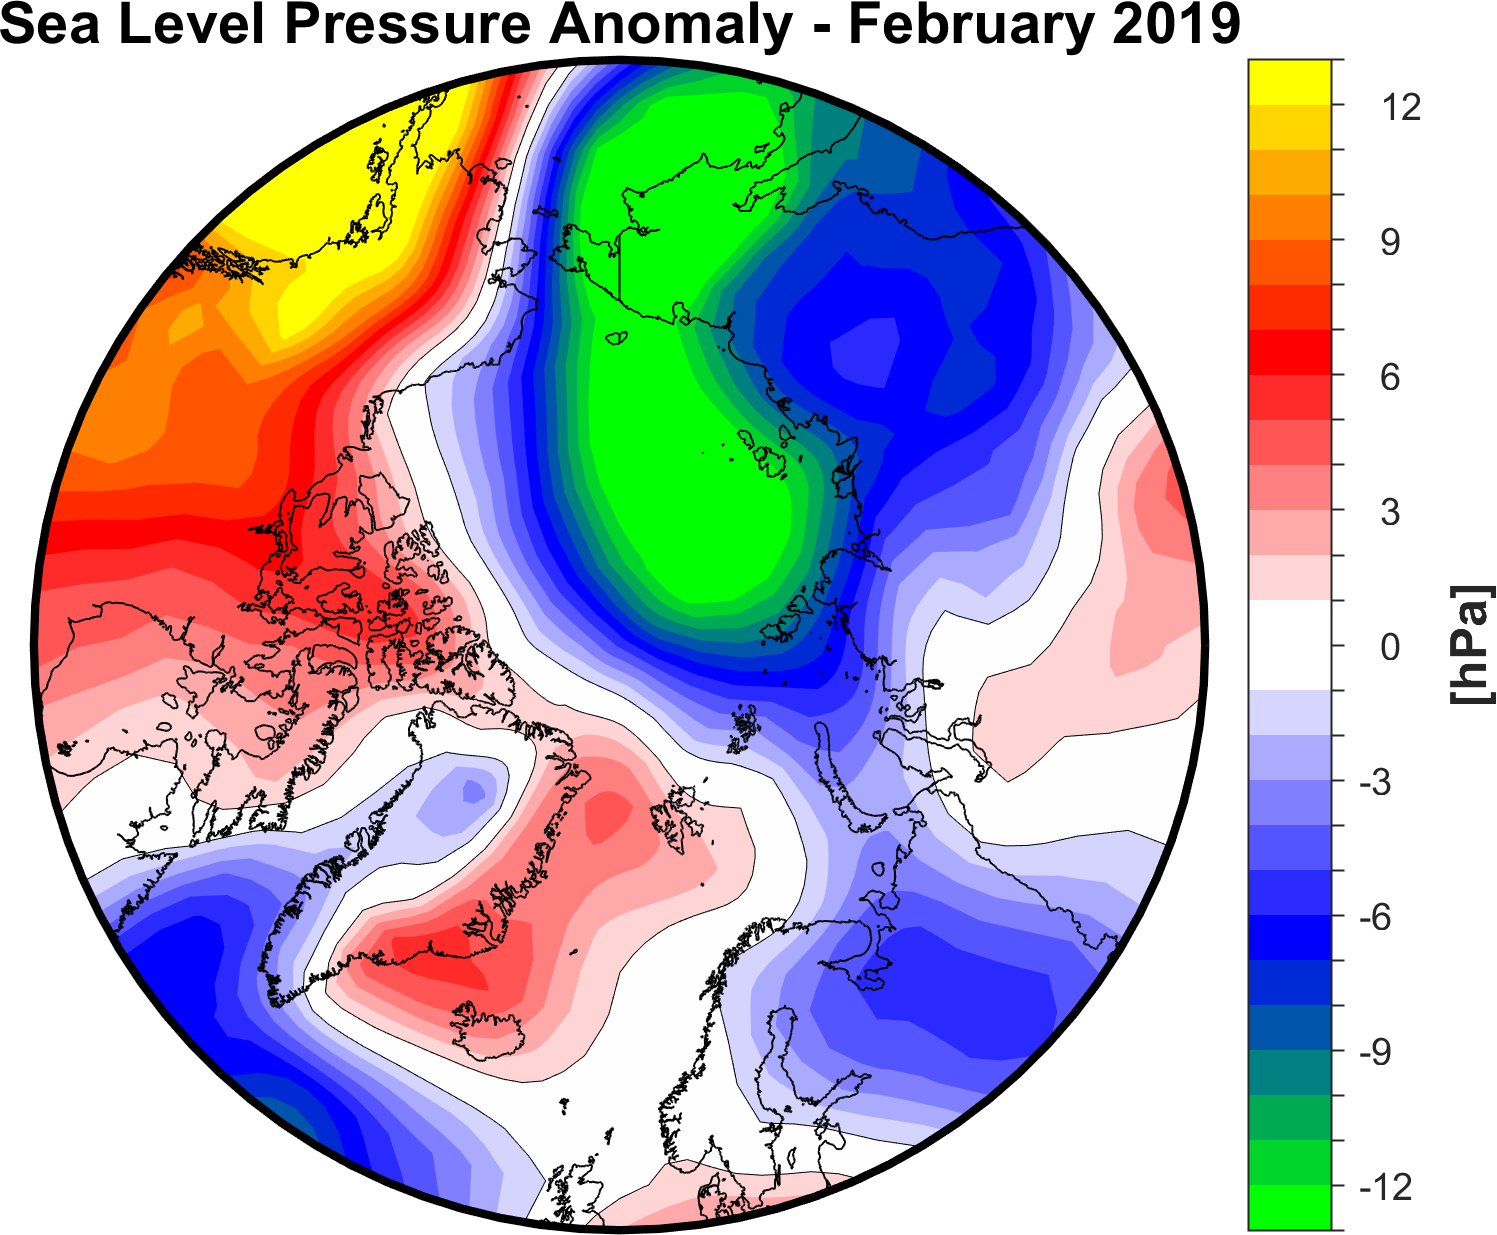
One cause of this major ice loss was a low-pressure cell over the Bering Sea, combined with a high-pressure cell over northwest Canada. The intense winds between the two cells are bringing warm air from the south to the region, preventing ice growth, and simultaneously driving the ice to the north (see Figure 6).
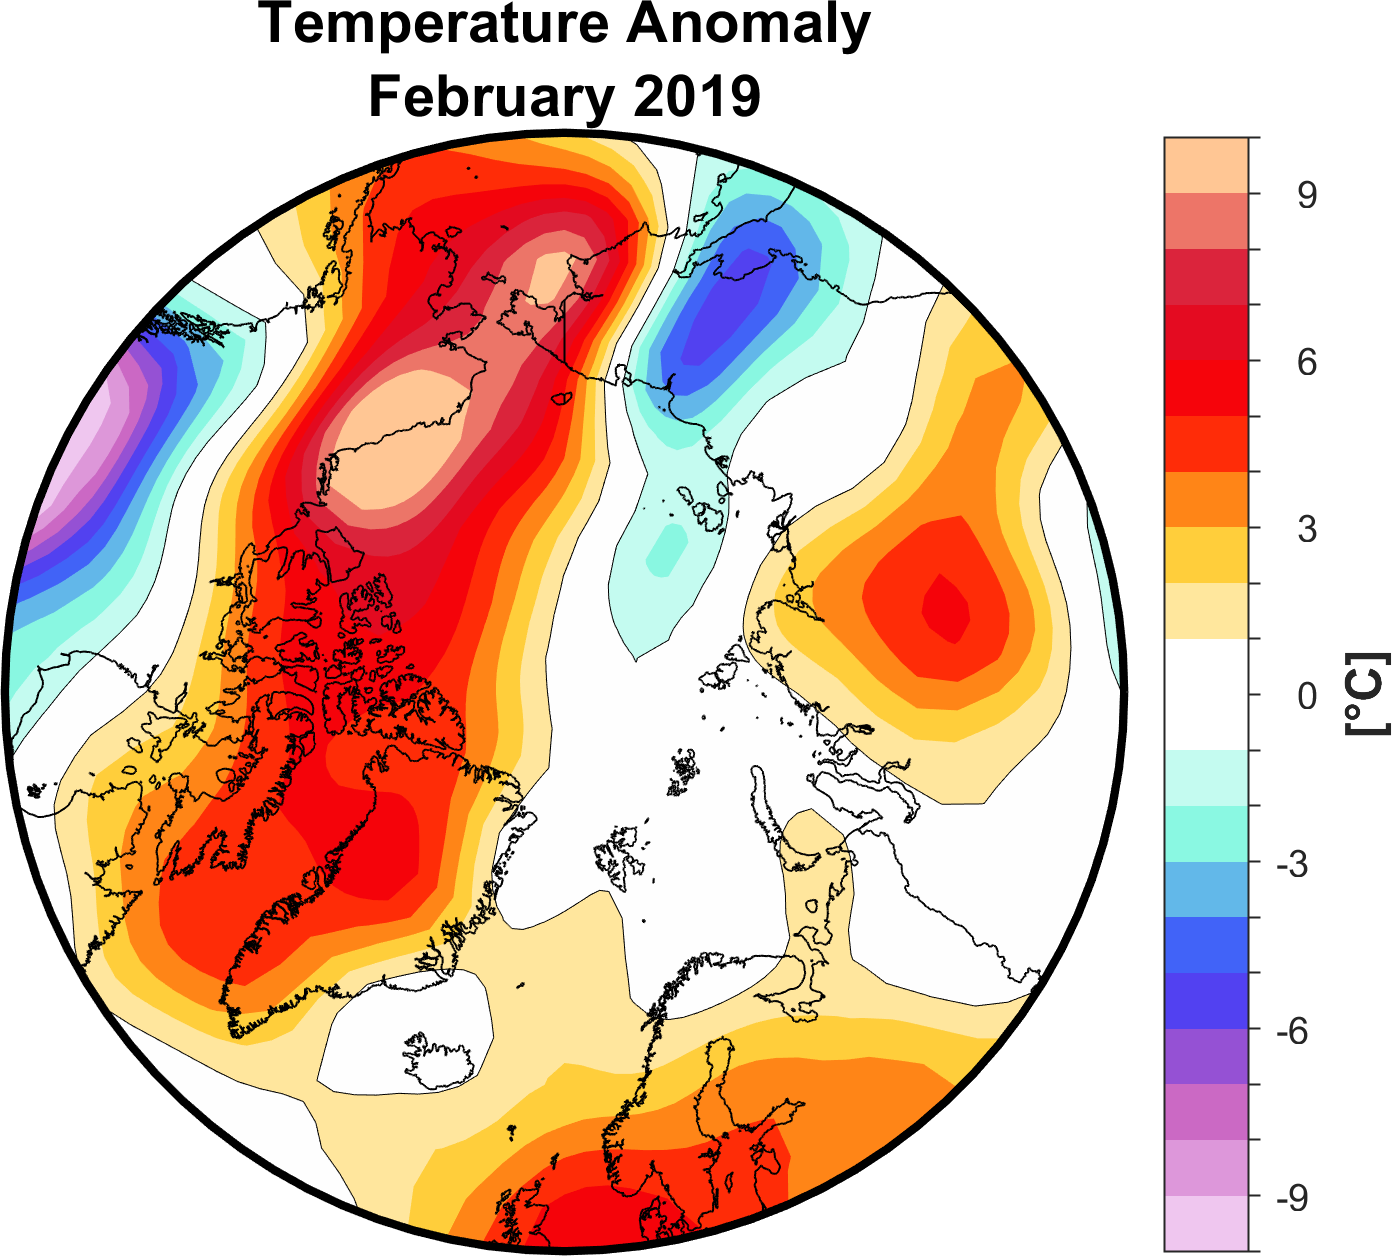
The advection of warm air masses from the North Pacific in the Bering Strait is also linked to the transport of moisture. Figure 8 shows integrated water-vapour transport in the atmosphere for the period 25 February 2019 to 5 March 2019 in six-hour intervals. Clearly recognisable, pulse-like inflows on 25 February, 28 February and 3 March impressively demonstrate the unusual weather conditions. This water vapour transport, a phenomenon that, in this concentrated form, is also referred to as “atmospheric rivers”, is accompanied by an influx of latent heat, which further increases the potential for sea-ice melting and is chiefly responsible for the temperature anomaly of 8-10°C in the region. The temperatures at 925 hPa (circa 750 m above sea level) were between 4 and 10 degrees Celsius higher than the long-term average for 1981-2010 in a region stretching from the Bering Sea, across the Beaufort Sea and into the Canadian Arctic Archipelago (Figure 7). According to Dr Monica Ionita-Scholz, a climatologist at the AWI: “It’s an impressive and very rare situation that we’re currently witnessing in the Bering Sea. Although ‘atmospheric rivers’ do reach the Bering Strait in some cases, it is extremely rare, possibly even unprecedented, to see three consecutive episodes of warm intrusions over this region in less than 10 days.”
In addition, storms broke off large amounts of marginal ice, further reducing the sea-ice extent. The ocean’s surface temperature is also higher than in other parts of the region. The Central Arctic and northern North Atlantic were both characterised by low-pressure cells, and the Arctic Oscillation (AO) remained positive throughout the entire month (Source: NSIDC). The AO index describes sea-level pressure anomalies, which move back and forth between the Arctic and middle latitudes in the Northern Hemisphere.
In the next several days, the Arctic sea-ice extent will reach its winter maximum, marking the transition to the melting season. You’ll find extensive coverage of this development, and of the seasonal minimum in the Antarctic, in next month’s news.
Contacts
Questions?
Contact us via E-Mail or our contact form.
Graphics


