Autonomous Monitoring
Autonomous monitoring systems, or buoys for short, monitor the characteristics and position of ice as it drifts through the polar regions and changes with the seasons. These measurements taken along the ice’s drift route (trajectory) are particularly helpful for recognising changes in one and the same ice packet over time, since the monitoring systems drift along with the ice. Adopting this Lagrangian perspective yields unique insights into the causes of sea-ice changes, in most cases along with high temporal resolution (in many systems, hourly measurements are the standard).
This perspective stands in contrast to Eulerian observation, e.g. in remote sensing, which uses a static system to observe sea ice in motion. Buoys have been used in both the Arctic and Antarctic for decades. As part of field campaigns, they are deployed in, on or below the sea ice, are in some cases even dropped from aeroplanes, and most often transmit their data back to land-based research institutes via satellite.
Individual buoy systems vary greatly in terms of their complexity; they can range from simple positioning buoys to snow and mass-balance buoys, to biophysical platforms that monitor everything from the atmosphere to deep in the ocean and measure various parameters in the air, snow, sea ice and ocean. Depending on the type of buoy used, these platforms can continue drifting and monitoring in the open ocean after the ice melts or sink to the seafloor.
One key parameter is always the respective buoy’s current position. This data is used to determine the ice’s drift and simultaneously where each measurement was taken. At the international level, the use of autonomous platforms is coordinated by the International Arctic Buoy Program (IABP) and the International Program for Antarctic Buoys (IPAB). You can find an extensive collection of buoy data at the data portal section of meereisportal.de. In addition, various institutes, projects and buoy manufacturers share their data on their own websites.
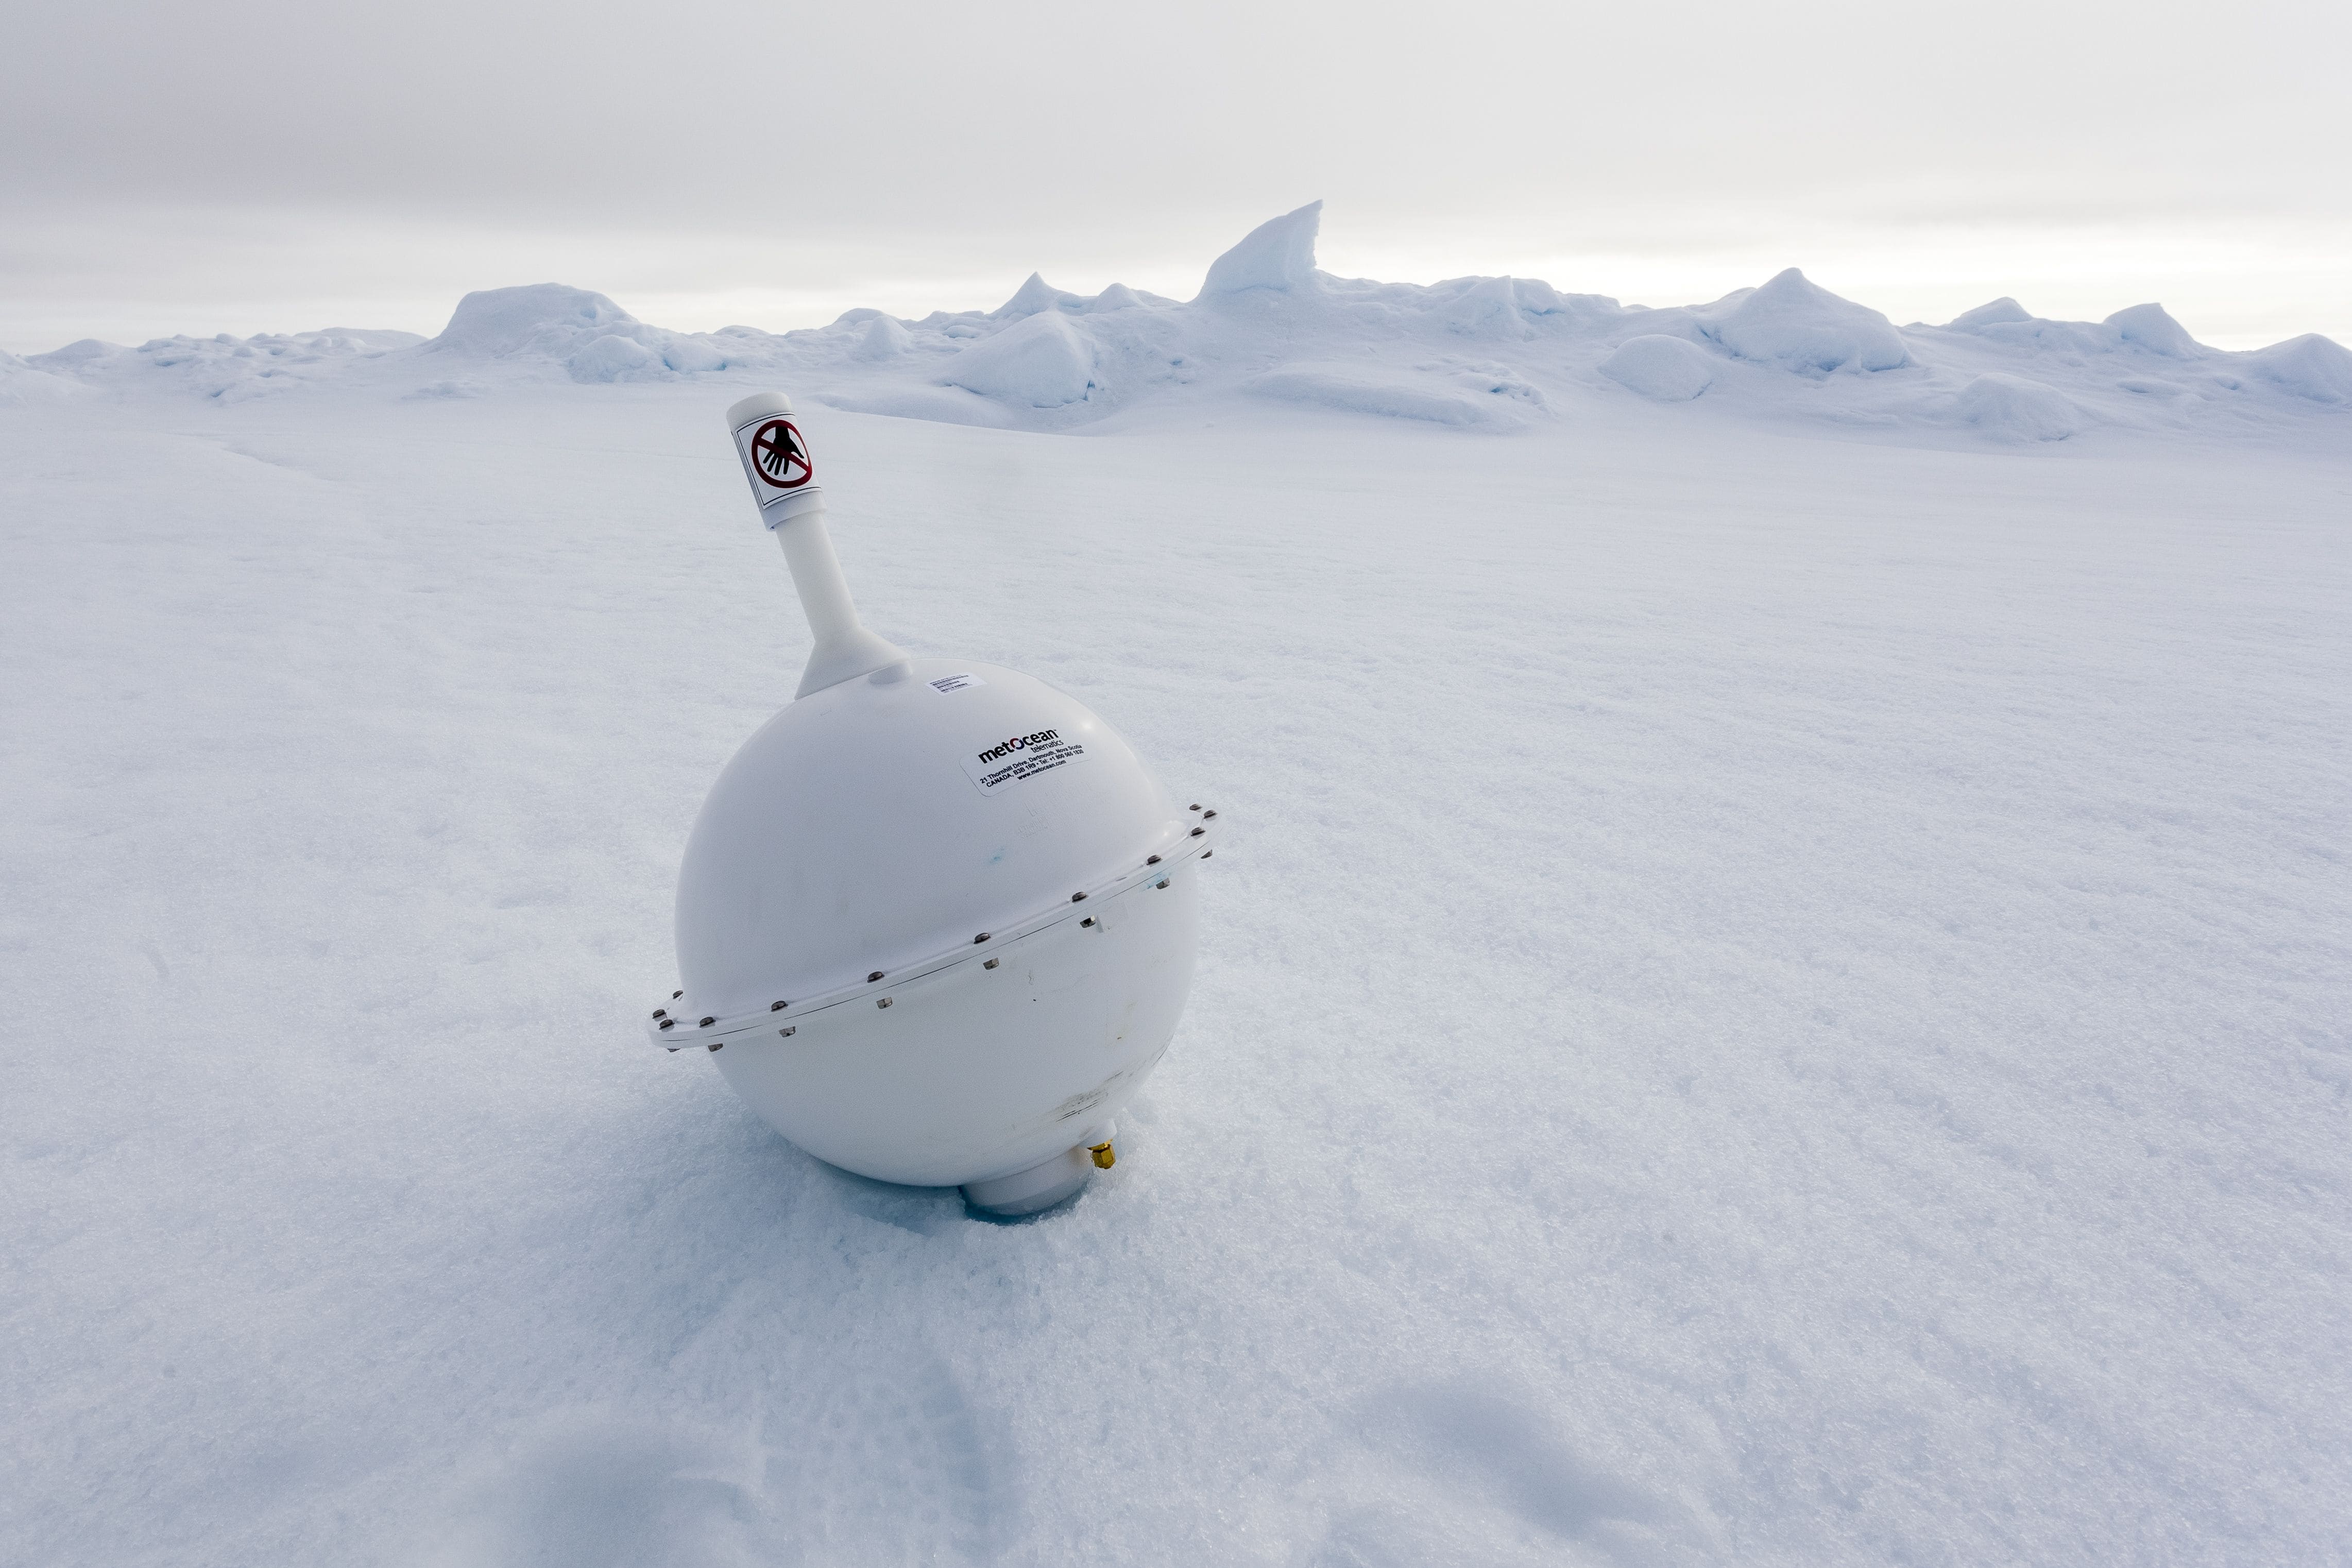
The simplest and longest-lived autonomous systems are positioning buoys. Known by a variety of brand names, these buoys chiefly transmit (only) their own position. This data is used for scientific and logistical applications alike. Buoys’ positioning data can be used to derive ice drift. In addition, the positioning data from a network of buoys can be used to analyse the movement and deformation of an entire ice field, e.g. the opening of leads (increasing distances between floes) or the stacking up of ice and formation of pressure ridges (decreasing distances). Ice transport, which depends on the wind and ocean currents, not only distributes the pack ice; it also affects its extent, concentration, mass balance and energy budget. This data can also be used to combine the sea-ice drift with atmospheric pressure fields, to validate satellite data, or to reconstruct drift routes for sediment studies on the ocean floor.
Many positioning buoys also measure the atmospheric pressure and surface temperature. These two parameters, together with positioning data, are fed into the World Meteorological Organization’s (WMO’s) Global Telecommunication System (GTS). As such, they are essential components of weather forecasts and, of course, of scientific research.
Positioning buoys are often used to mark other instruments or ice floes, as they reliably report on the current position of the drifting ice. For example, during aerial and field campaigns they are deployed to identify individual floes, ensuring they can be found again later.
The ice’s mass balance encompasses both its thickness and extent and is an important indicator for climate change. The mass balance is the difference between the amount of ice growth in winter and the amount of ice melting in summer, both on the surface and underside of an ice floe. If the movements of an individual floe are observed through space and time, the changes in local mass balance reflect all conditions in the surface energy budget and oceanic thermal flows. This makes it possible to differentiate between changes on the top and bottom surfaces of the ice, and to investigate e.g. whether the sea ice is melting from above or below.
The thickness of and temperatures within the sea ice are measured at least once a day (in some cases, every hour). When combined with meteorological and oceanographic observational data, the driving forces behind sea-ice changes can be analysed. This can yield valuable insights into the effects of various forces on the sea-ice mass balance, e.g. the varying contributions of energy flows to and from the atmosphere and ocean.
Over the past few decades, numerous autonomous sea-ice mass balance buoys (IMBs: ice mass-balance buoys) have been moored in the sea-ice cover. The data currently gathered by these buoys can be divided into three categories:
- Sea-ice and snow thickness
- Temperature profiles of the atmosphere over the sea ice
- Sea-ice drift
The sea-ice and snow thickness are measured using an acoustic method (acoustic mass-balance buoys) or a combination of temperature and thermal conductivity (thermistor buoys or thermal mass-balance buoys). The majority of mass-balance buoys also measure temperature profiles from the atmosphere to the ocean so as to identify temperature changes throughout the year and facilitate the calculation of thermal flows.
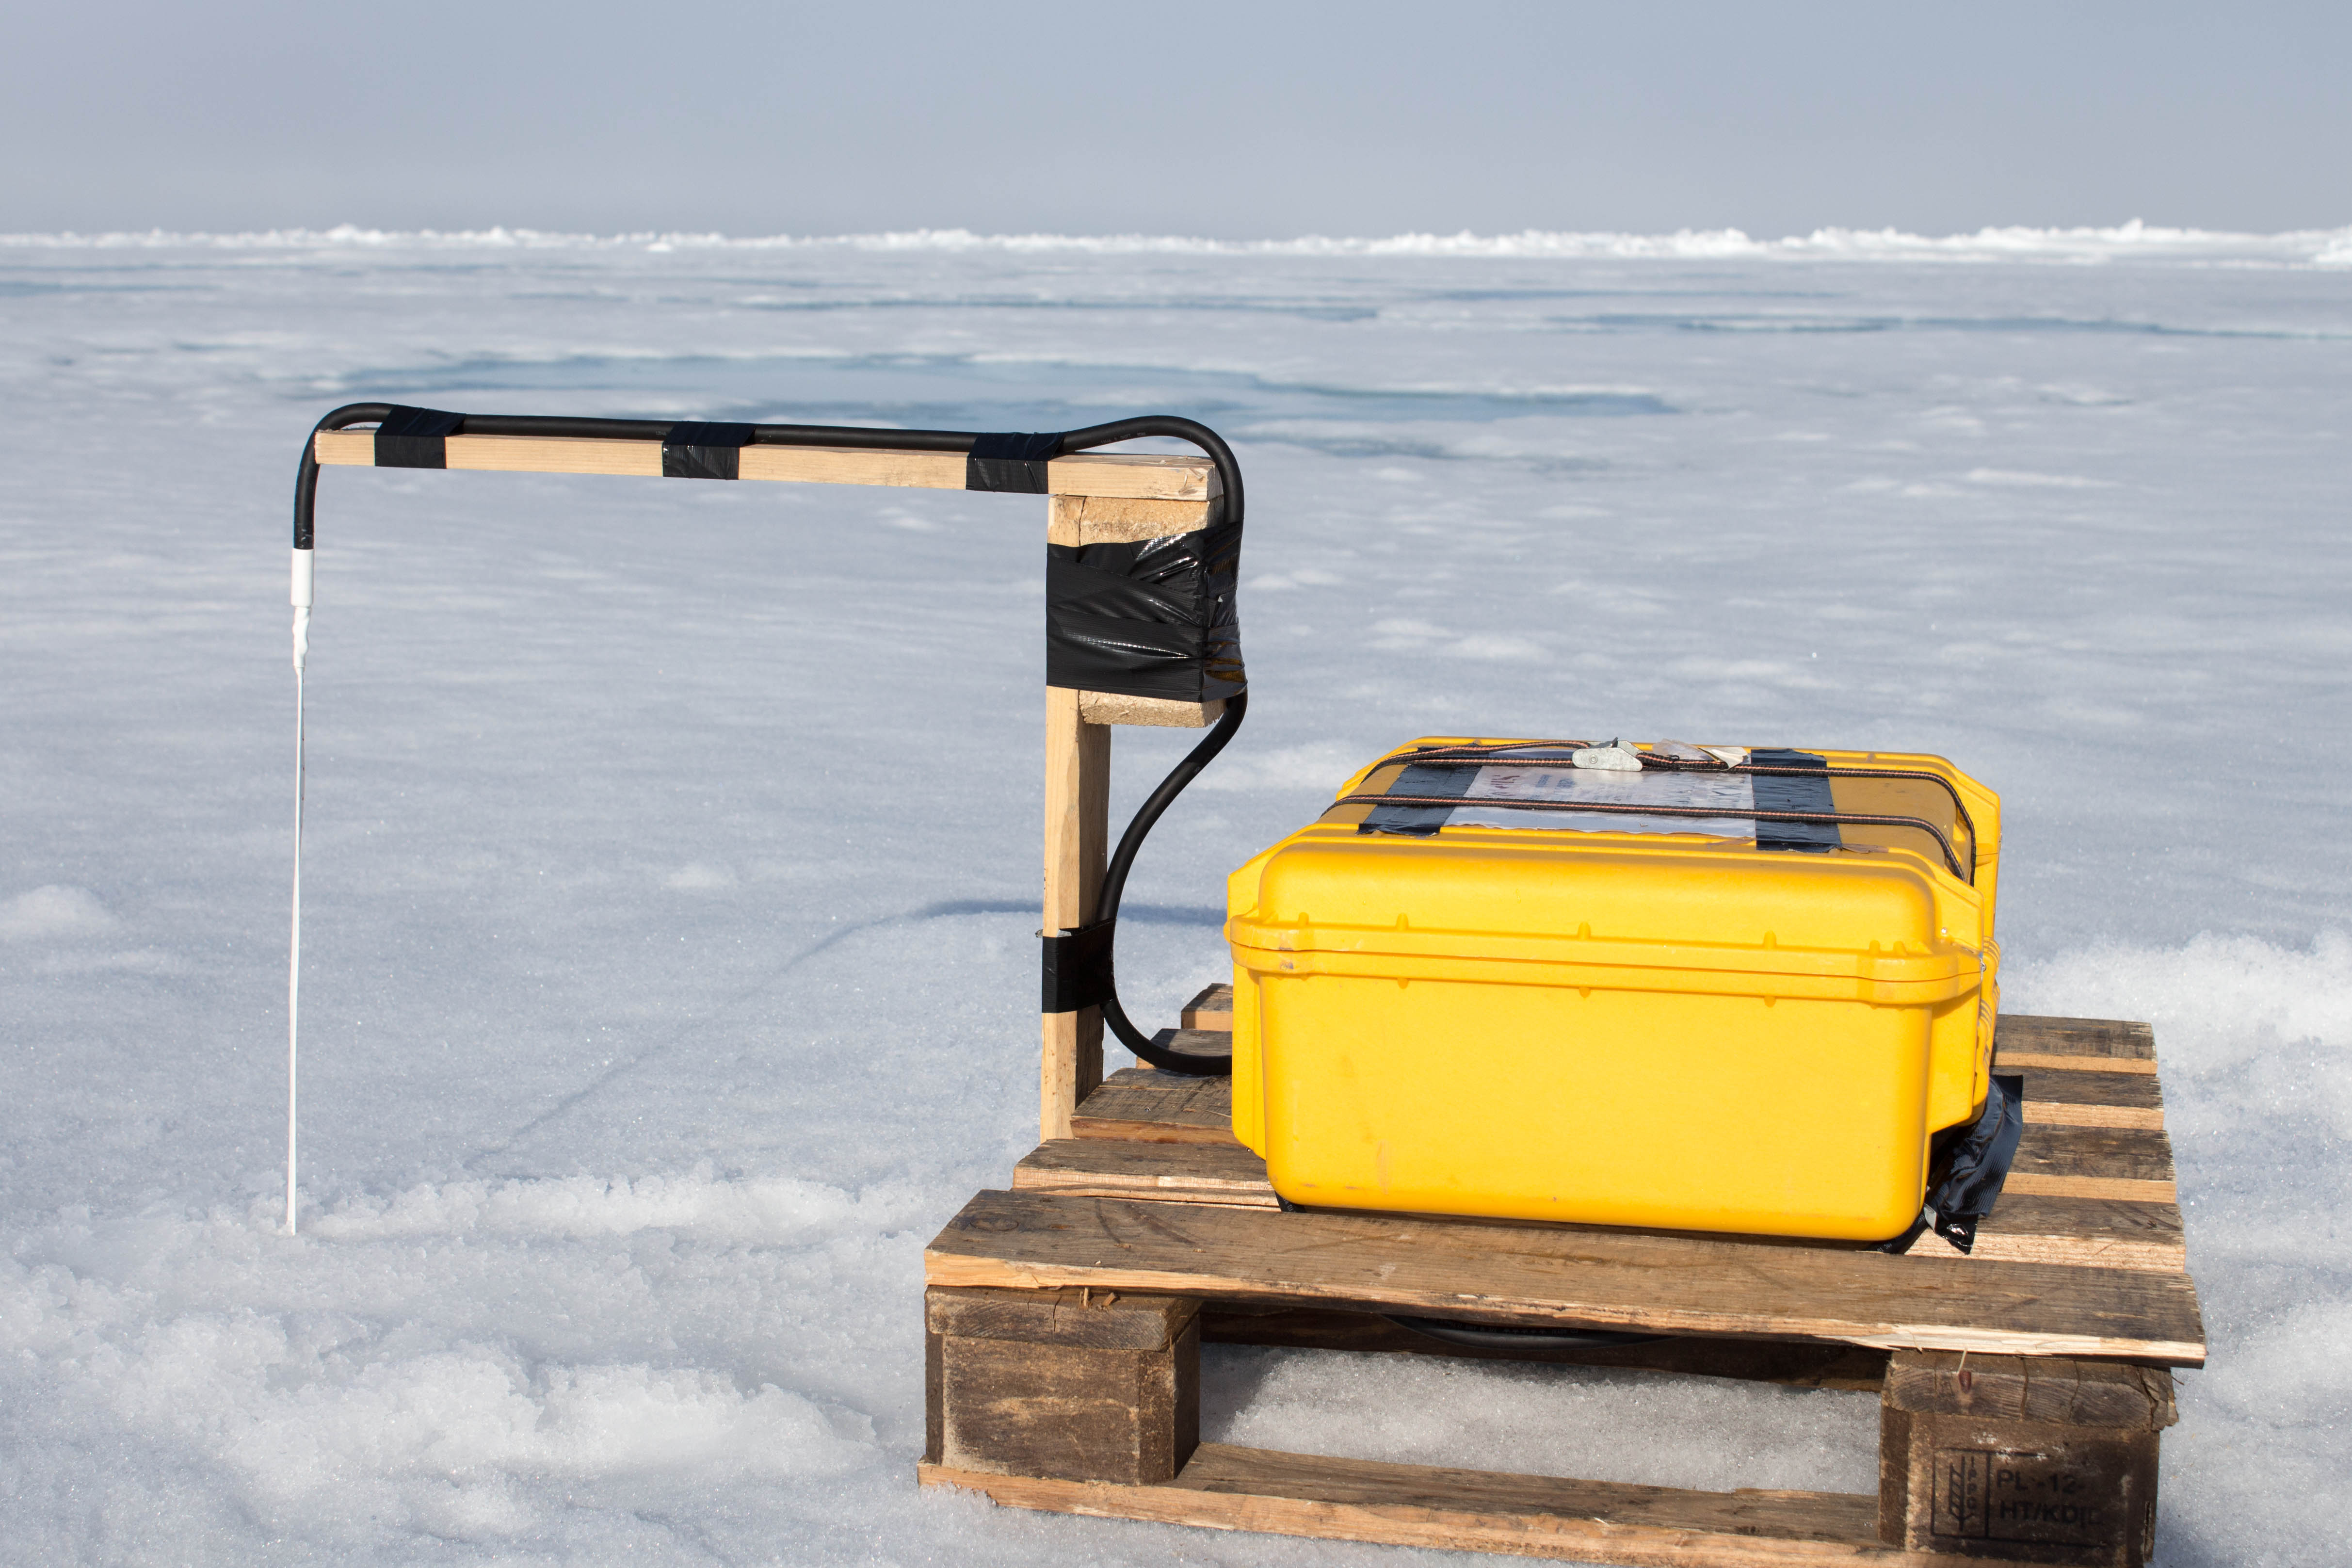
Classic mass-balance buoys use acoustic methods to measure the sensors’ distance to the surface and underside of the ice. Changes in these readings indicate changes in the ice thickness. The buoy consists of a central unit connected to two further units by cables. The central housing is home to the data storage, batteries, modem for satellite communication, and barometer. Depending on the model, the air-temperature sensor may either be here or located at a distance. The central housing is inserted into a hollow cavity within the ice. Placing these components within the ice helps reduce the extreme temperatures they are subjected to. The outboard sensors are located on two external structures that are mounted in channels and surrounded on all sides by the ice. One structure contains acoustic sensor units, located above and below the ice; the other is equipped with thermistor chains, which extend through the snow and ice cover and into the upper ocean and measure the temperature at regular intervals.
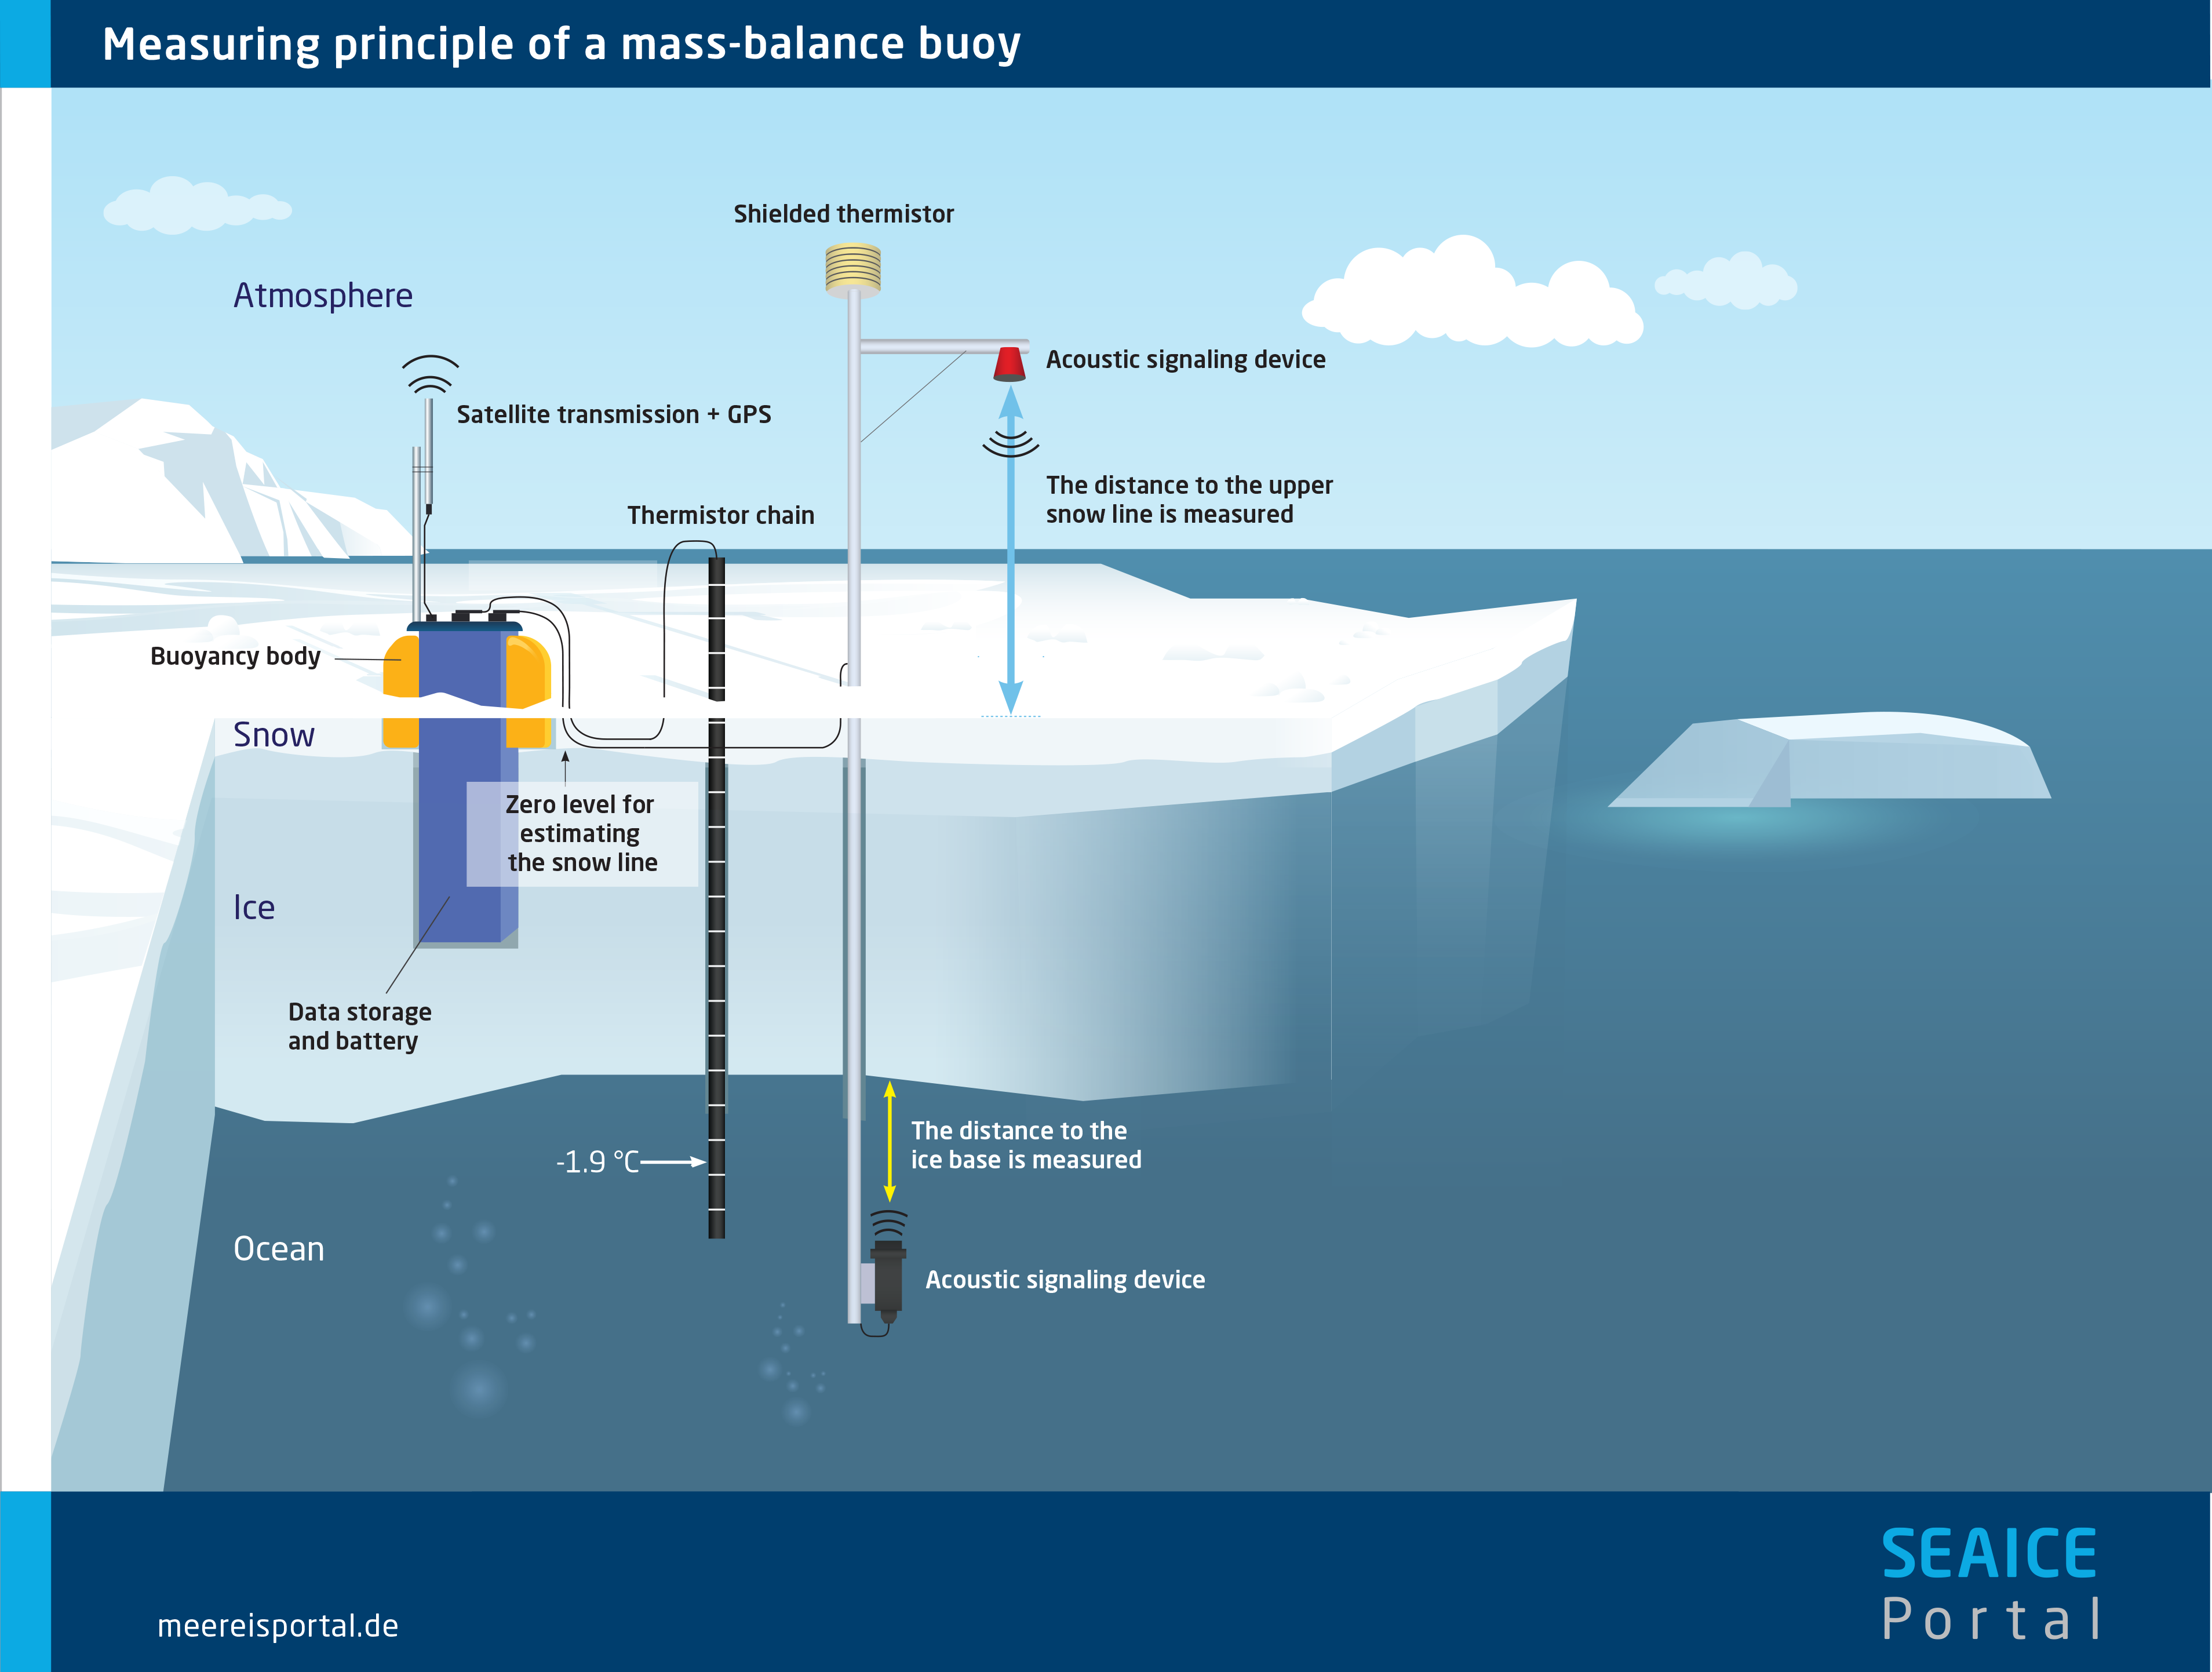
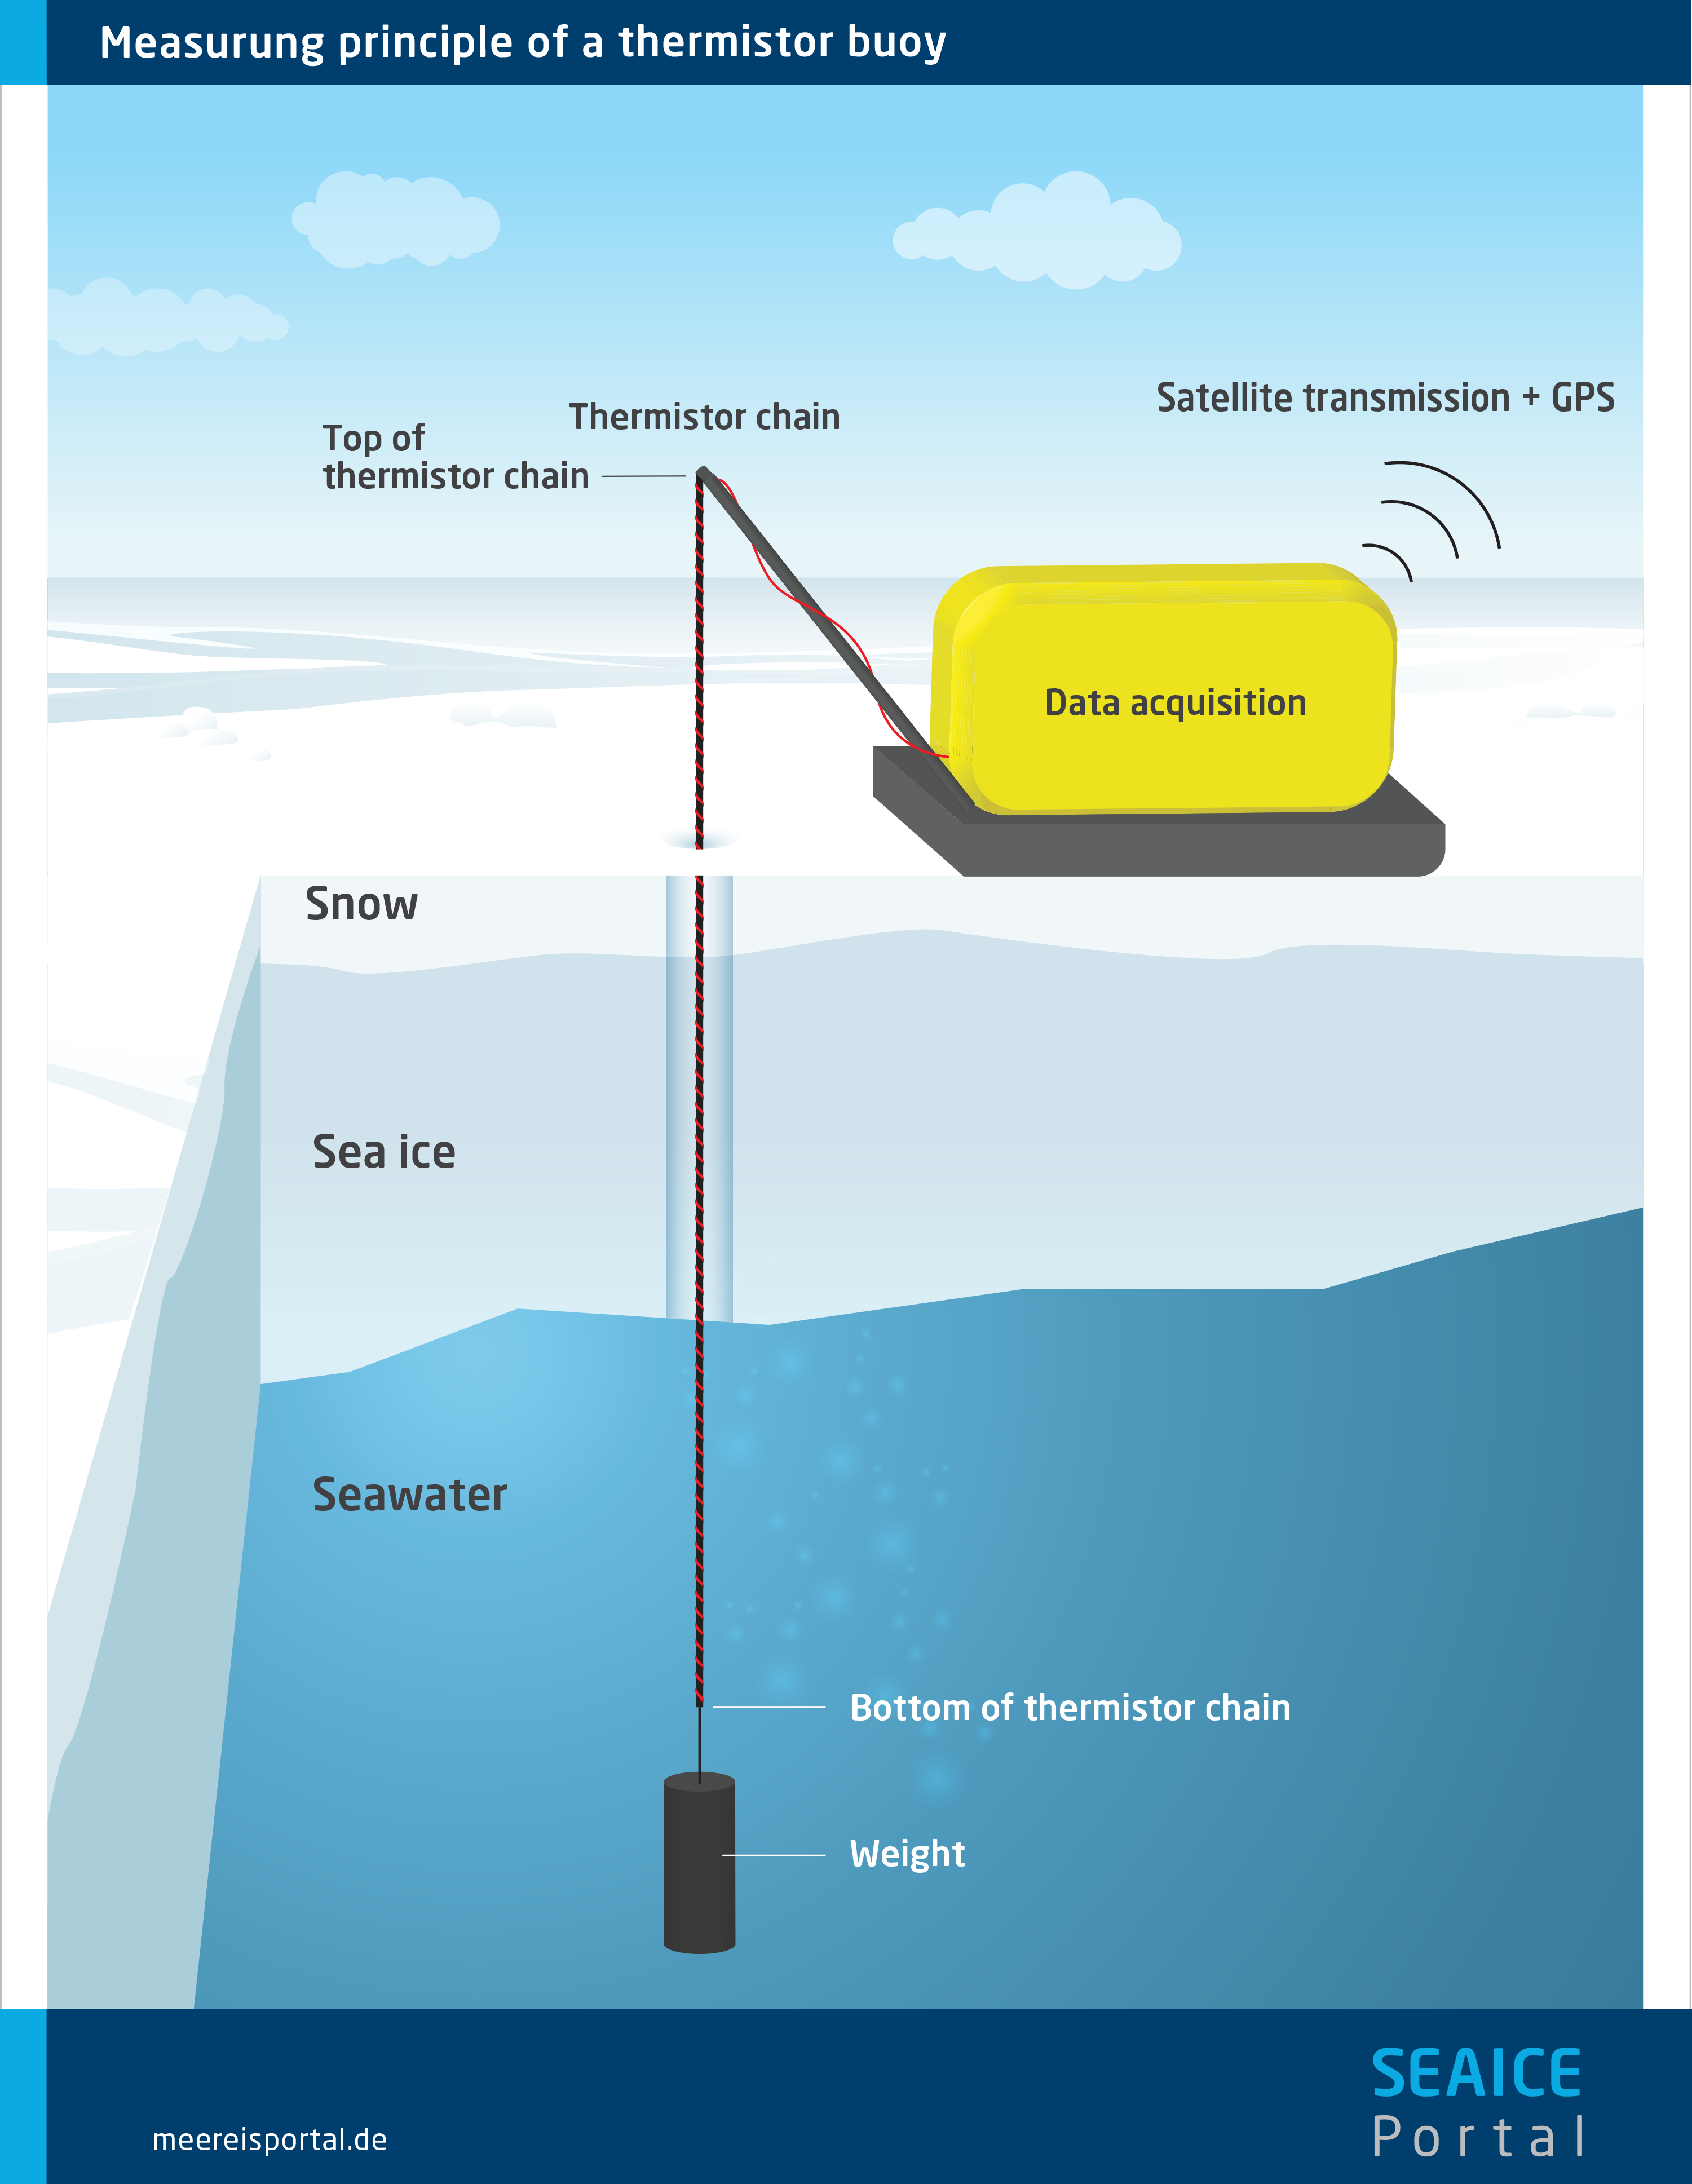
Thermistor chains measure the temperature distribution from the atmosphere, through the snow cover and sea ice, to the ocean. In addition, after each reading the chain is briefly warmed and takes a second reading to determine the thermal conductivity of the material surrounding it. Combining the two readings makes it possible to deduce the mass balance and temperature distribution in the atmosphere, snow and ice cover, and ocean alike.
Each buoy chiefly consists of a several-metre-long tube with small thermistors embedded in it: the standard layout is a 5-metre-long chain with 240 thermistors at 2-centimetre intervals. When the buoy is deployed, the thermistor chain is suspended from a hole in the ice (usually with a diameter of 5 centimetres) and eventually freezes in place. The thermistor chain is connected to a control unit, which is housed in a plastic case, coordinates the sensors and gathers the data. In addition, a GPS receiver determines the buoy’s position. An integrated satellite modem (usually Iridium) transmits the data to a central processing facility. In most cases, this data connection can also be used to reprogram the buoy as needed, e.g. to adjust the measuring intervals.
Generally speaking, the thickness readings provided by thermistor buoys are characterised by more uncertainty than those from classic mass-balance buoys. However, the former type’s ability to differentiate between media (especially snow versus sea ice), and the additional information it can provide on thermal qualities, are clear advantages.
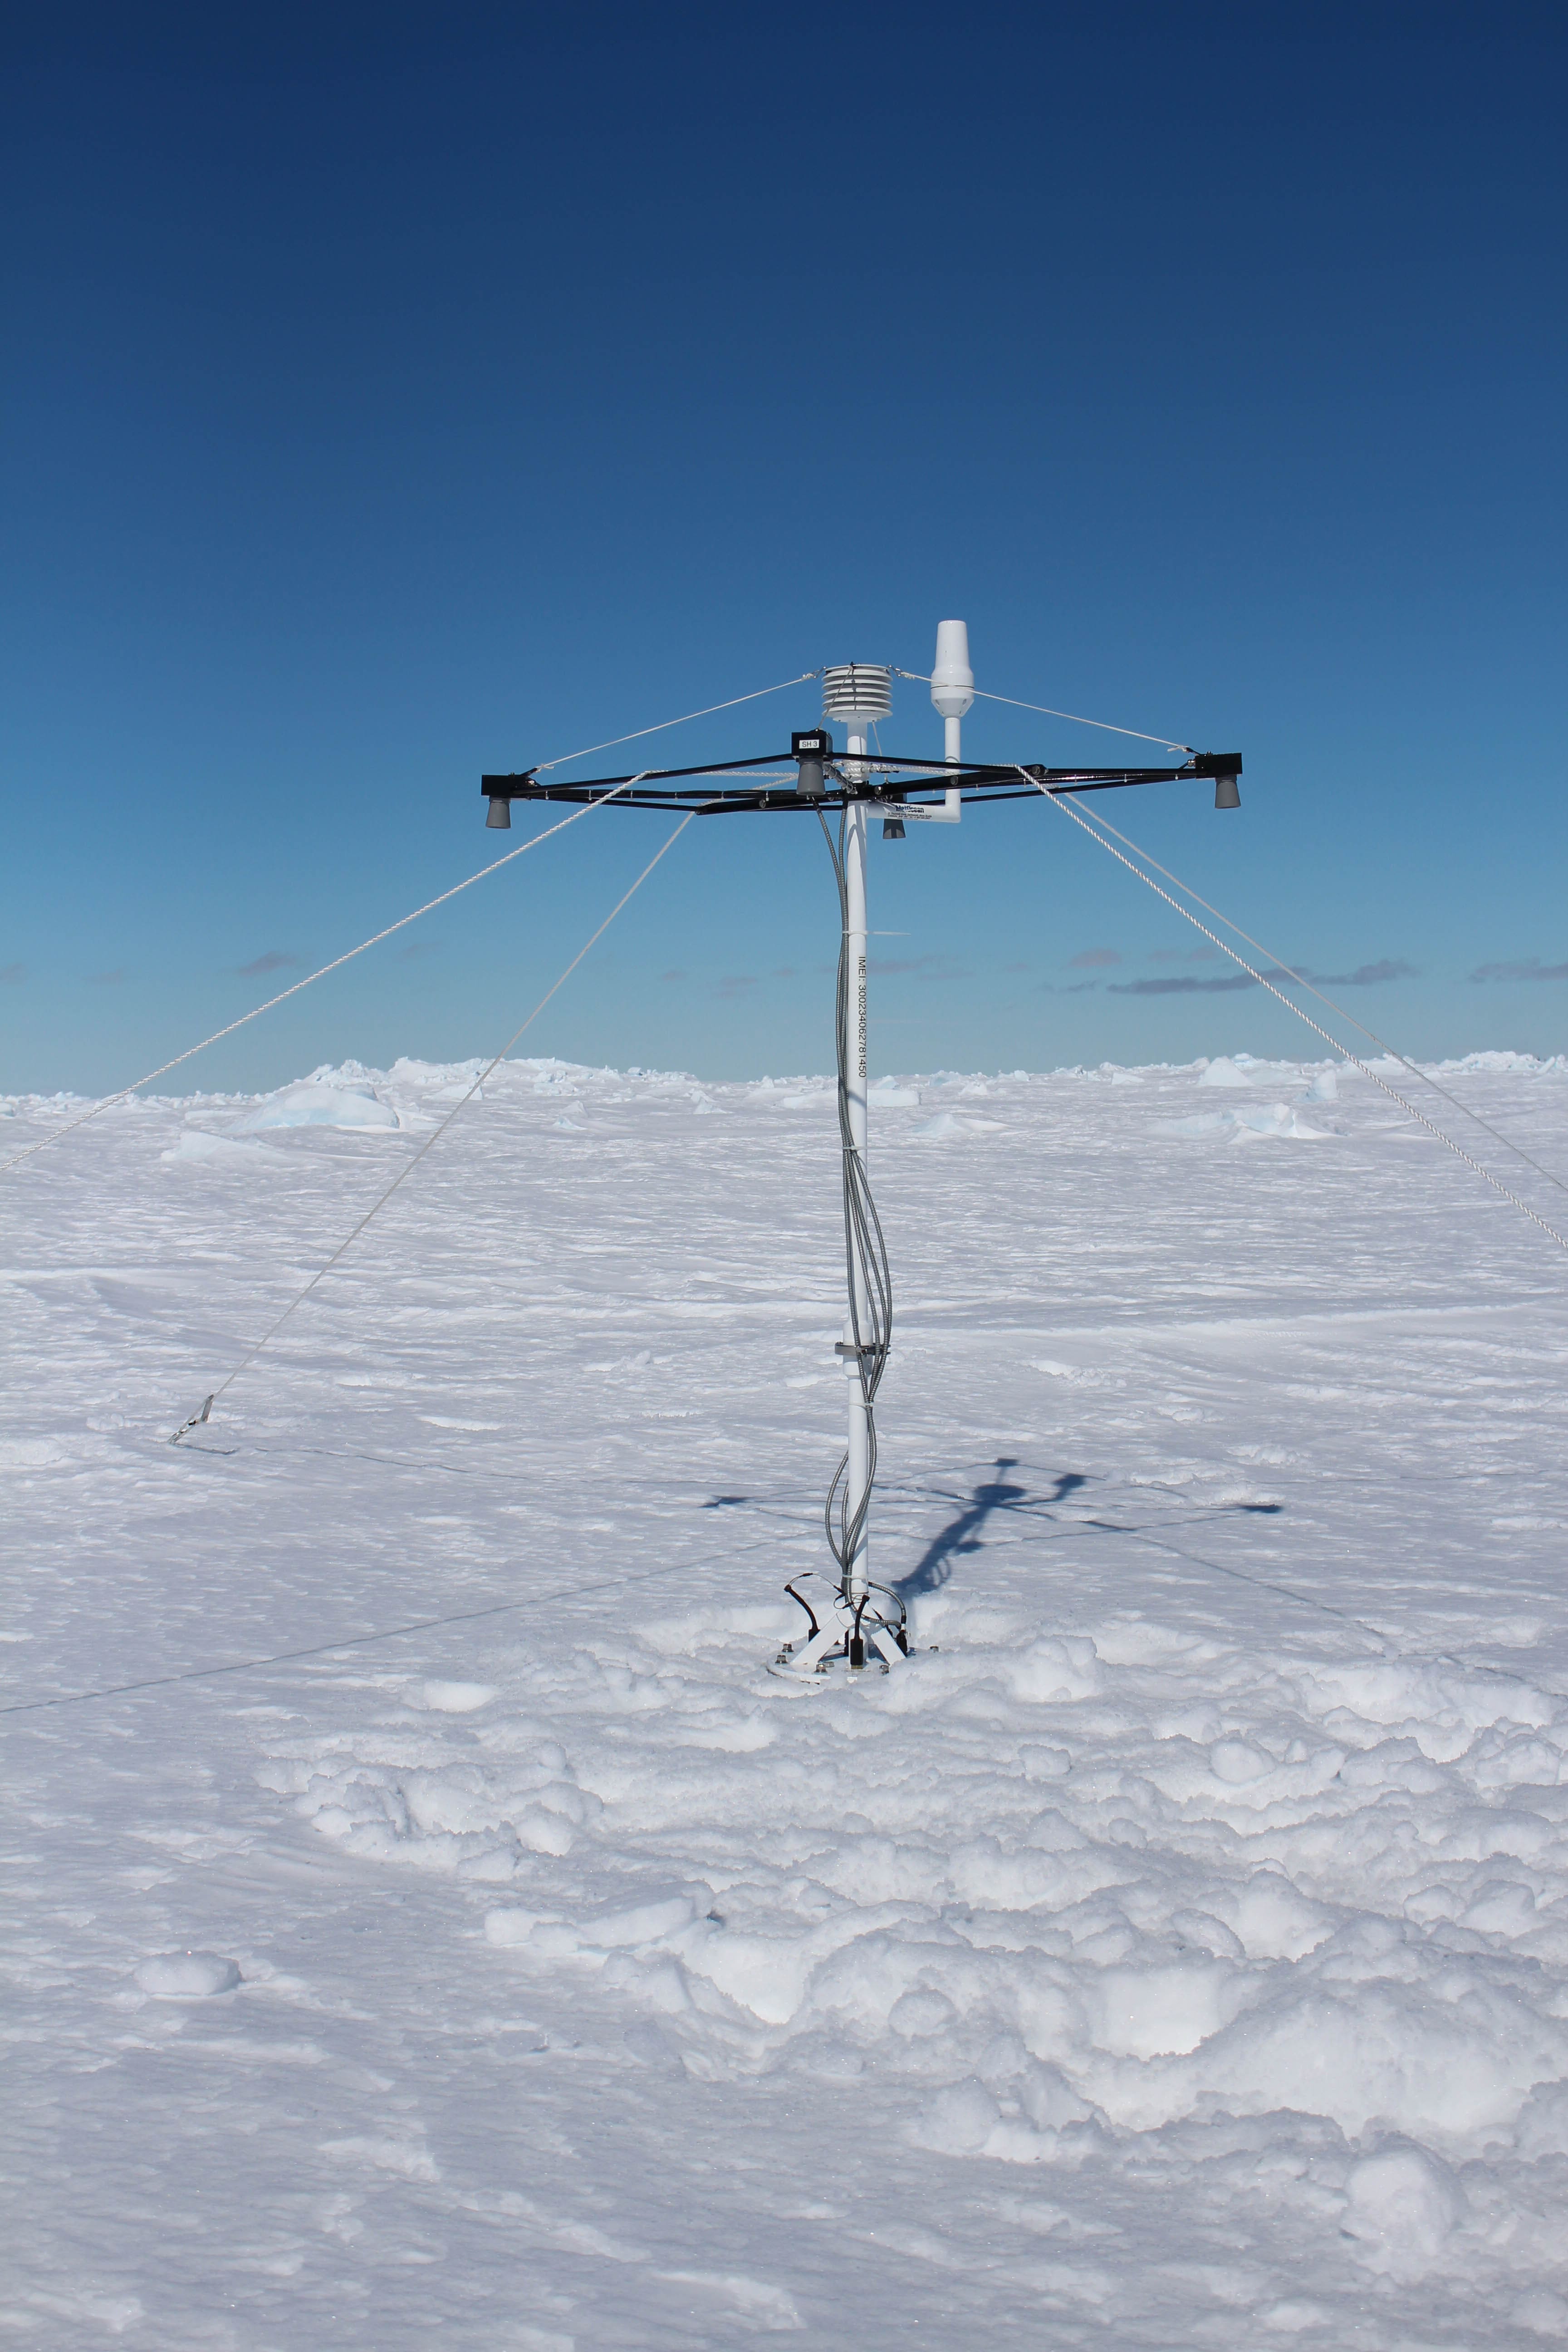
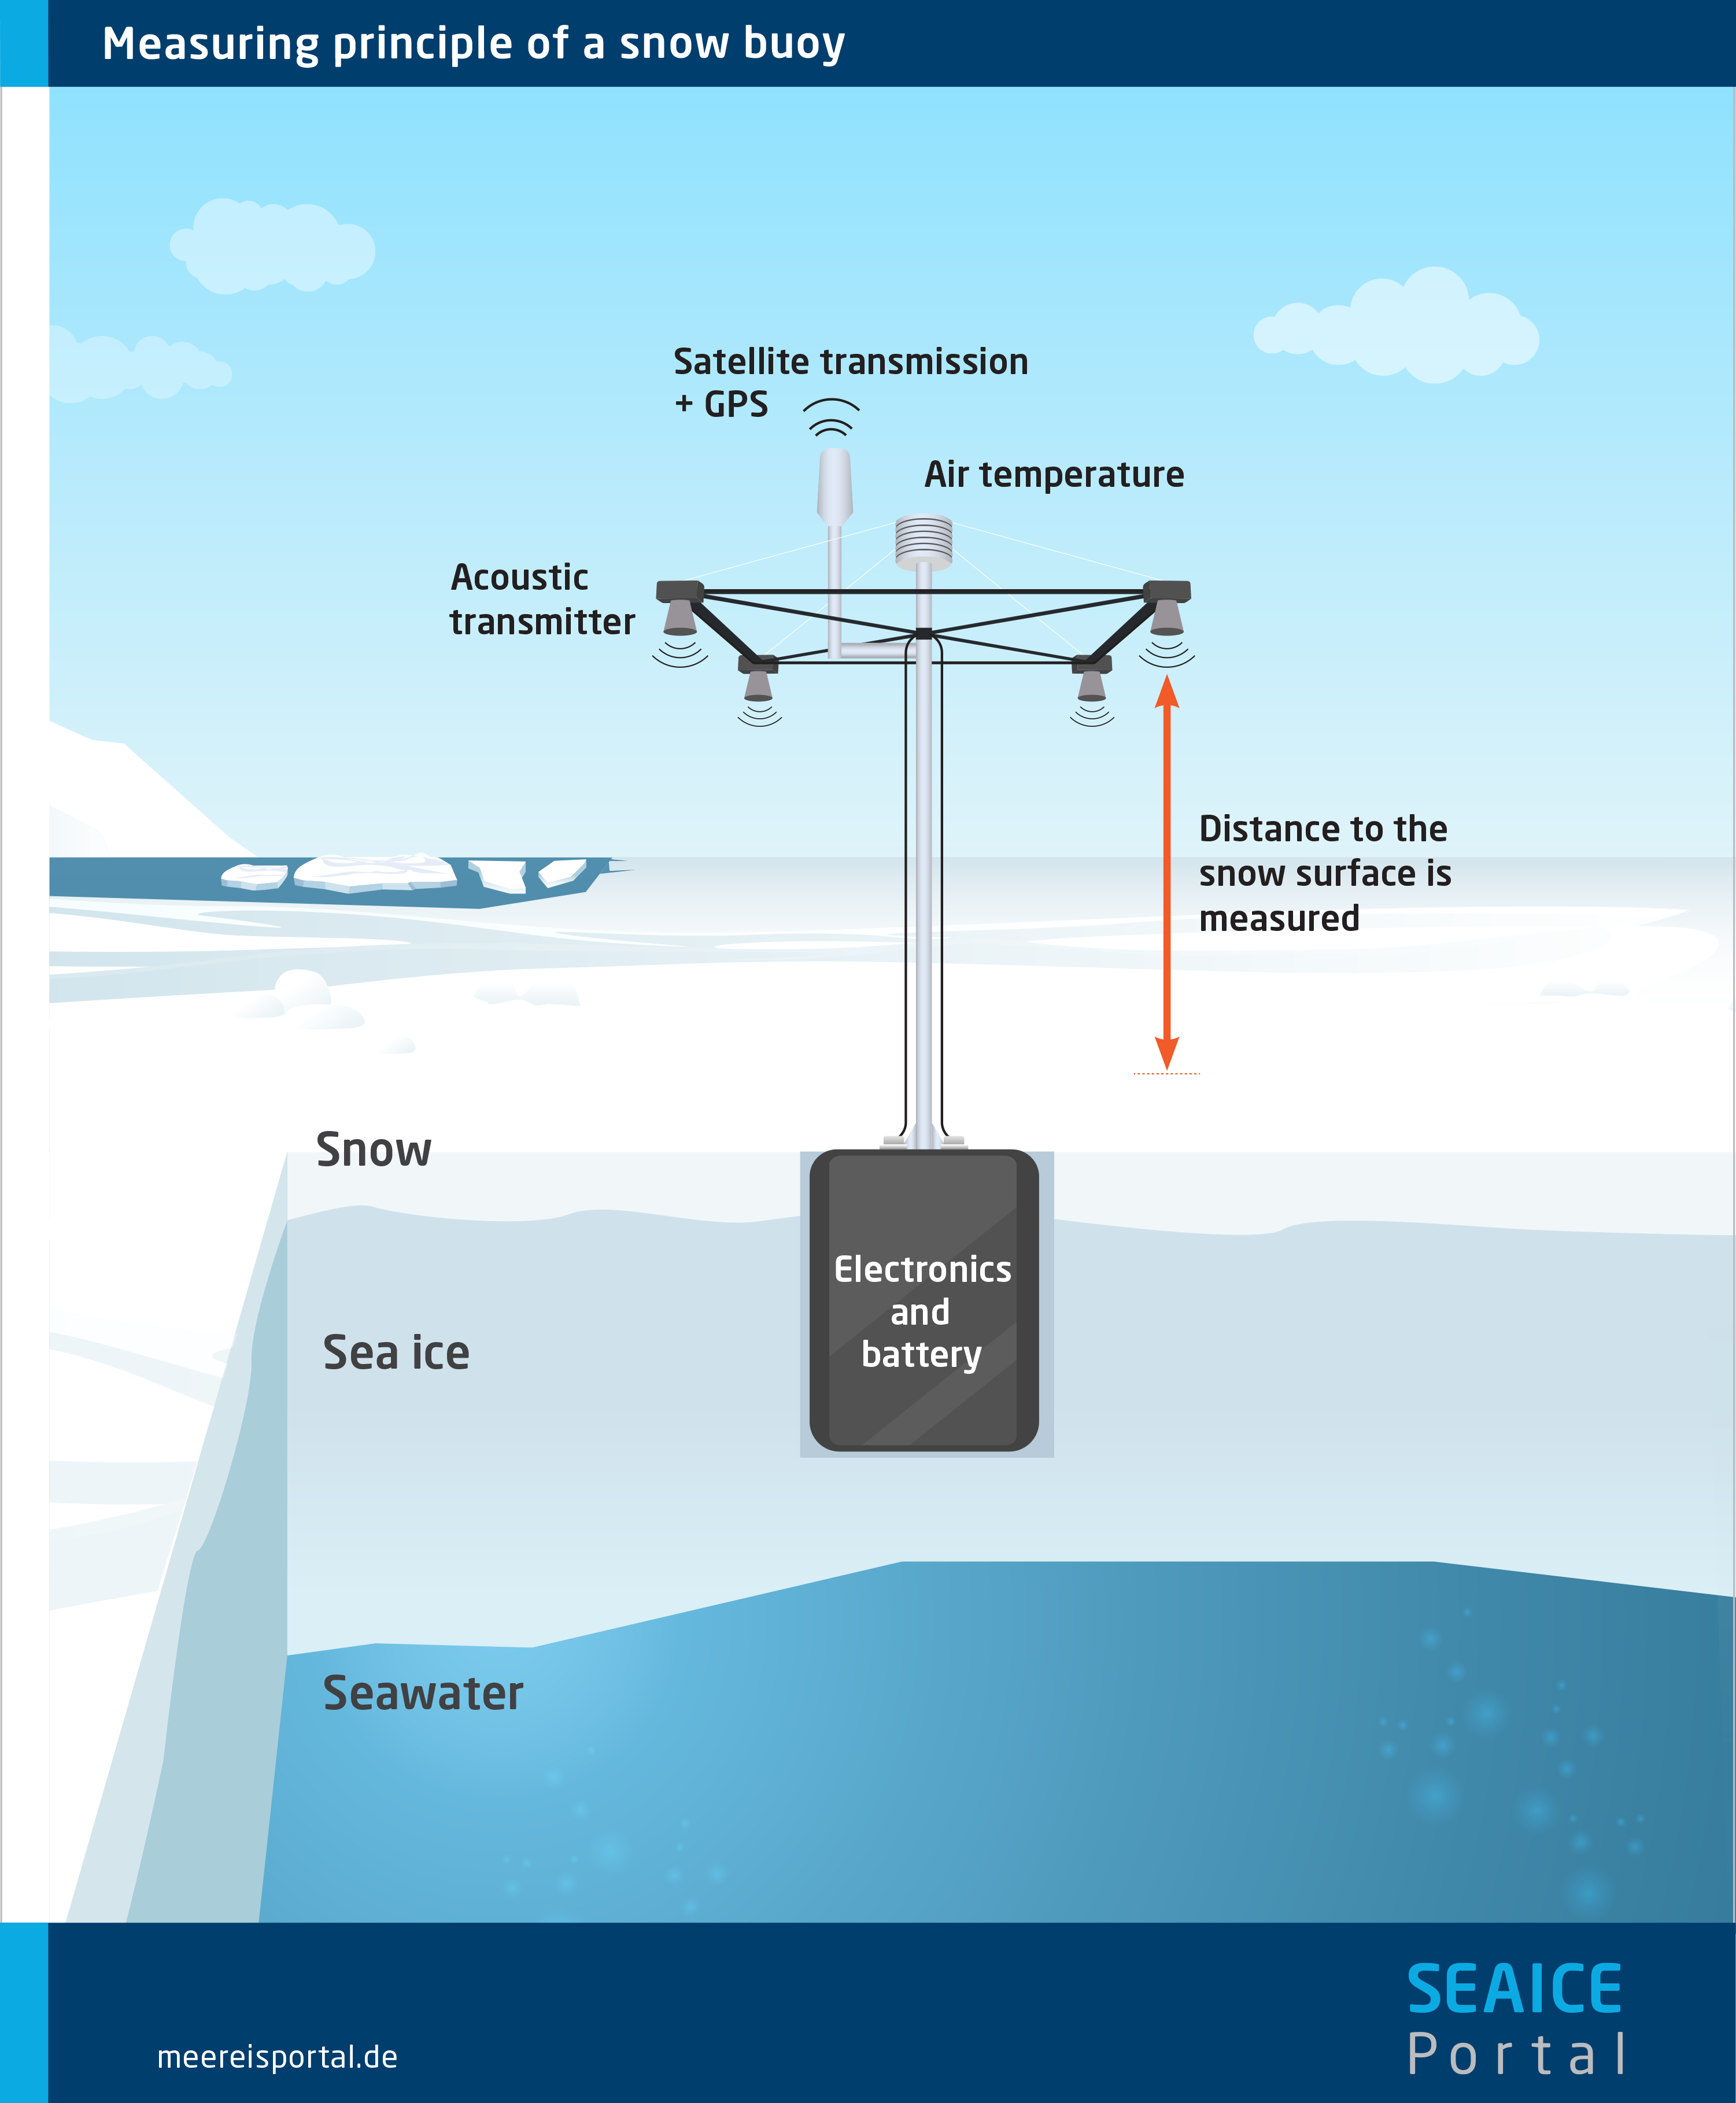
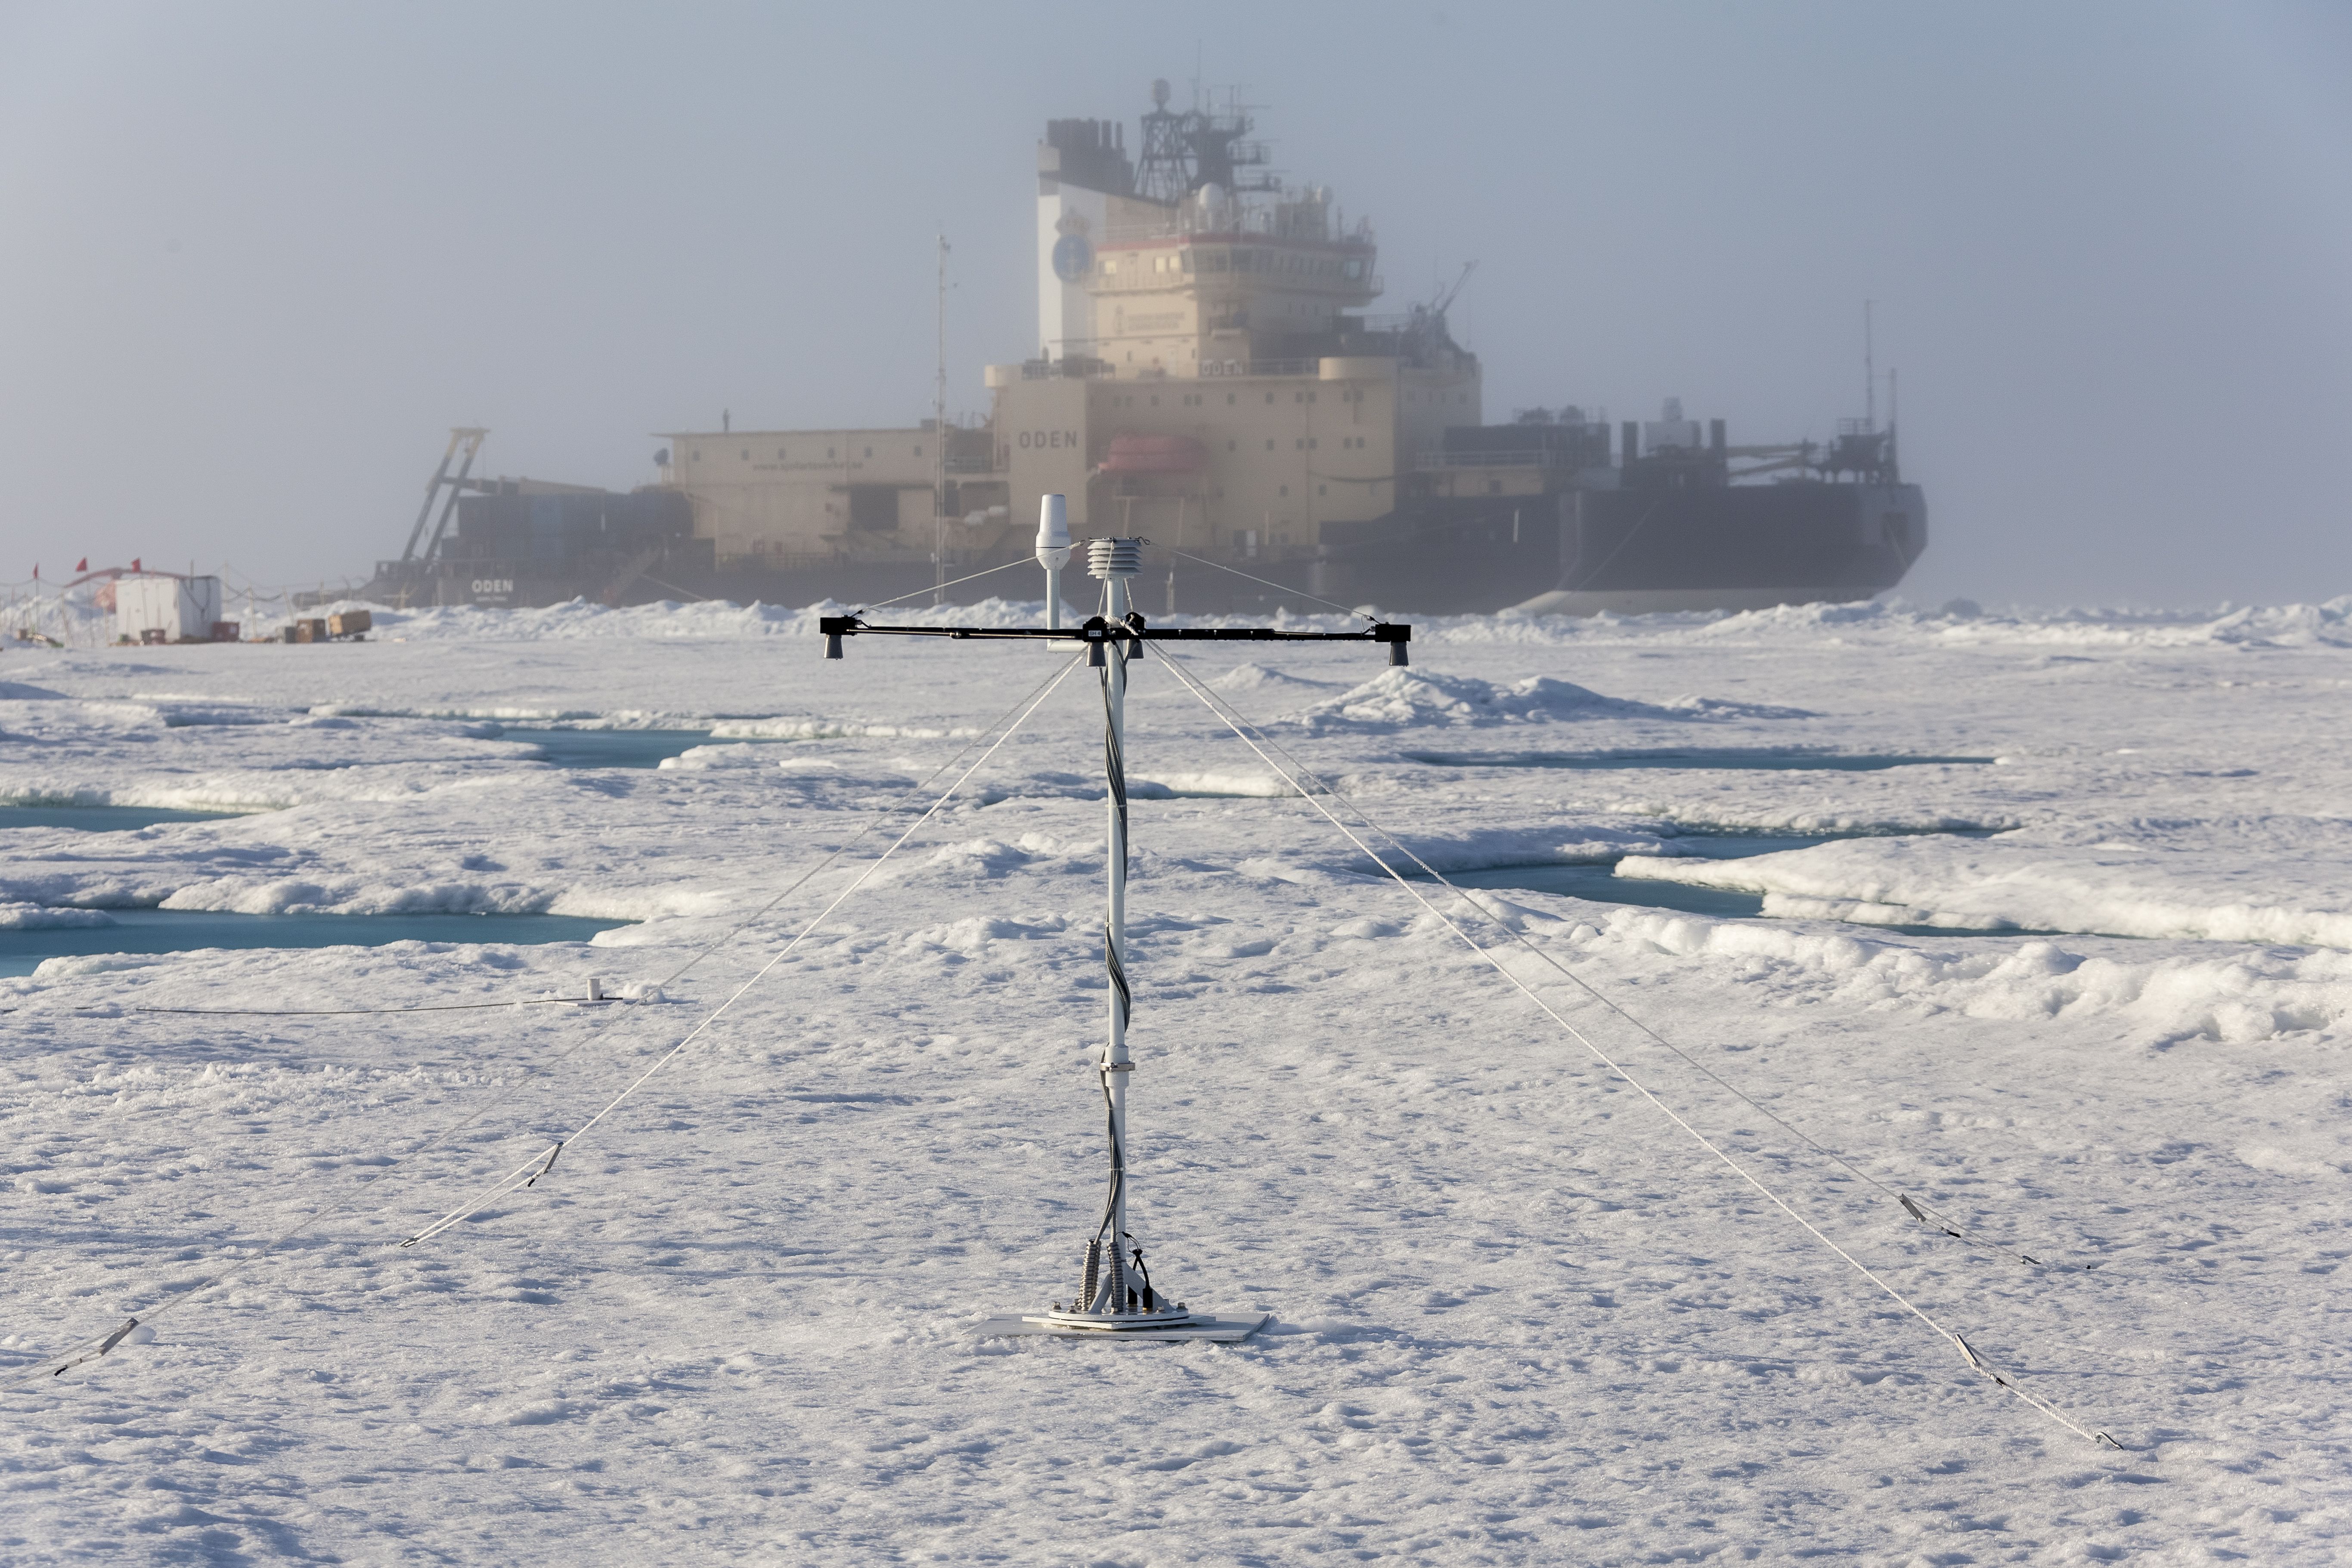
Since 2012, snow buoys have been used to measure the snow cover, air temperature and air pressure on and over the sea ice. By doing so, they have helped us gain a better understanding of the highly complex and heterogeneous snow cover on sea ice. In summer, after the snow has melted, they also measure the ablation (melting plus sublimation / evaporation) on the ice’s surface. Like all buoys, they also record their position – and with it, the ice drift – with every reading (usually every hour).
The central element consists of four ultrasonic sensors, each of which measures its distance from the snow’s surface. Accumulation and ablation of the snow change the respective distance. The electronics and power supply are housed in a steel cylinder embedded in the sea ice. Using four sensors (instead of just one) improves the accuracy of the readings, reduces the likelihood of a breakdown, and allows small-scale changes to be analysed.