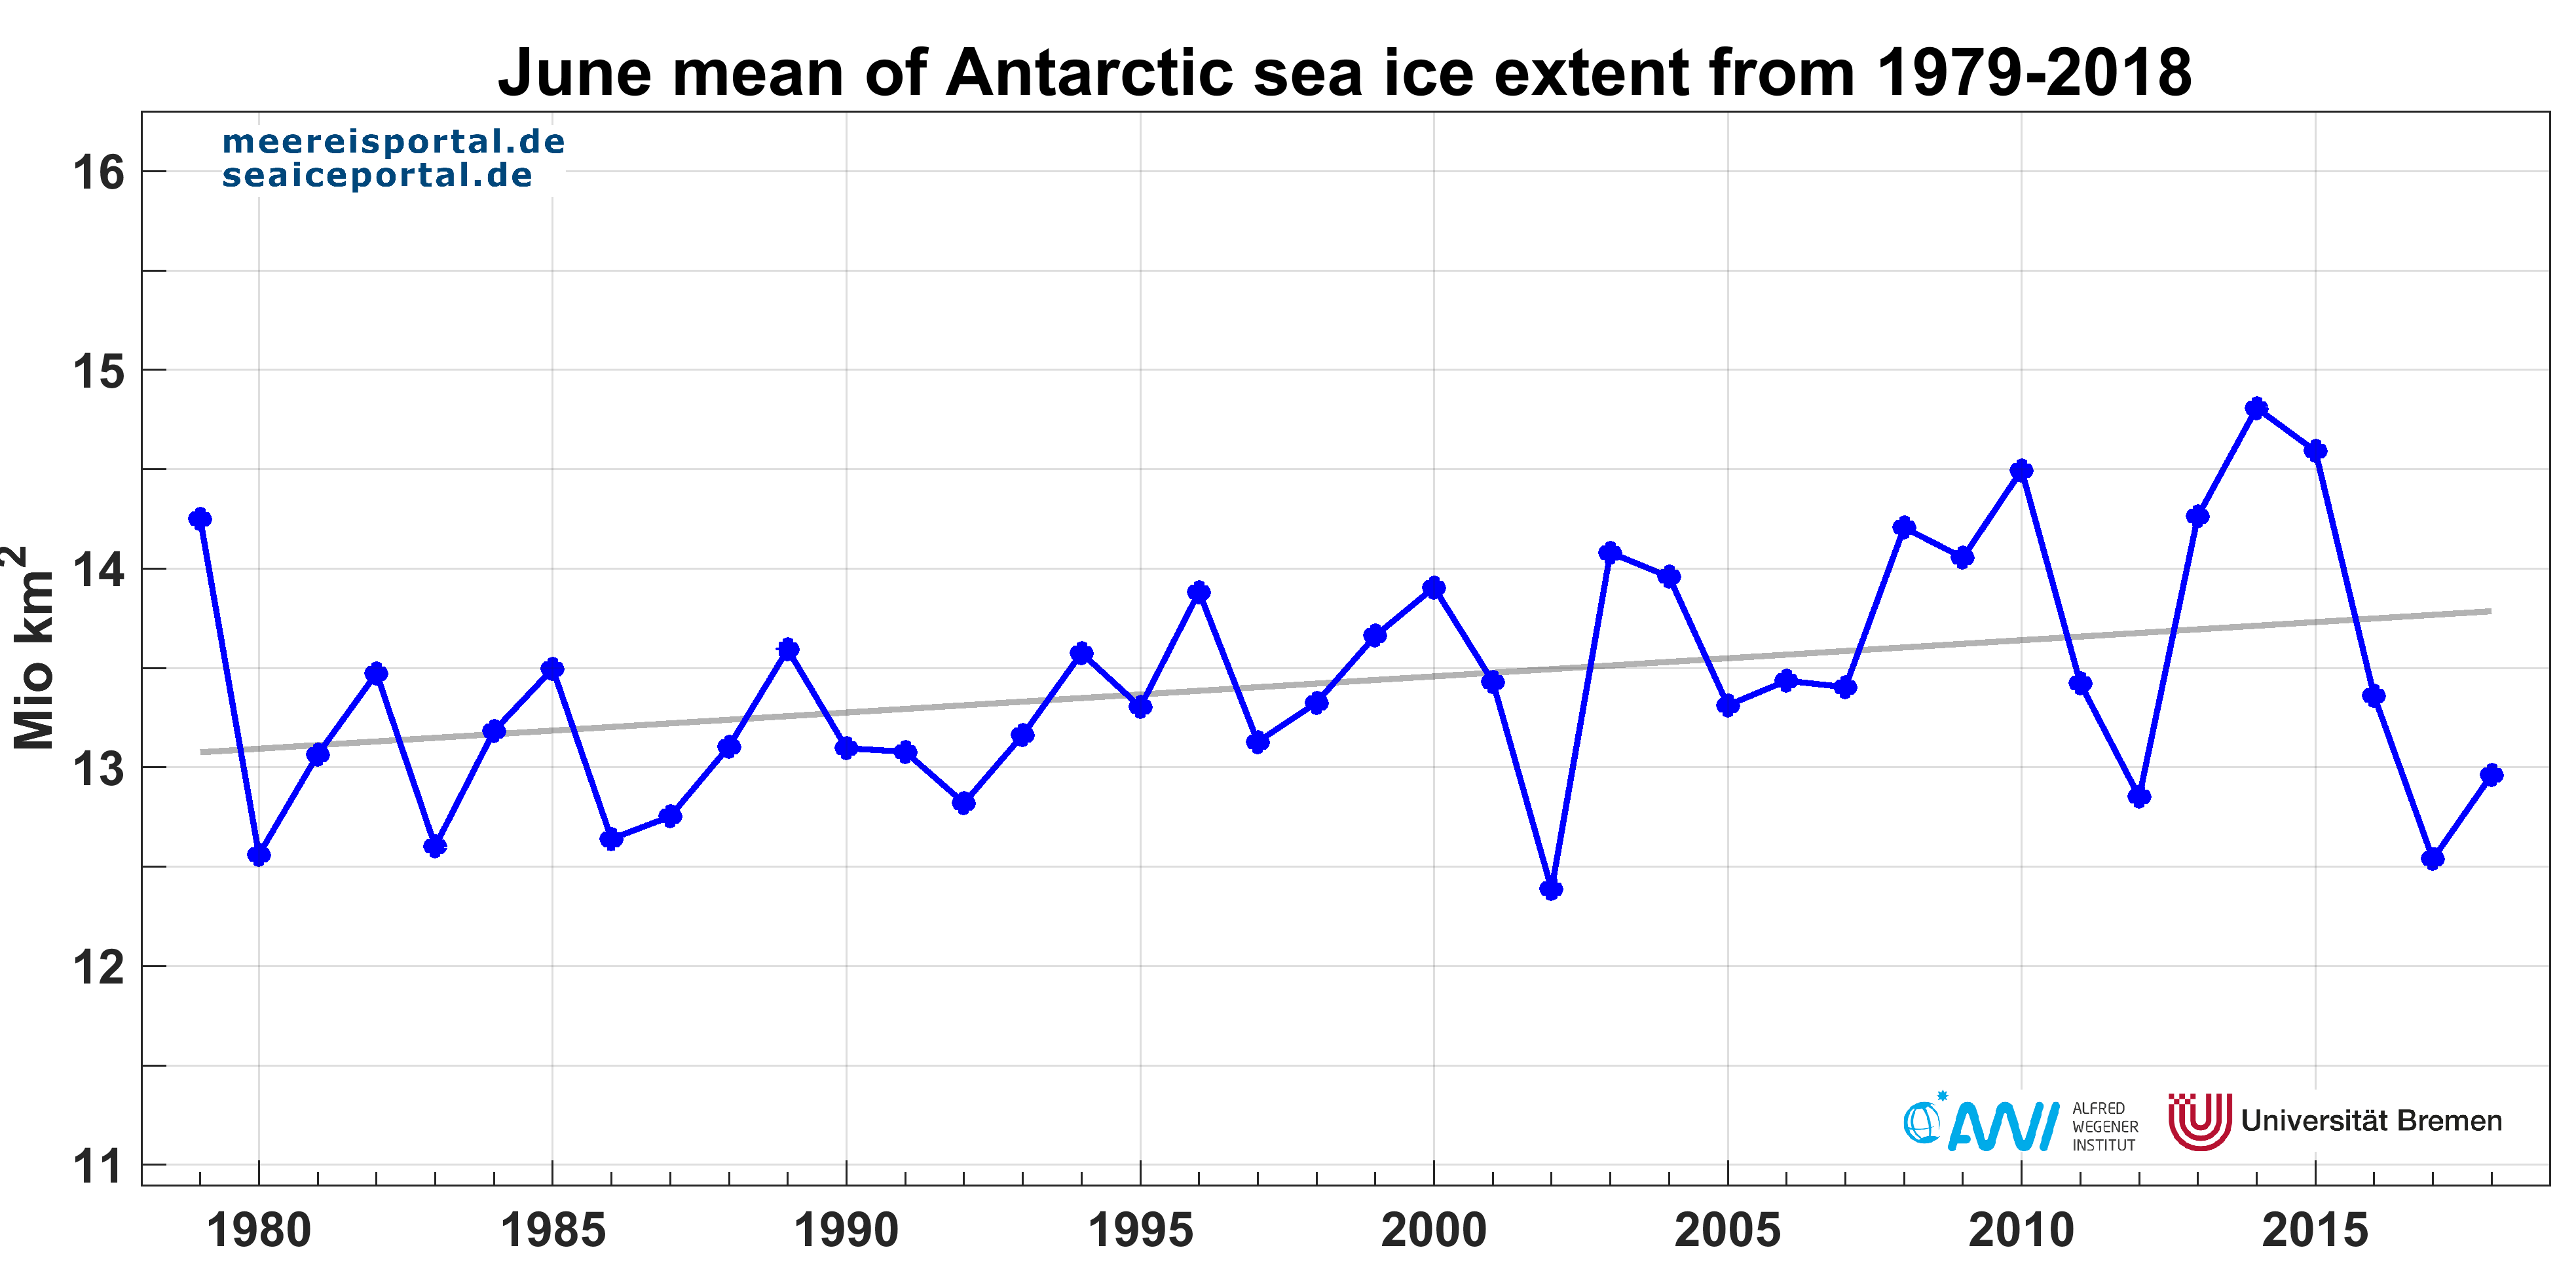
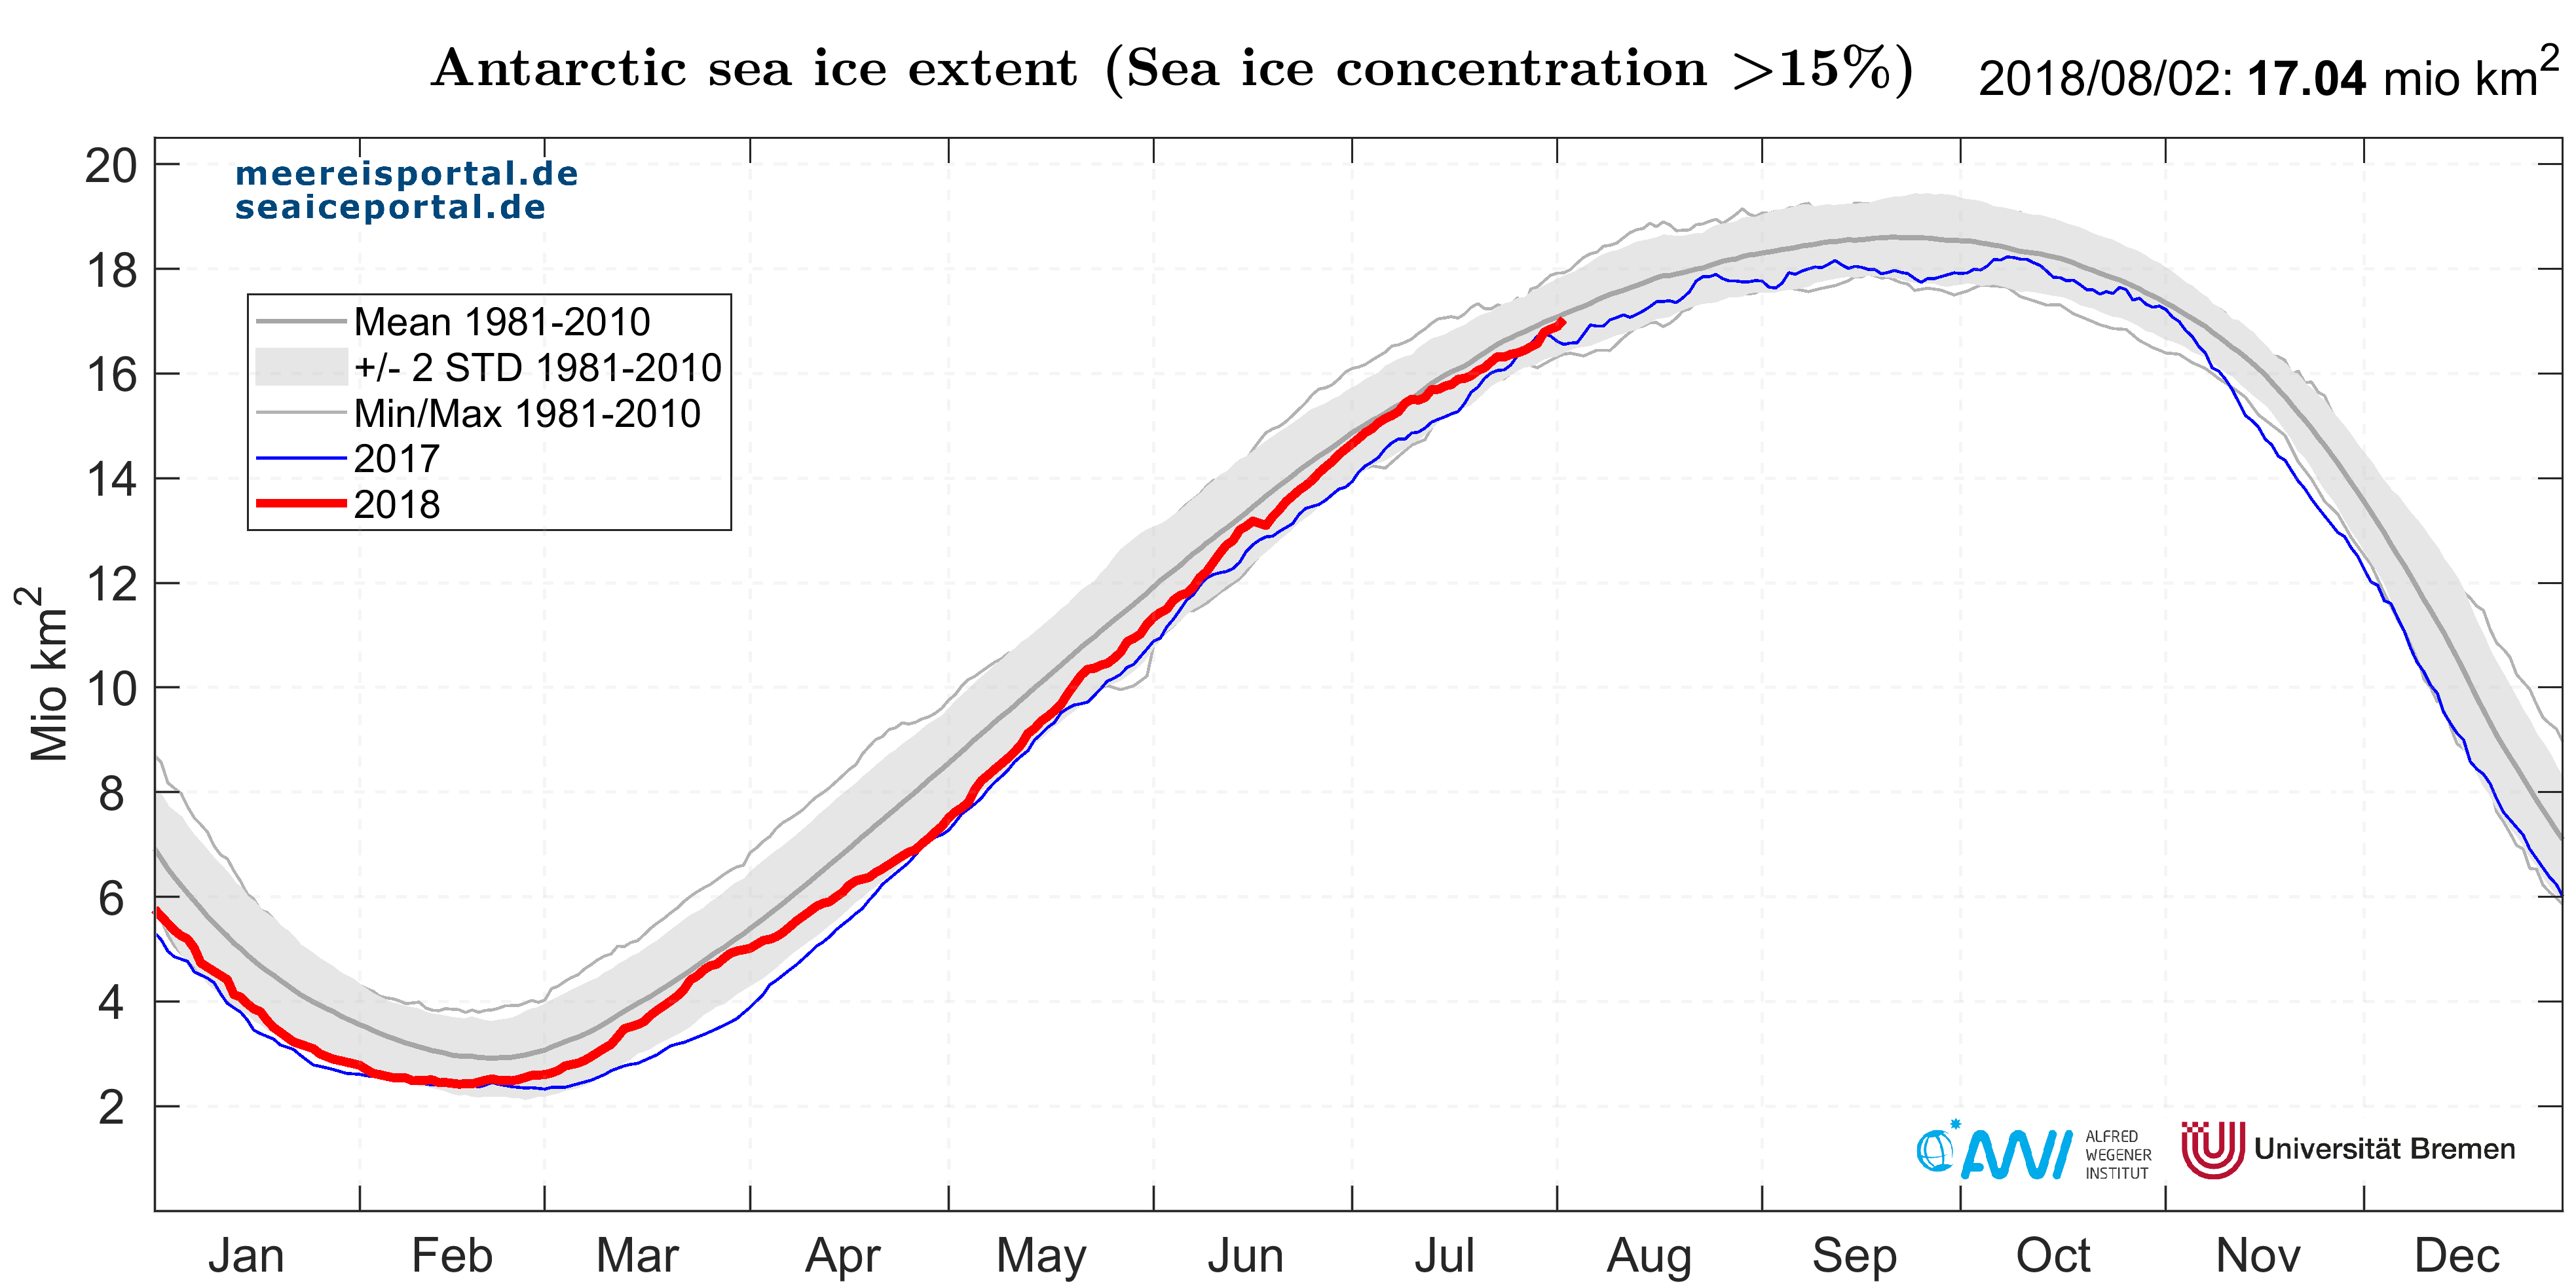
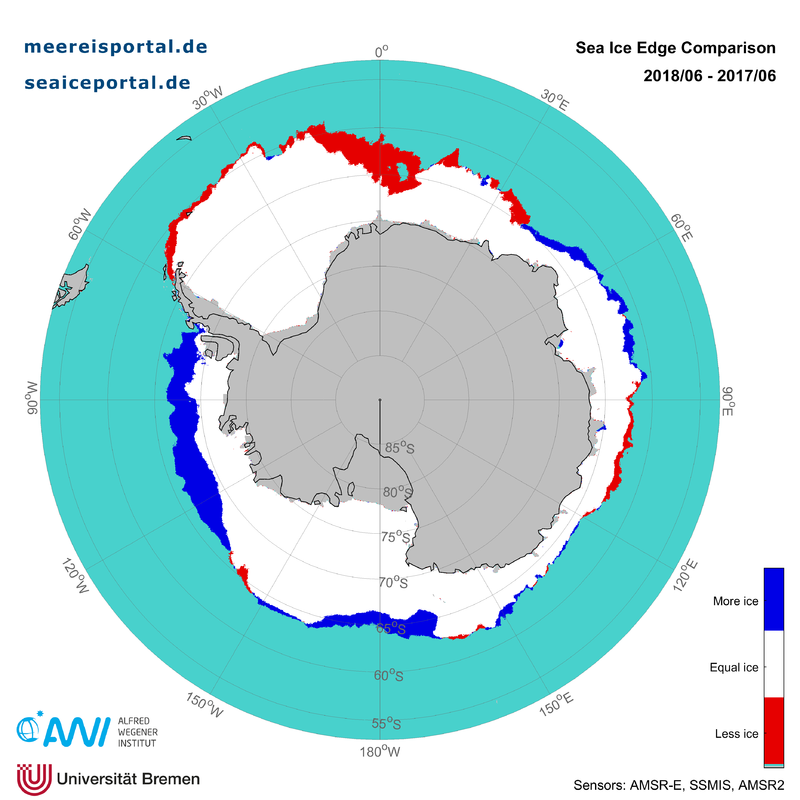
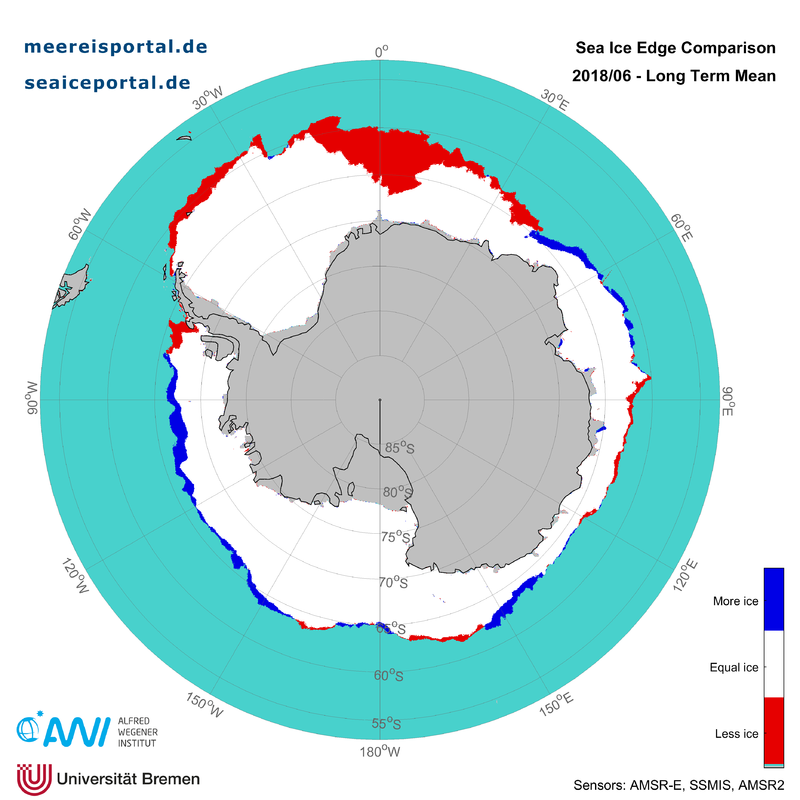
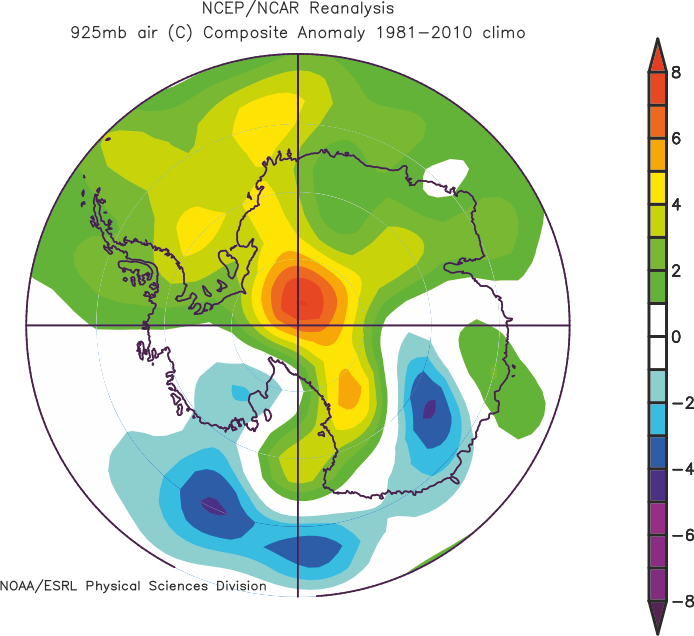
As our colleagues at the German overwintering station Neumayer III can attest, that doesn’t necessarily mean the weather will get warmer, but at least towards the end of the month they can look forward to seeing the first rays of natural sunlight again (read more here). And the maximum sea-ice extent around the Antarctic continent has by no means already been reached. Nevertheless, over the past few months the area of sea ice has grown by an average of 0.1 million km2 per day, a higher rate than has been observed in the past several years. As such, the mean sea-ice extent in June was 12.96 million km2, which puts it ca. 0.42 million km2 above the number for last June, but still below the long-term average (see Figures 1 and 2). As is common for Antarctic sea ice, the growth isn’t uniform, but characterised by considerable spatial variability. Both in comparison to 2017 (Figure 3) and to the long-term average (Figure 4), the growth in sea-ice extent has predominantly been in the West Antarctic sectors of the Bellingshausen and Amundsen Seas, and in the Ross Sea. In contrast, the eastern Weddell Sea in particular is home to a large-scale negative sea-ice anomaly; the sea ice has not spread as far north as usual. These differences are chiefly due to spatial variability in air temperatures over the Southern Ocean, as a result of which warmer air masses remained in the Weddell Sea sector, while unusually low temperatures were predominant in the northern Ross Sea (Figure 5).
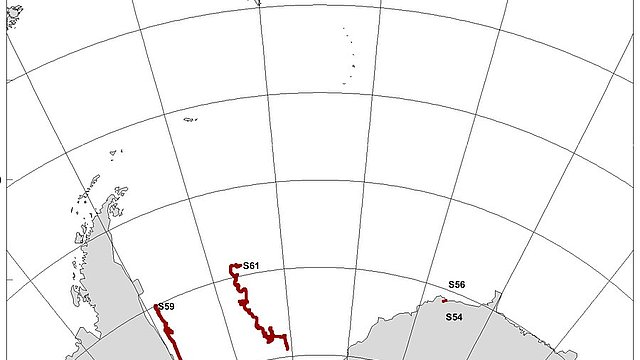
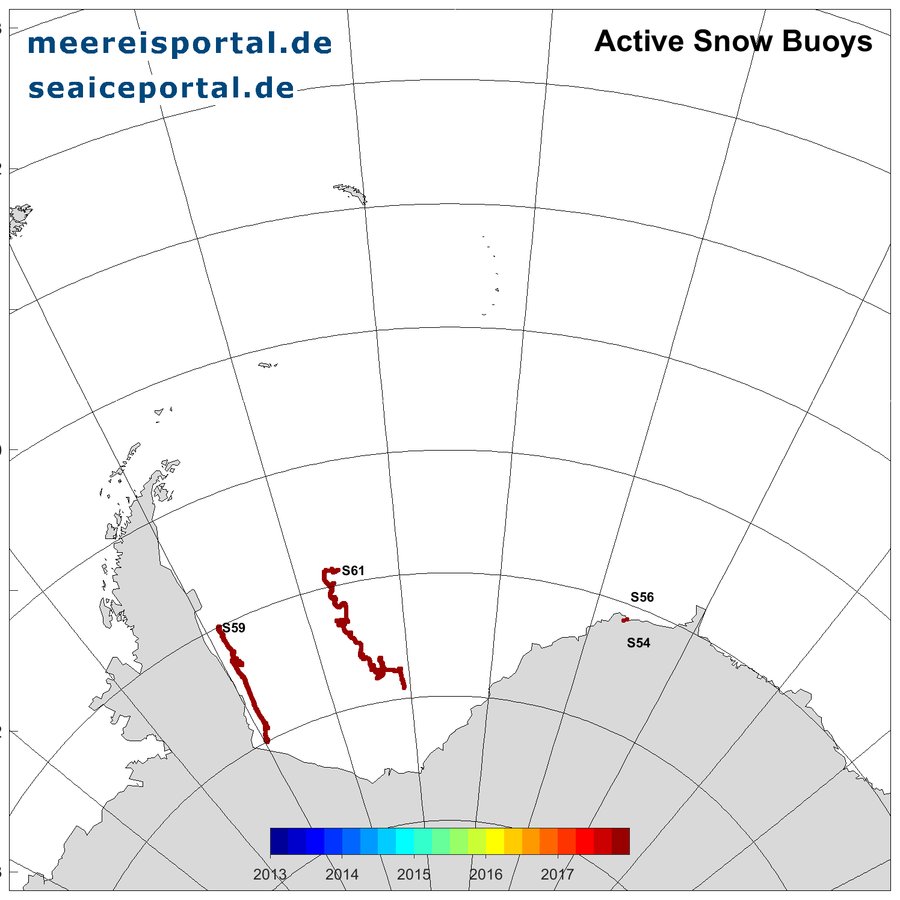
In order to analyse seasonal changes in snow and ice cover, and to investigate the atmospheric conditions with the aid of field data, during Expedition PS111 sea-ice physicist Stefanie Arndt (AWI) installed several autonomous recording systems, or buoys for short, on the sea ice. These systems drift with the sea ice and transmit the data they have gathered back “home” several times a day by satellite. One type are snow buoys (Figure 6), each of which is equipped with four ultrasound sensors that measure their distance to the snow’s surface on an hourly basis, providing data that can be used to derive the snow accumulation and ablation rates. Though Arndt and her team deployed six of these systems on the Antarctic sea ice this February, today only three are still transmitting; the rest were either damaged or destroyed when the floes broke up, or by “ridging”, which occurs when two ice sheets push on one another, overlap and form pack-ice ridges. The three functional buoys transmit snow, temperature and atmospheric pressure data from the southern, western and central Weddell Sea (Figure 7). Especially the data from the westernmost buoy (2018S59) reflects the previously mentioned, comparatively high air temperatures in June 2018, which measured up to -3°C at the beginning of the month. In terms of the snow cover measured, the three buoys paint a typical picture in comparison to the systems deployed in similar regions in past years: "Since February 2018, when the buoys were installed, we have observed a seasonal growth in snow thickness of between 10 and 50 cm, although the net snow balance for June was ± 0 cm" said Stefanie Arndt. Accordingly, though it would seem that the sea-ice extent around the Antarctic continent is slowly bouncing back in comparison to last year, the same can’t be said for snow cover on the ice of the Weddell Sea, where – despite higher air temperatures – no local changes are to be found. It remains to be seen how the sea-ice extent will develop, and above all, what the sea-ice winter maximum in September will be like, after its low values in the past few years.
Contact
Questions?
Contact us via E-Mail or our contact form.
Graphics


