The meteorological seasons are always three complete months long. The reason: so that, for the purposes of climatological assessments, only data for entire months has to be taken into account (e.g. the monthly means, monthly totals, monthly changes, extreme values, etc.). For the sea-ice extent in the two polar regions, this means that the maximum / minimum sea-ice extent is reached in the Arctic and Antarctic. In the Antarctic, this takes place in February, while in the Arctic the maximum sea-ice extent usually isn’t reached until the first half of March.
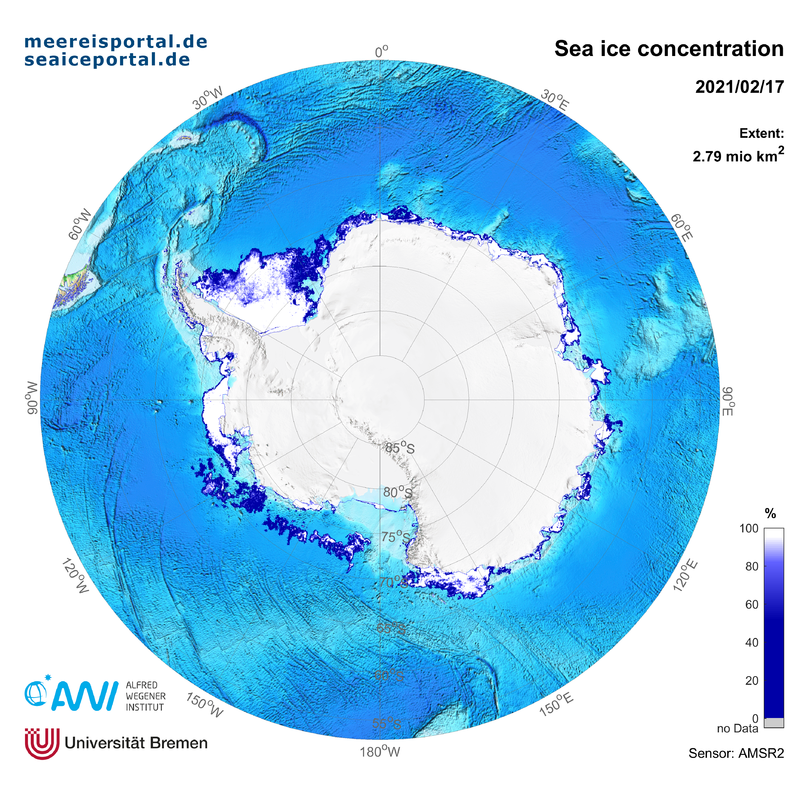
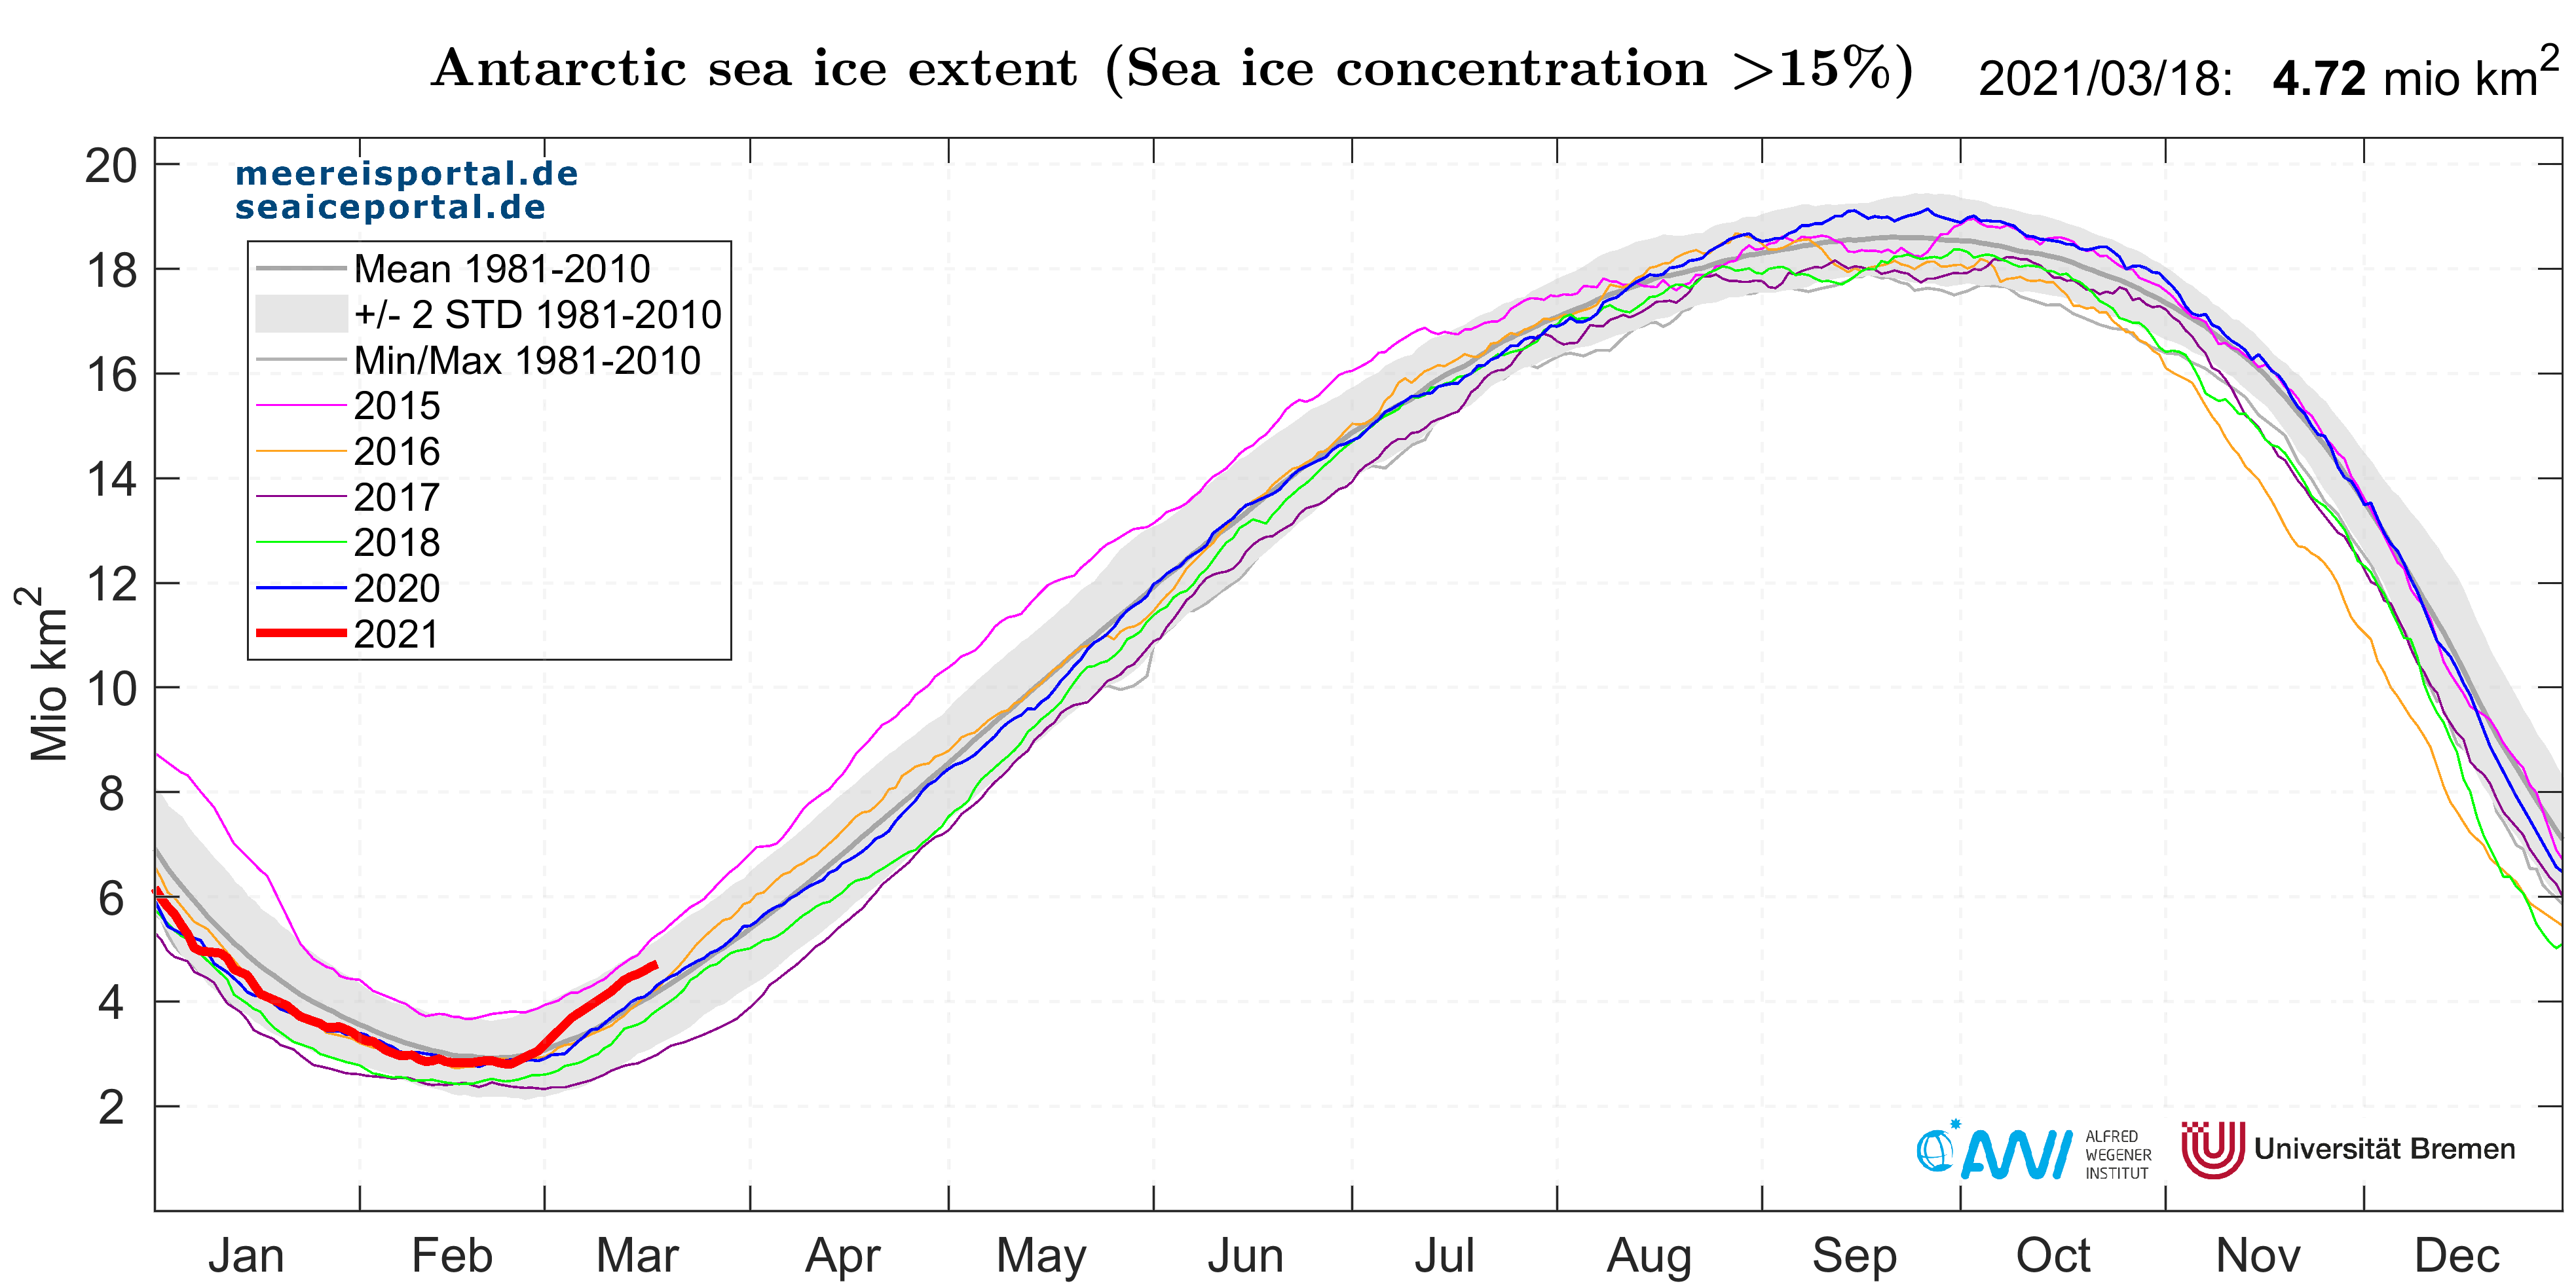
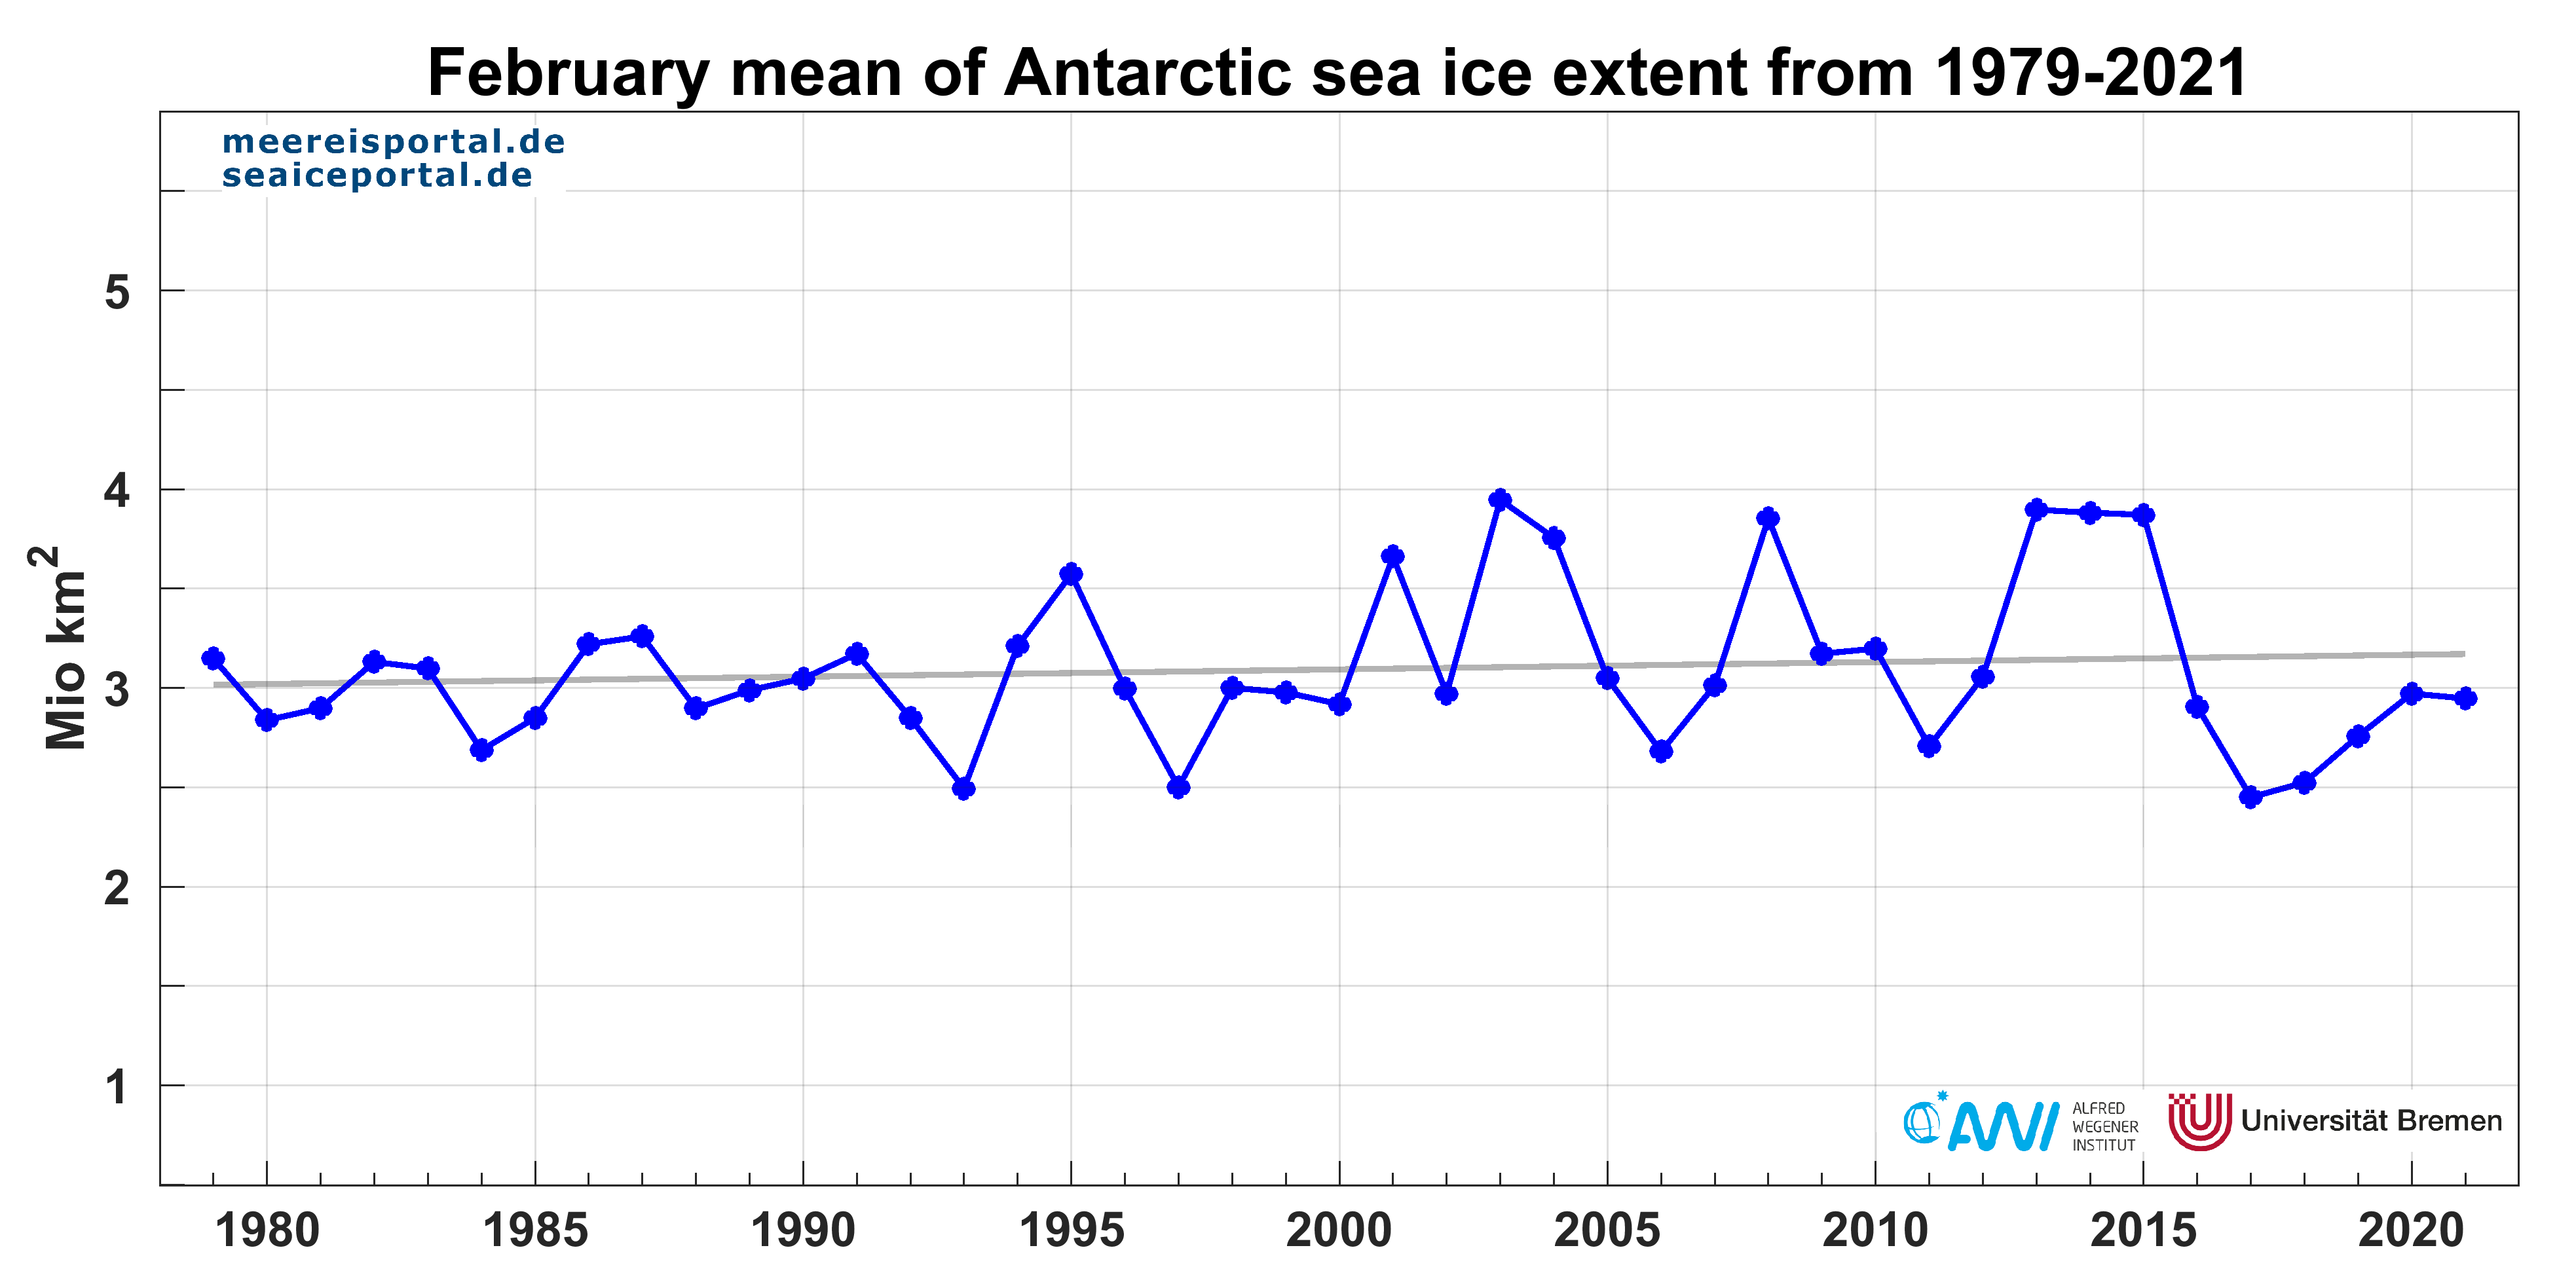
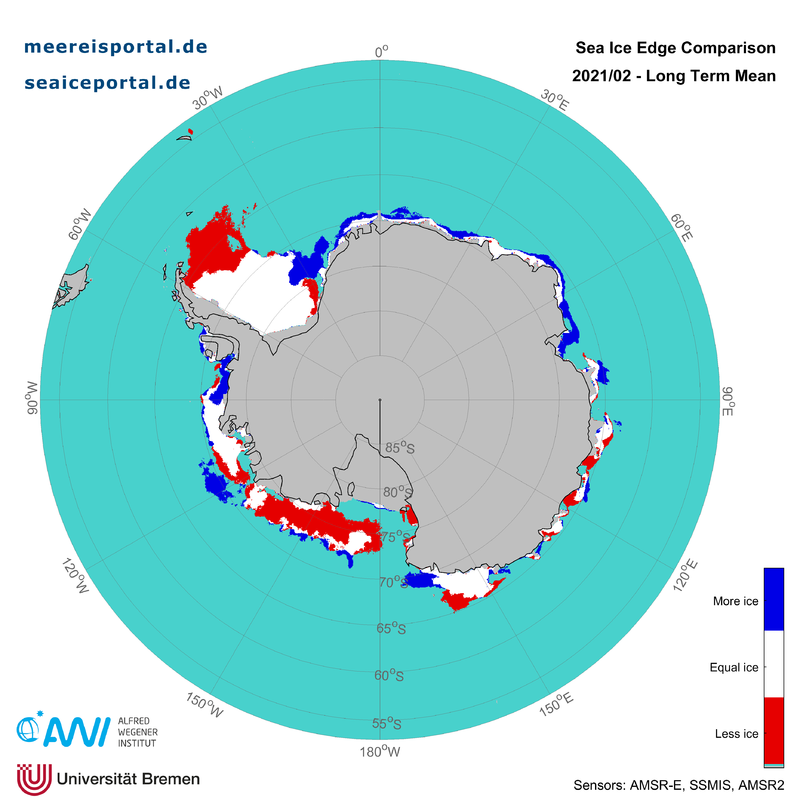
This year, the sea-ice extent in the Antarctic reached its minimum on 17 February 2021: 2.79 million km² (Fig. 1 and 2). The monthly mean sea-ice extent was 2.95 million km², just 7,970 km² above the long-term average for the years 1981 – 2010 (Fig. 3). The long-term trend for monthly mean sea-ice extent in February continues to be slightly positive and indicates a 1.19% growth in sea-ice extent per decade. At the same time, there are three regions in which the sea-ice extent is significantly below the long-term average. One is in the northwest Weddell Sea, where the ice edge has retreated far to the south of 65° S (Fig. 4). That hasn’t been the case there since 2009.
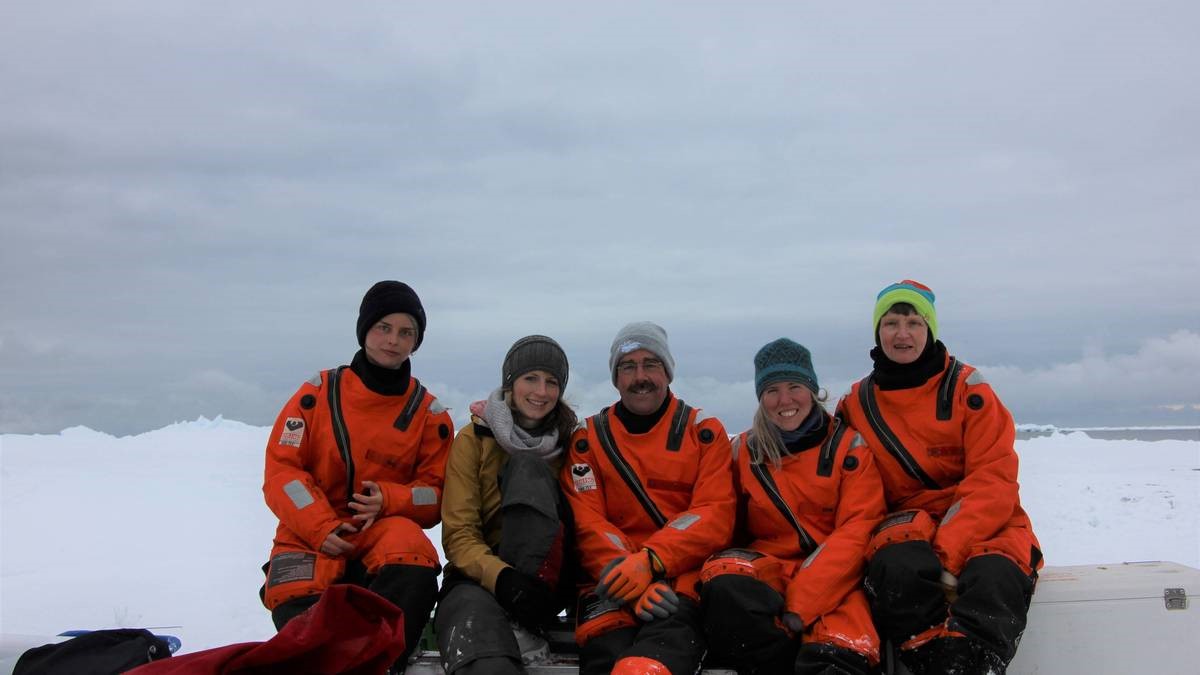
A second ice-free region in the Weddell Sea is growing to the southeast, in the northern Filchner Trough, where a large polynya has formed, so that there is open water up to the Filchner Ice Shelf. The research icebreaker Polarstern is currently in the region, during Cruise PS124, and is capitalising on the favourable conditions to pursue a comprehensive oceanographic, biological and biogeochemical research programme in the southeast Weddell Sea. The AWI’s Sea Ice Team is also on board, and is investigating the sea ice near the Filchner-Ronne Ice Shelf, with a focus on gauging the ice’s salt content, and on measuring its drift parameters and physical characteristics. To do so, the members are combining direct ice measurements with an extensive sea-ice buoy programme (photo). Initial data from the buoys deployed is now available in near real-time (Fig. 5).
In addition to the two mentioned above, this year another, particularly ice-free region lies in the central and eastern Ross Sea. Here, both in comparison to previous years and to the long-term average, the sea has virtually disappeared, and only a handful of ice fields remain. Only in the Amundsen and Bellingshausen Seas is the ice cover near average. In the East Antarctic, slightly expanded ice cover can be seen throughout the Atlantic and Indian Sectors, while the West Pacific Sector is characterised by average to slightly below-average ice fields. In terms of sea ice, the winter 2020 / 2021 was generally average: although initially slightly below average in December, by late January and in February, the sea-ice extent hovered around the climatological average for the years 1981 – 2010. In terms of the lowest extents, February landed in the middle range at 16th place, while the other two winter months December (17th place) and January (10th place) were similar.
The substantial ice retreat in the northwest Weddell Sea could be due to the unusually high atmospheric temperatures in the vicinity of the Antarctic Peninsula and western Weddell Sea, which were up to 3° C over the long-term average (in terms of the monthly mean, see Fig. 6). In addition, the pronounced low-pressure system that stretched from the Amundsen and Bellingshausen Seas to the northern Weddell Sea may have broken up the sea ice in the eastern Ross Sea, or driven it away from the Antarctic Peninsula in the Weddell Sea and out to open water, where it could melt.
Since early March, there has also been a striking sea-ice development: within just ten days, the sea-ice extent grew by 1.19 million km² (Fig. 2). This equates to a growth of ca. 120,000 km² – roughly the combined size of Bavaria, Baden-Württemberg and Rhineland-Palatinate – per day. The majority of ice growth took place in the eastern Ross Sea (Fig. 7), most likely caused by the unusually low temperatures of up to 9° C below the long-term average in Marie Byrd Land. Katabatic winds could have greatly cooled the surface water, leading to intensified sea-ice production. However, as of March 11, sea ice growth has returned to average growth rates for this time of year.
Bound for the Winter Maximum Sea-ice Extent in the Arctic
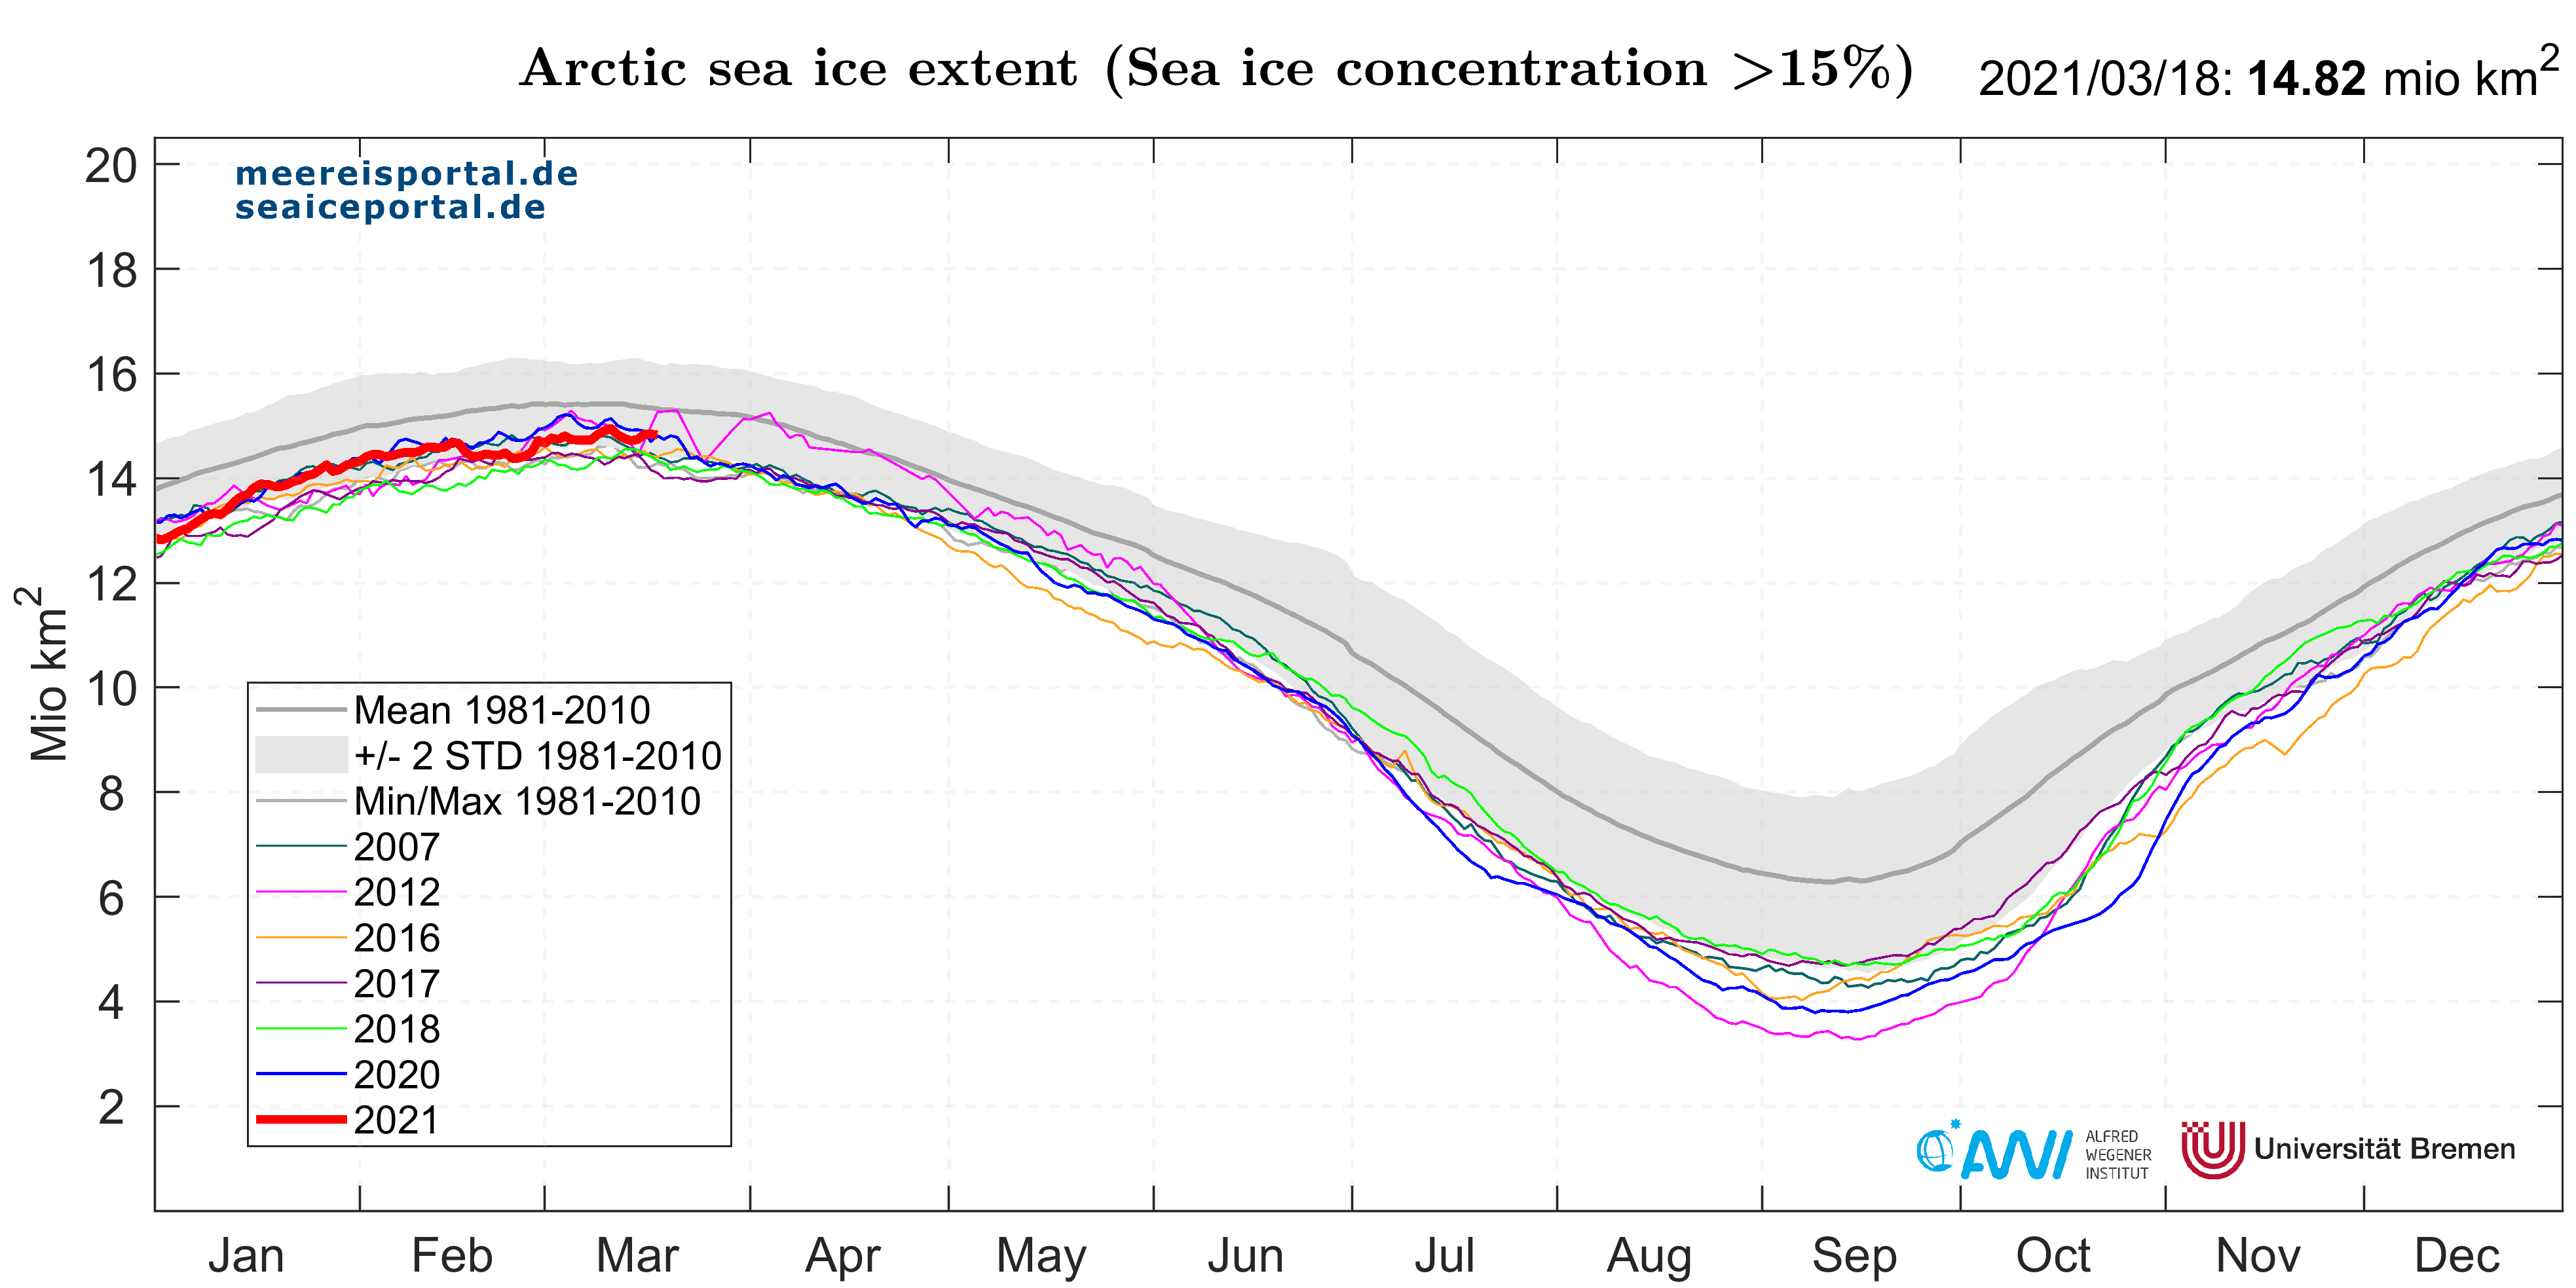
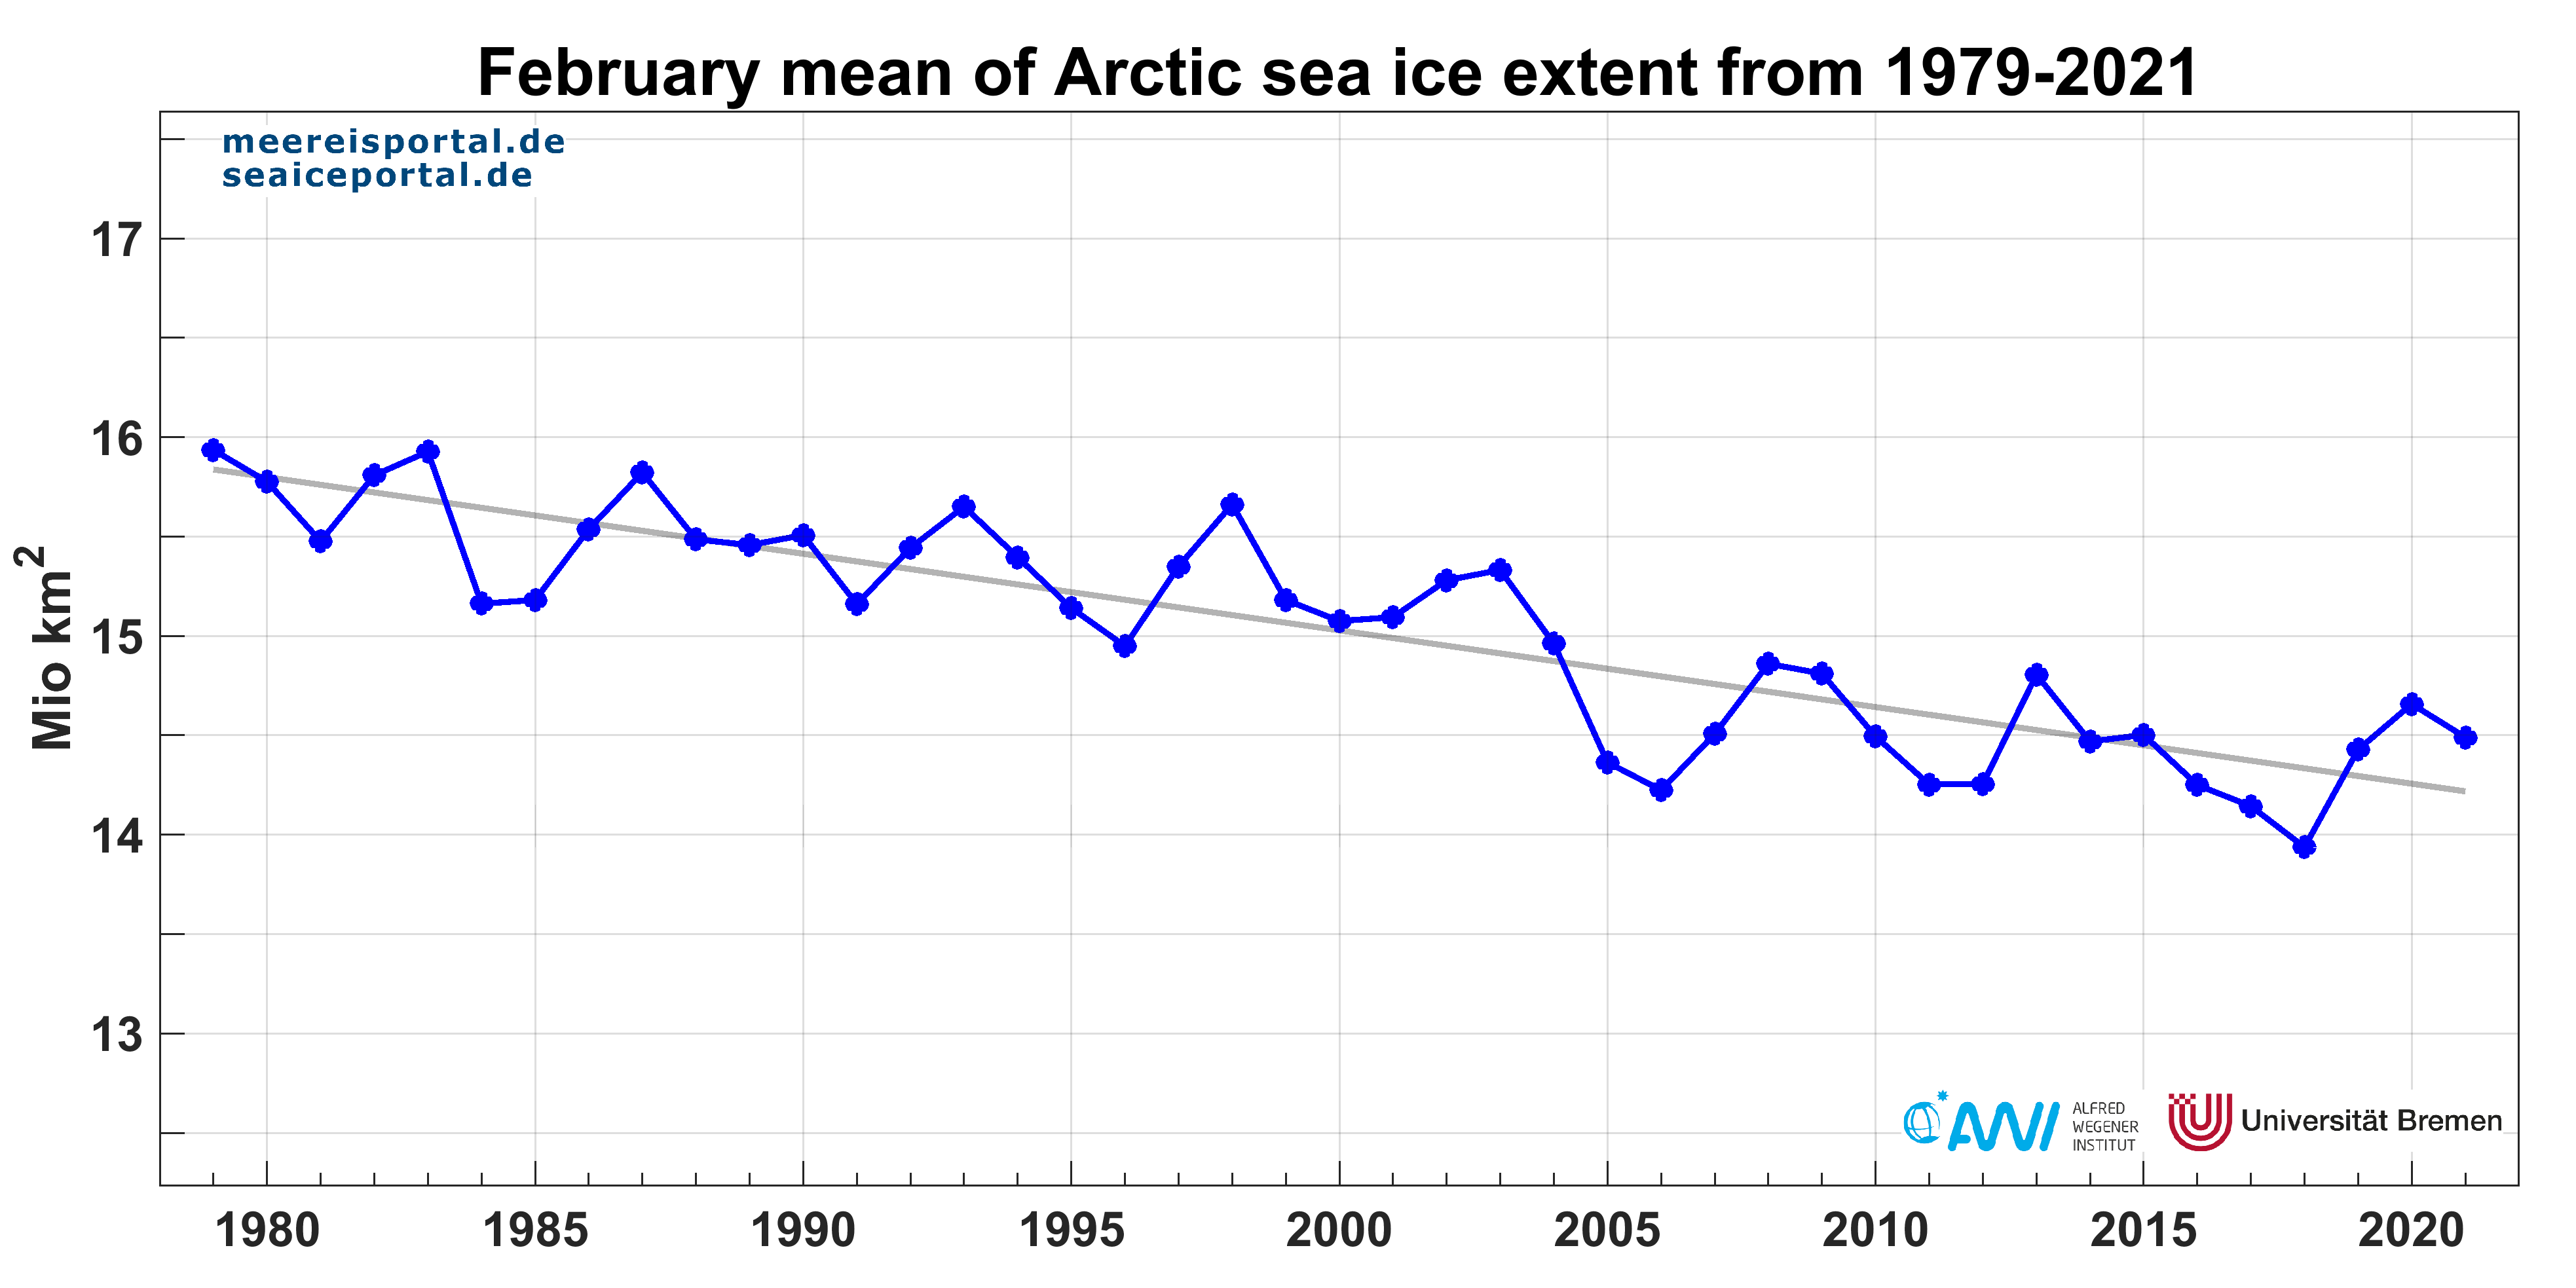
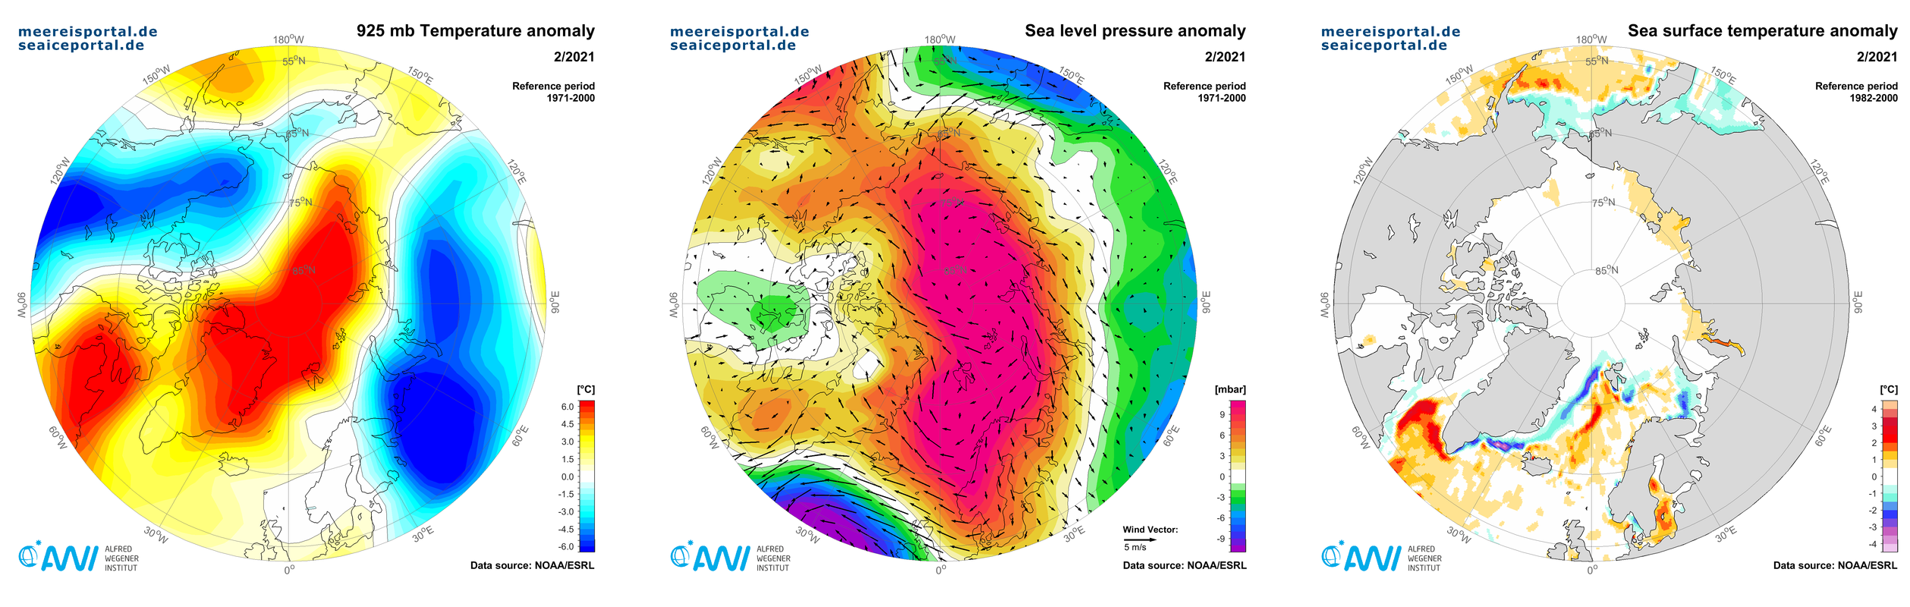
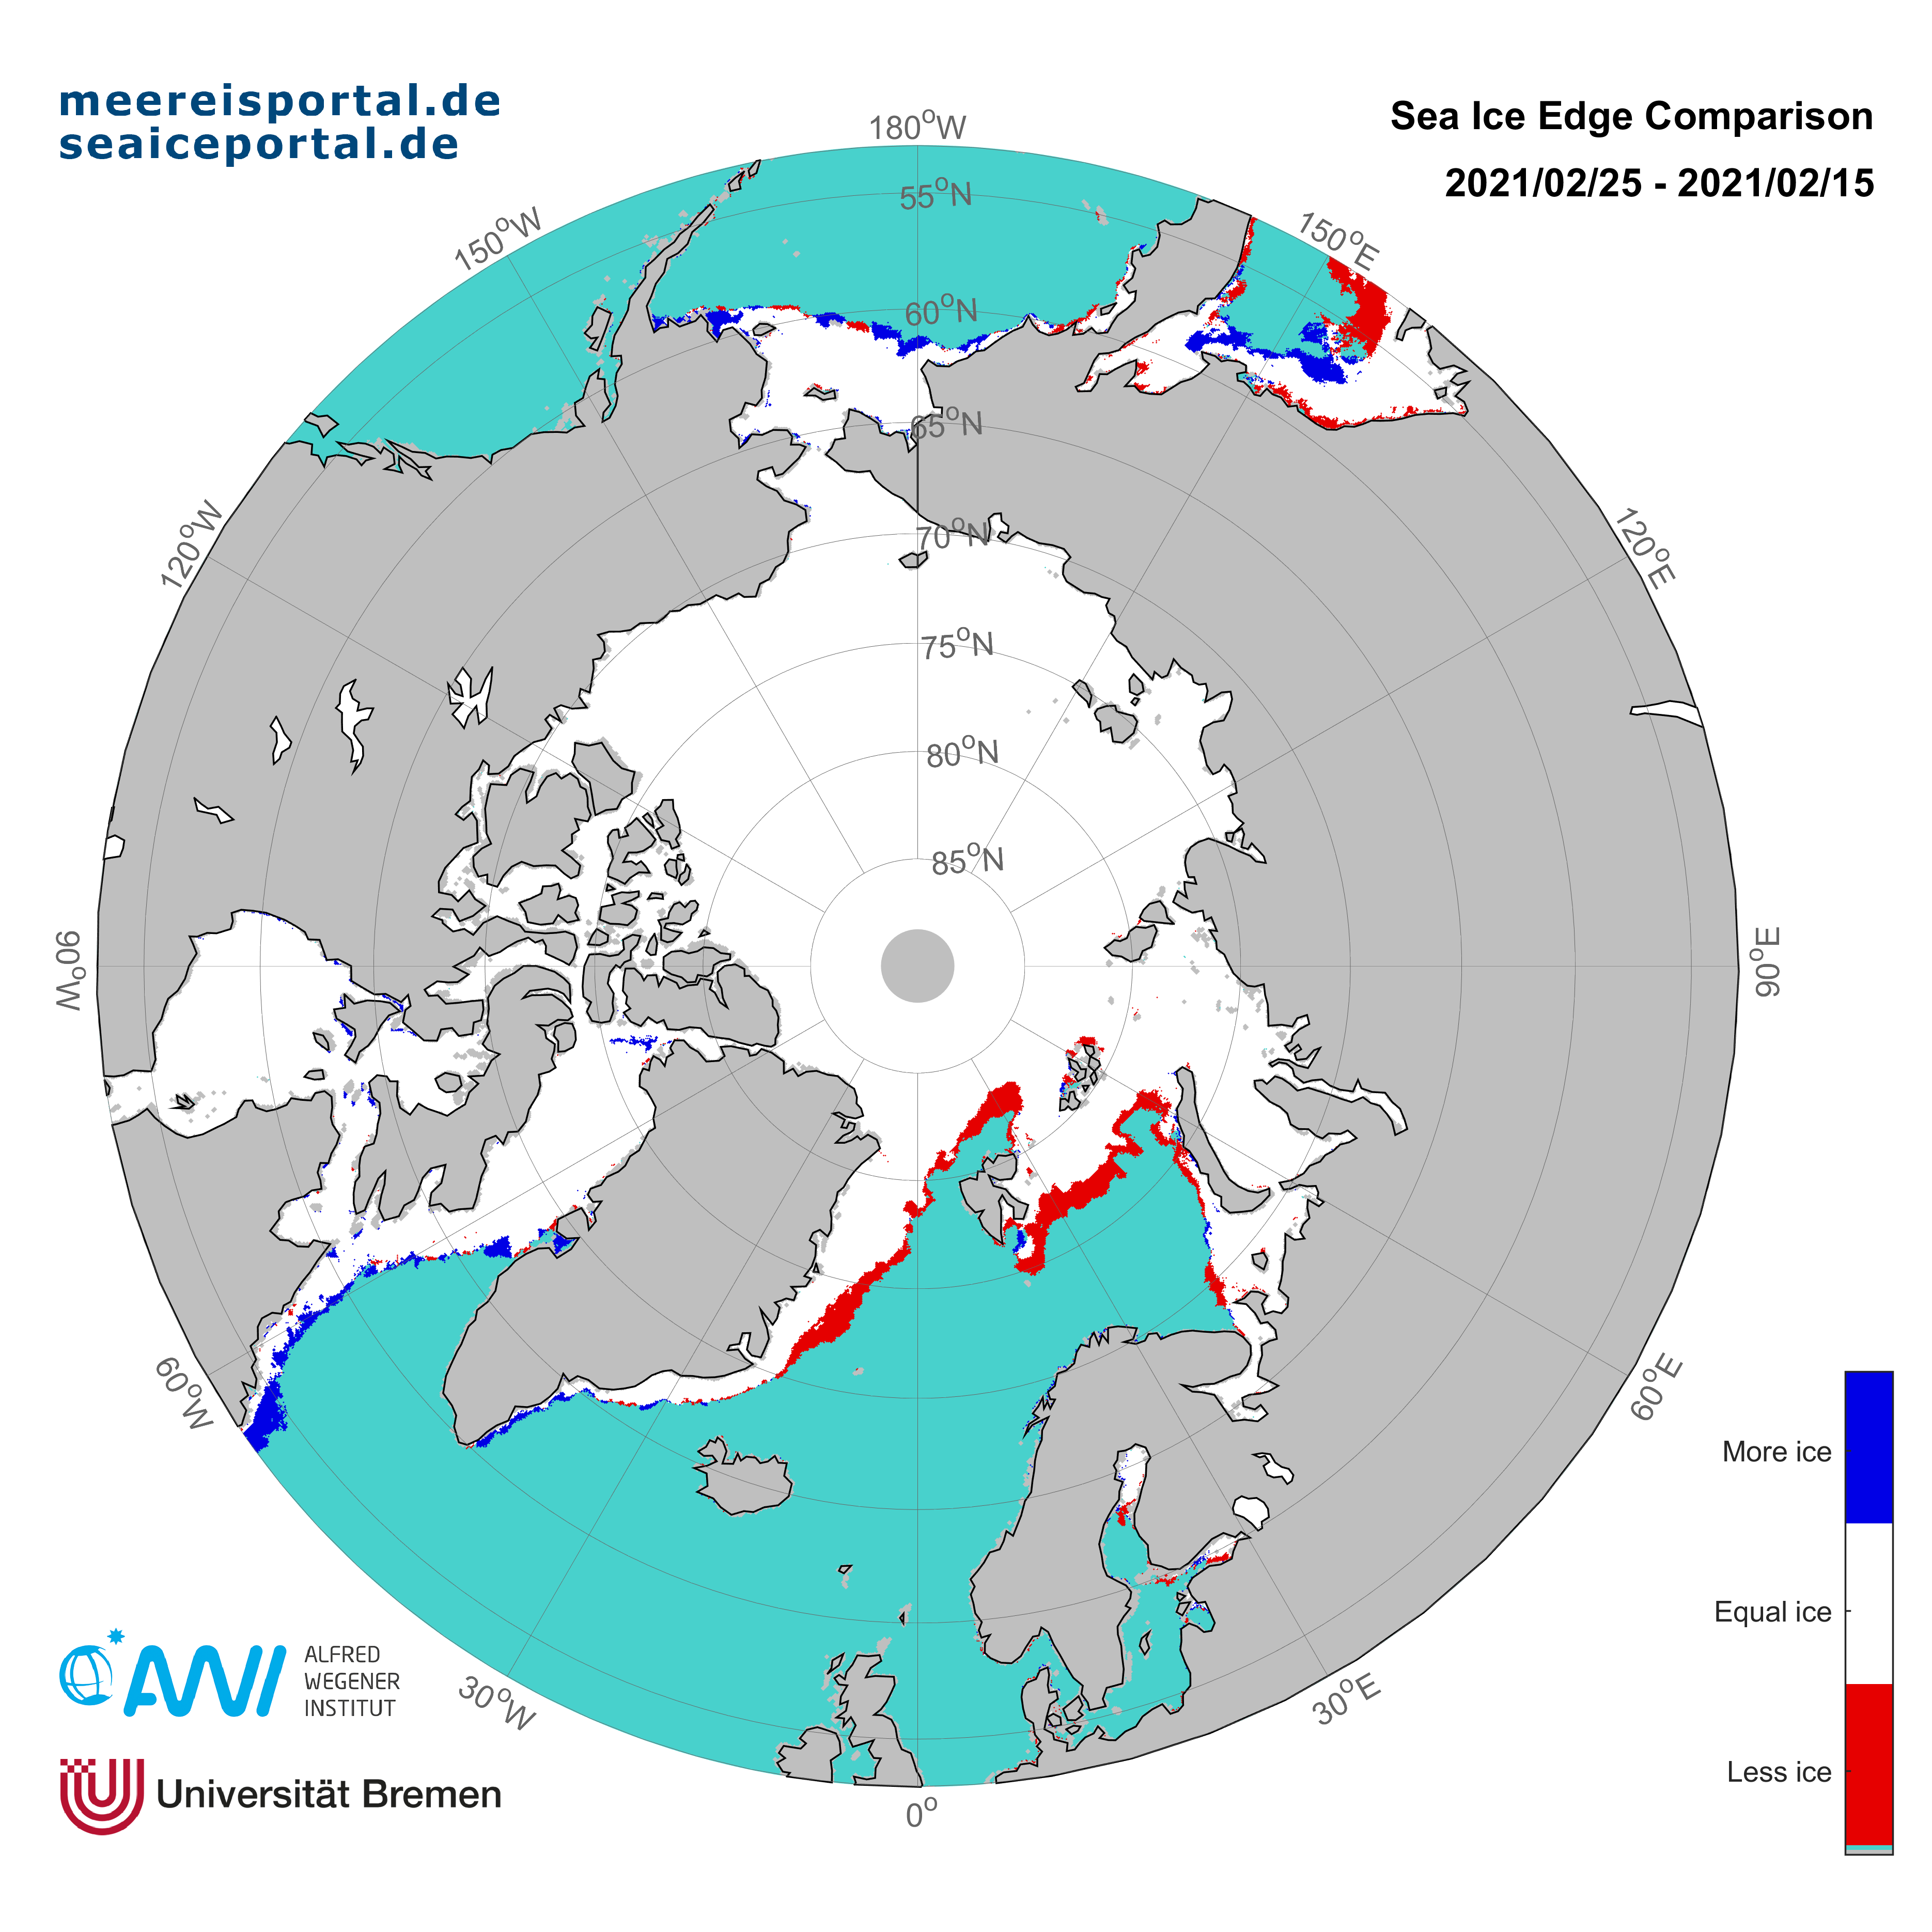
In the Arctic, the winter maximum sea-ice extent has yet to be reached (Fig. 8). The mean sea-ice extent in February was 14.49 million km²: 720,000 km² below the long-term average for the years 1981 – 2010 but 553,000 km² above the record low from 2018 (Fig. 9). The trend for the month of February amounts to a loss of 2.5 % per decade and shows that the sea-ice extent in the Arctic is successively declining, even in winter. In comparison to the long-term average, a loss of sea-ice cover can especially be observed in the eastern Greenland Sea and the Barents Sea. This could be a consequence of the increasing Atlantification of the Arctic: more and more warm water masses from the Atlantic are now penetrating the middle depths in the Arctic, producing a larger reservoir of heat that keeps the water’s surface from freezing. In addition, in both the Bering Sea and Sea of Okhotsk, the ice edge has generally retreated further north.
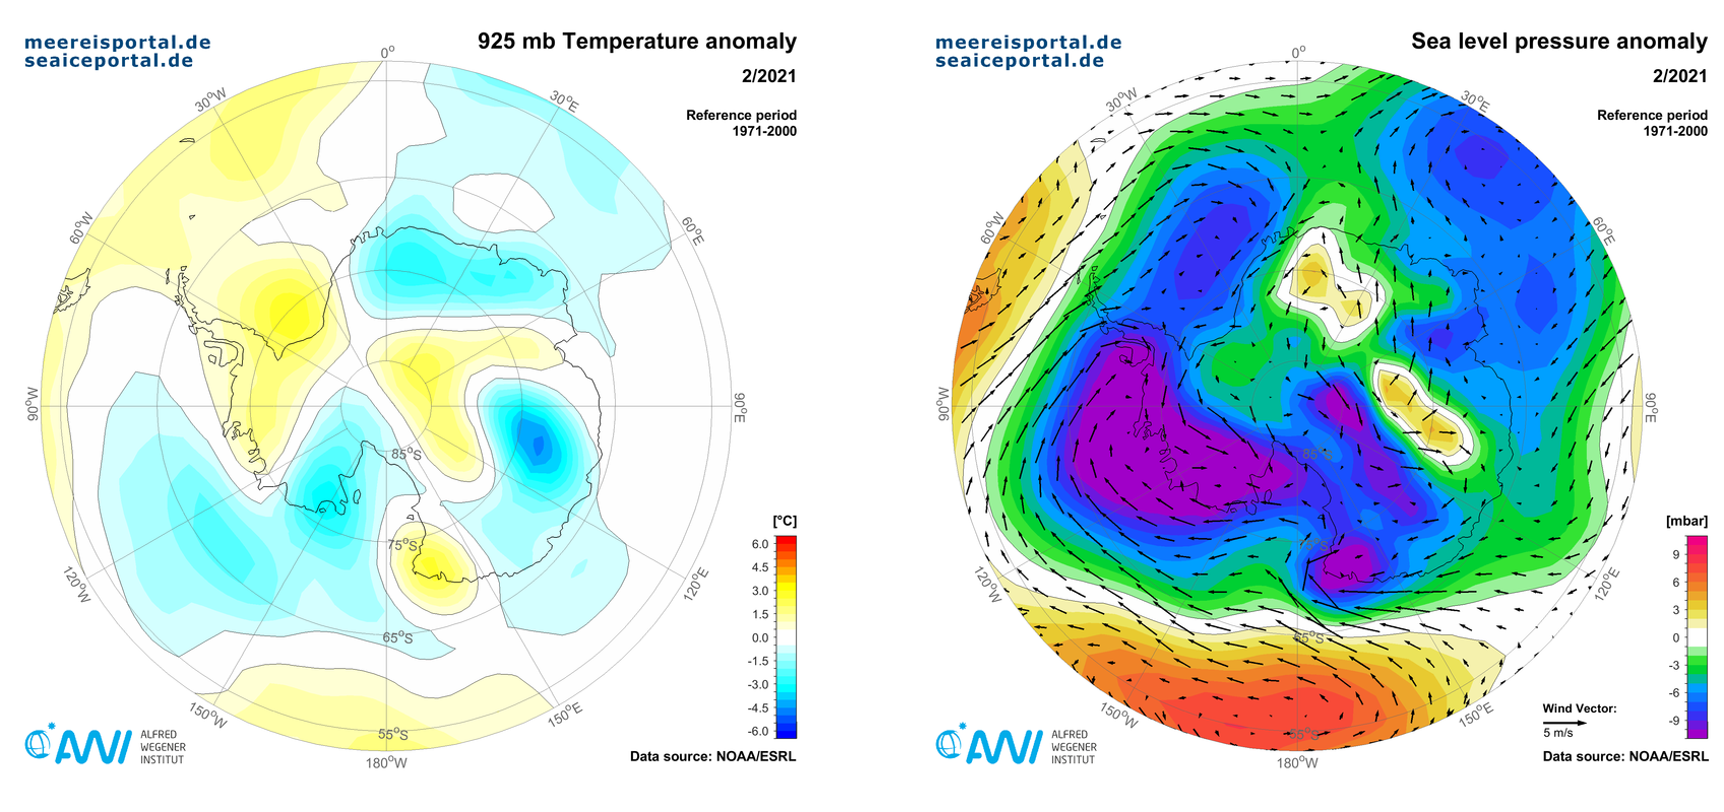
In broad expanses of the central Arctic Ocean, from the East Siberian Sea to the Barents Sea, and from northern Greenland to the Canadian Arctic Archipelago, the air temperatures at 925 hPa (ca. 760 m) were between 1 and 6° Celsius above the long-term average. In contrast, in Siberia, northern Alaska and in the Beaufort Sea, the temperatures were up to 6° Celsius below the long-term average (Fig. 10). The air pressure at sea level was characterised by a pronounced high-pressure area over the central Arctic Ocean, which drove an unusually powerful clockwise sea-ice circulation in the Beaufort Gyre and led to the transport of thick, multiyear ice along the Canadian Arctic Archipelago, towards the coast of Alaska (source: NSIDC).
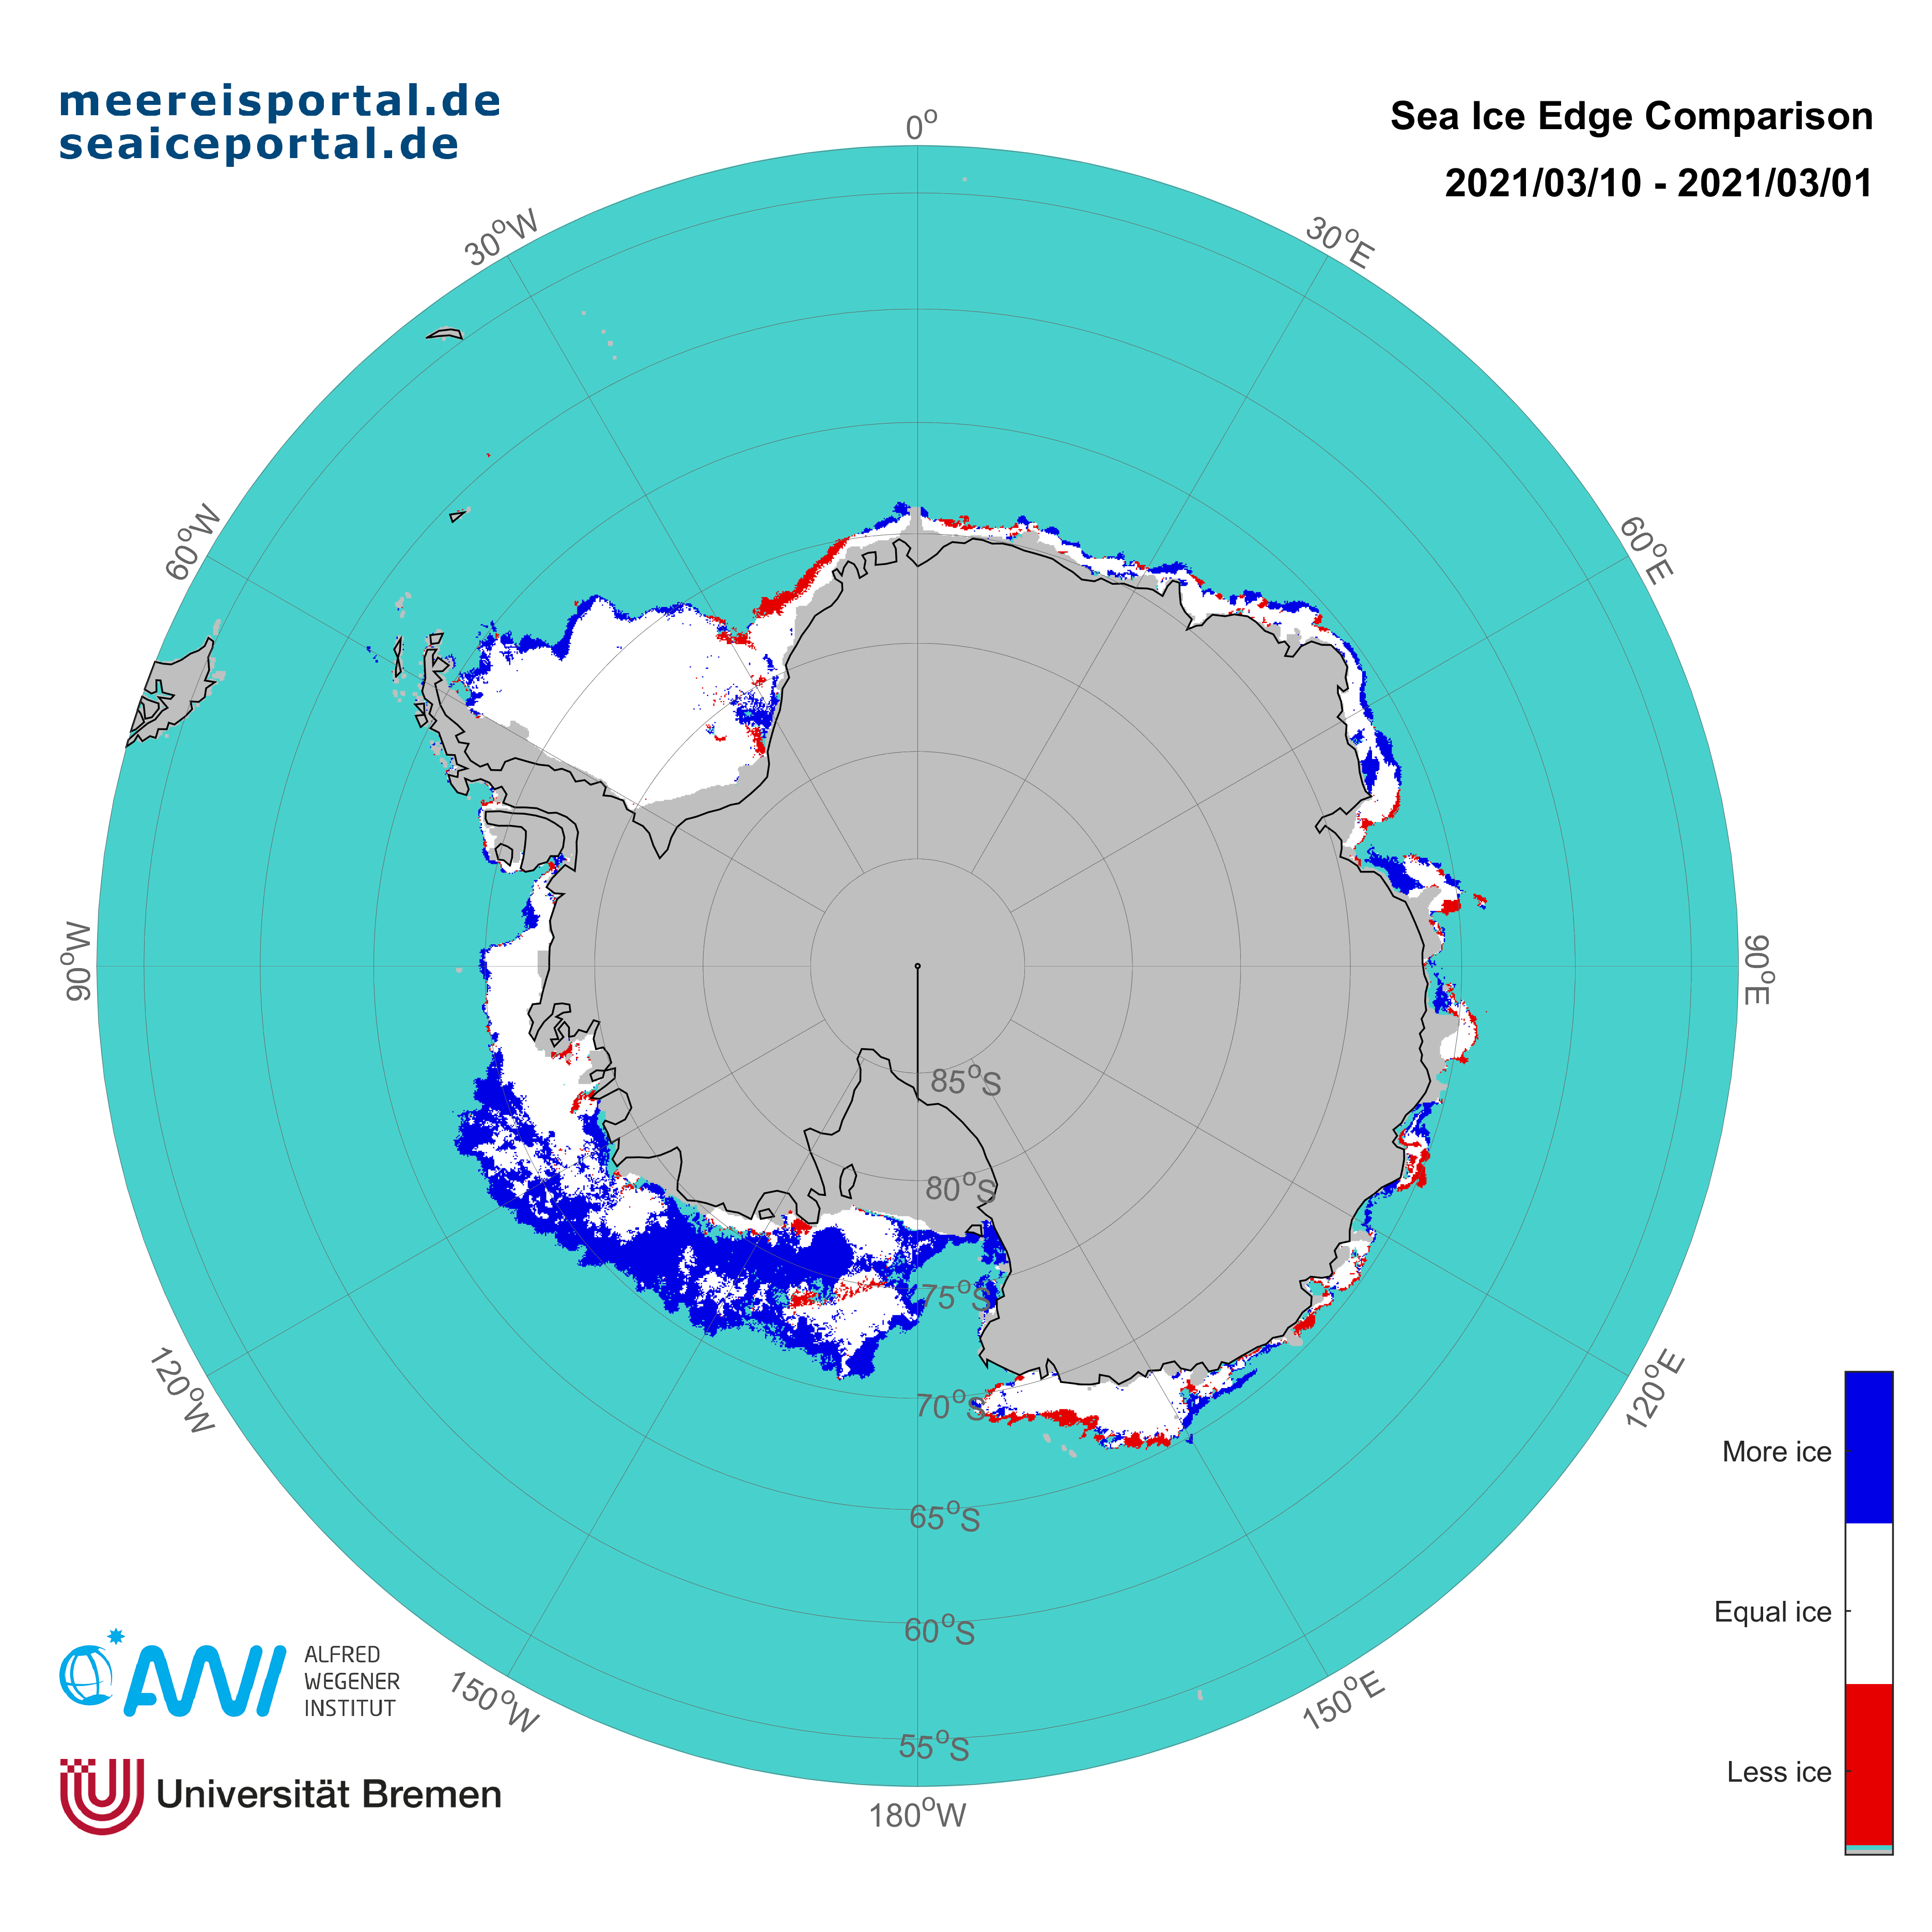
In the second half of the month, the sea-ice extent declined by ca. 15,000 – 20,000 km² (Fig. 8), chiefly due to the retreat of the ice edge in the eastern Greenland Sea and Barents Sea (Fig. 11). In addition, the sea ice in the Sea of Okhotsk experienced severe melting. This may have been due to warm air near Fram Strait, which led to melting processes near the ice edge, or caused the ice edge to retreat through related dynamic changes. In comparison: from 21 to 28 February, the temperatures measured on Svalbard were ca. 9° C above the long-term average for 1994 – 2005. Since early March the sea-ice extent has been back at its previous level, and we expect to see the maximum sea-ice extent in the Arctic sometime in the next two weeks, before the melting season begins at the end of the month.
Contacts
Questions?
Contact us via E-Mail or our contact form.
Graphics


