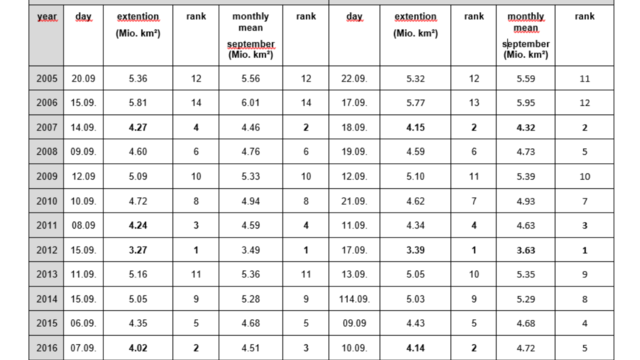
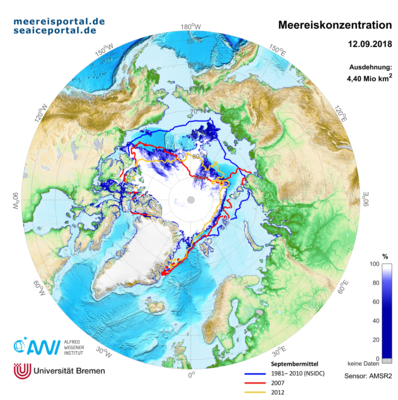
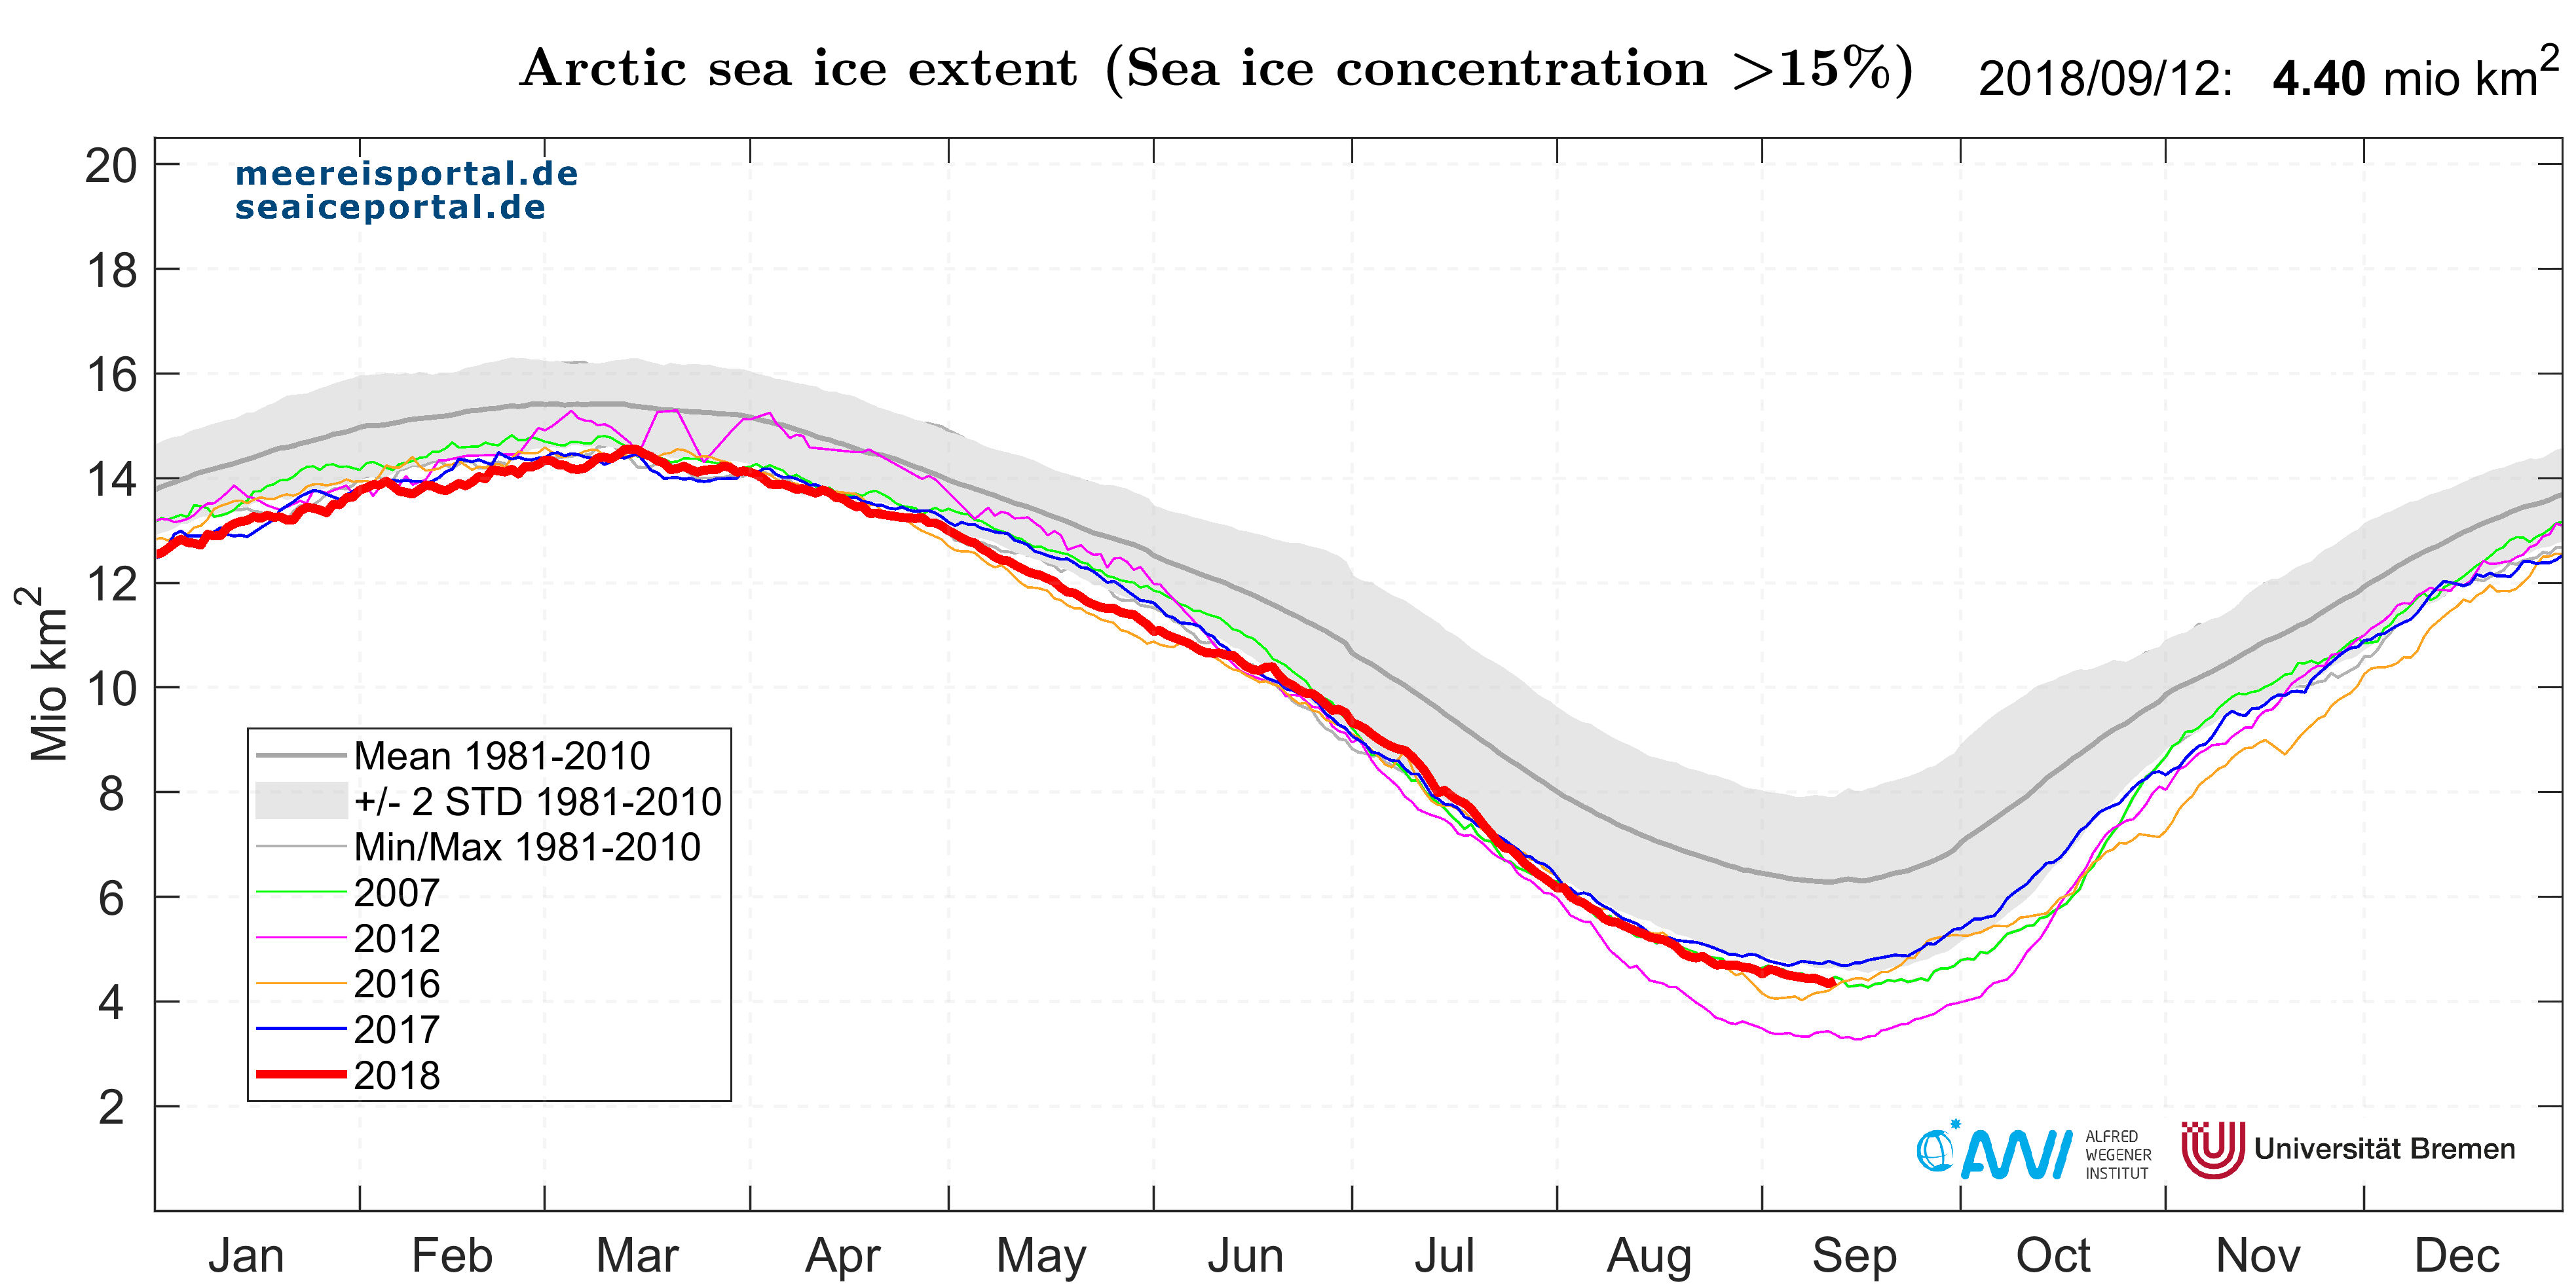
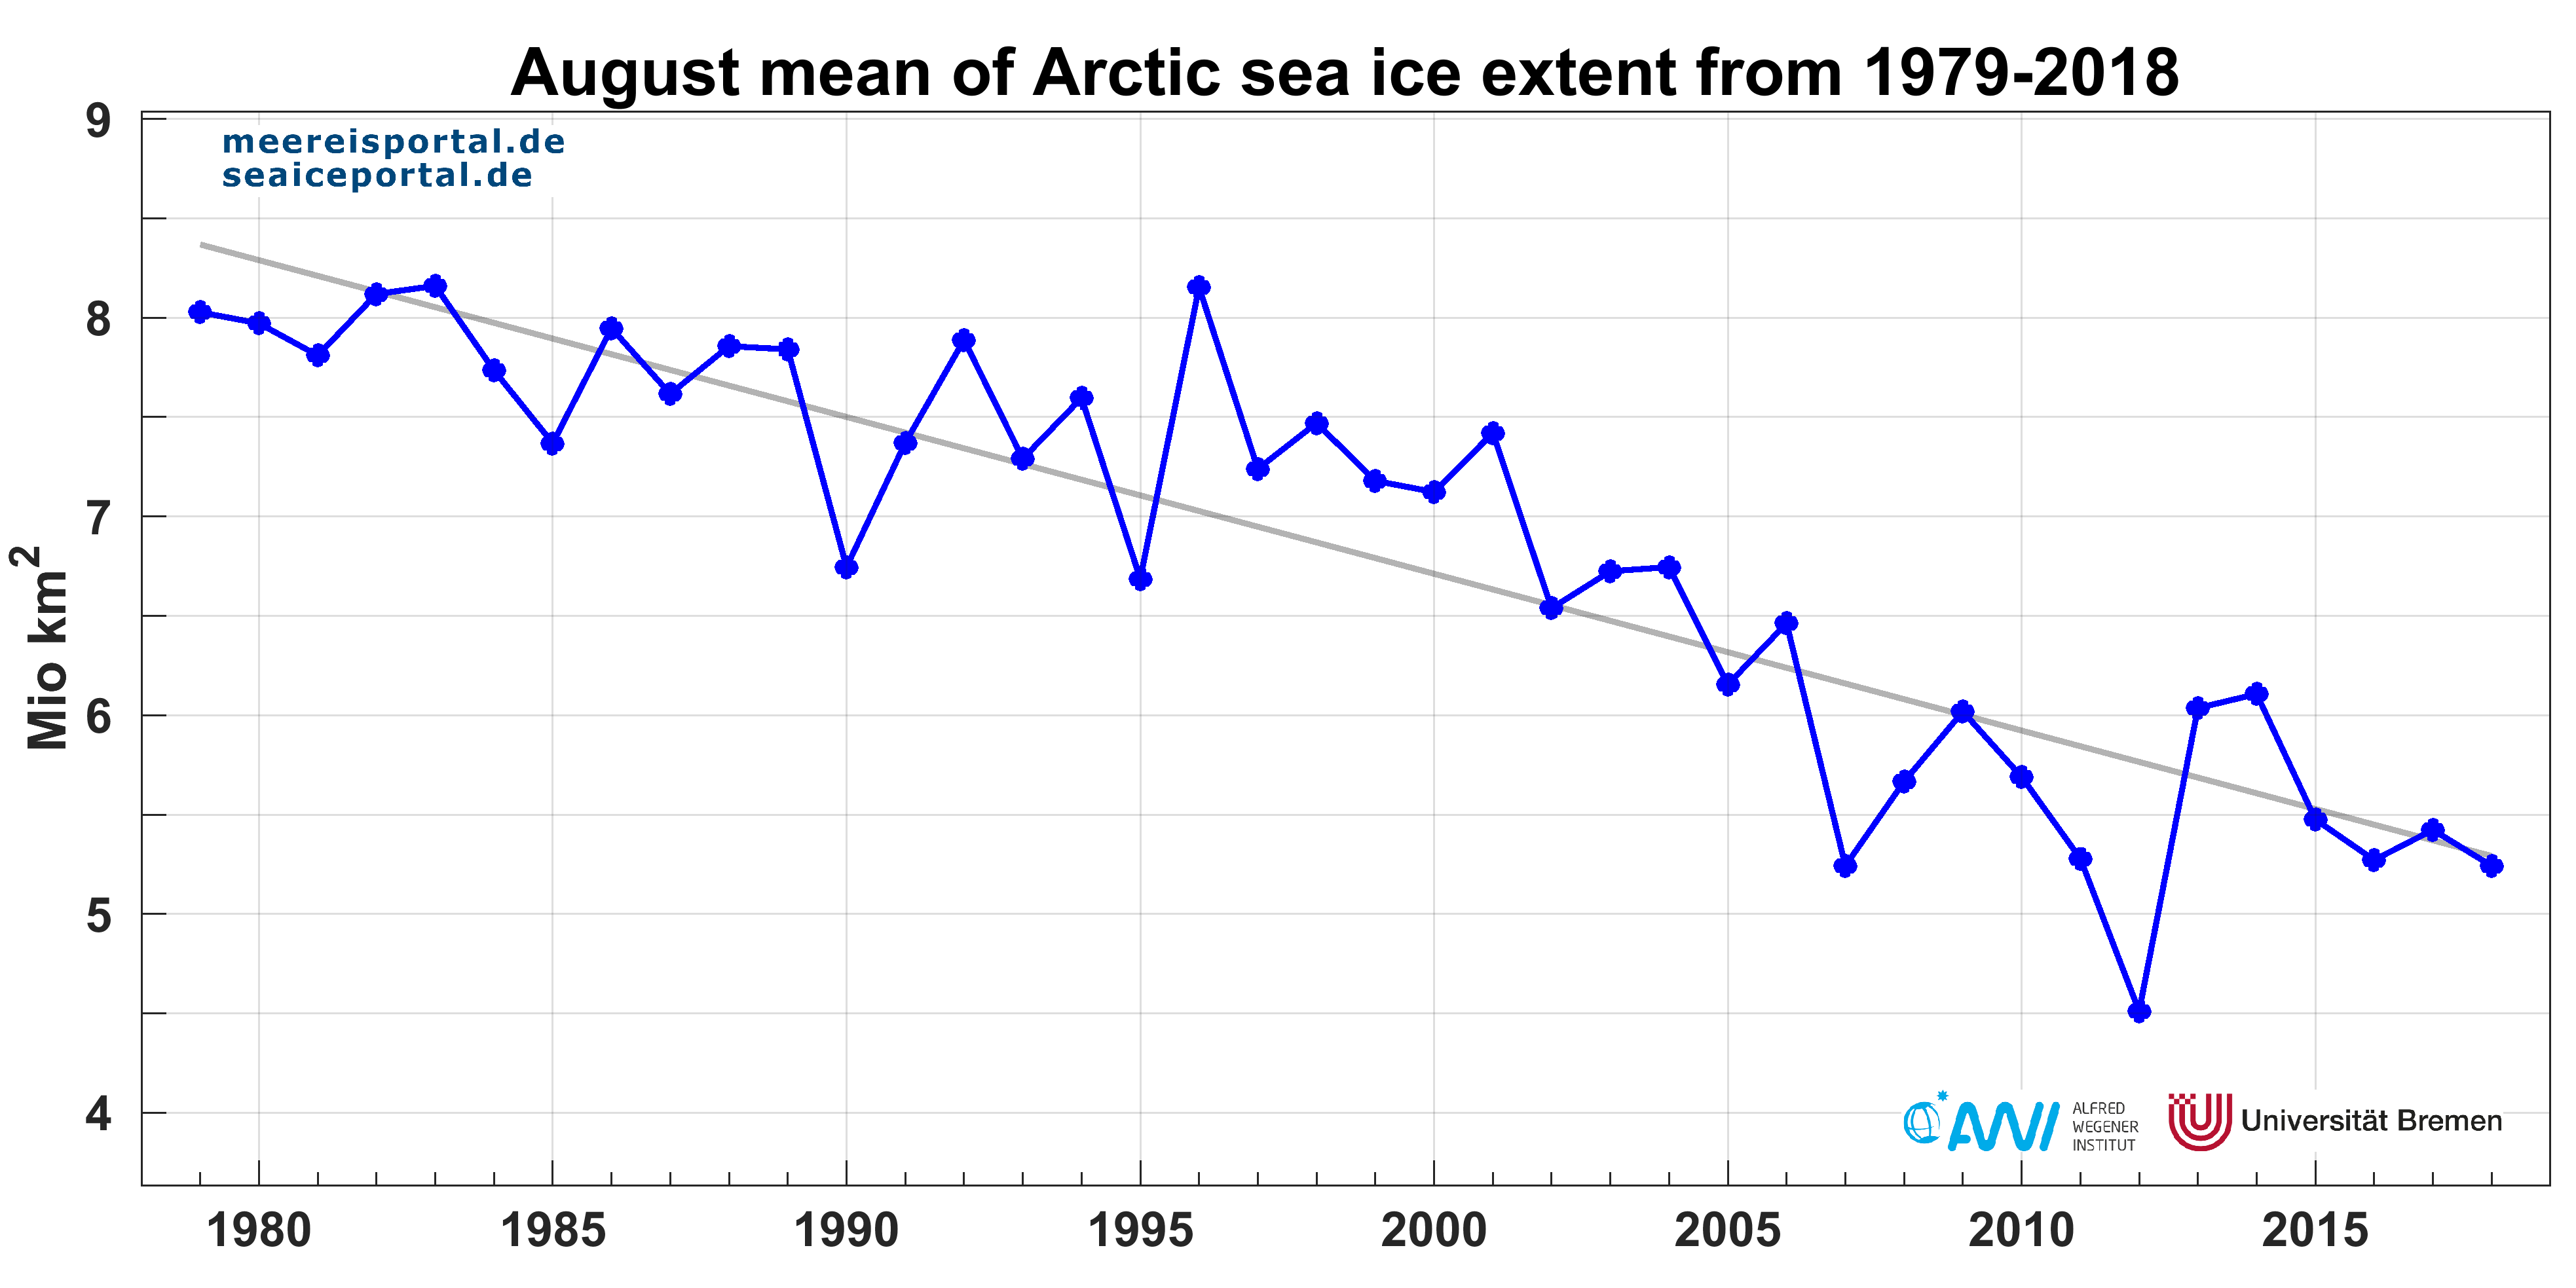
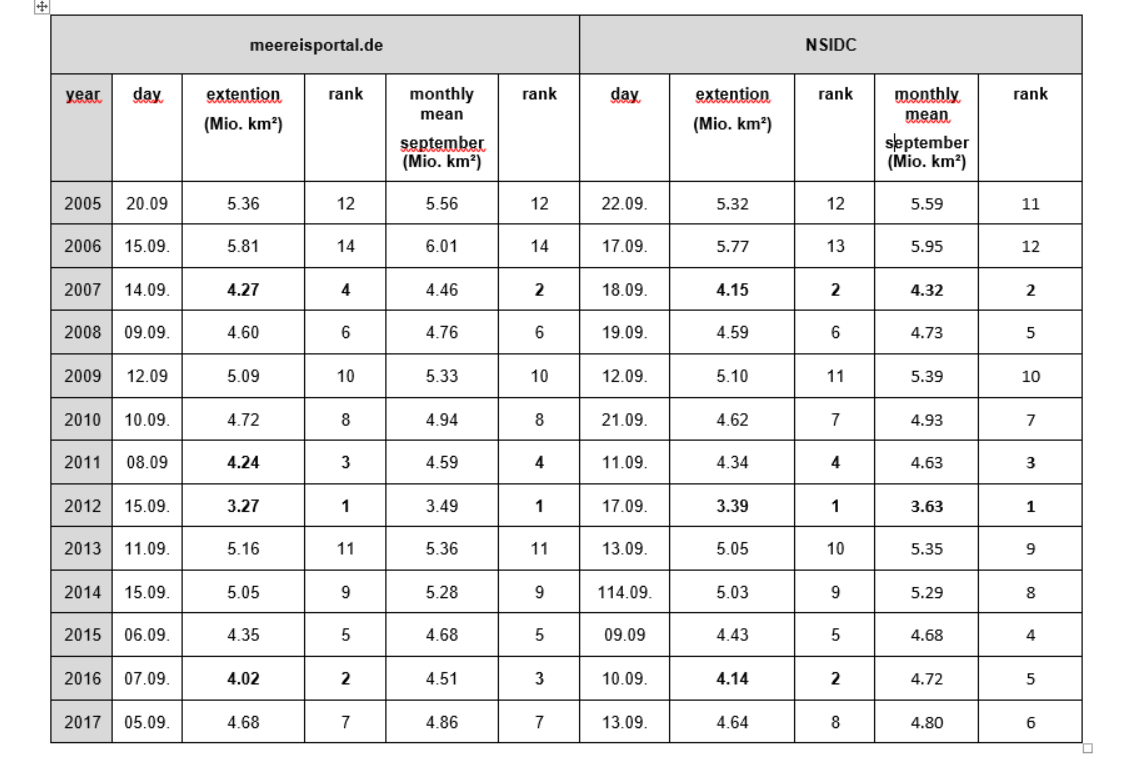
“We are approaching this year’s minimum sea-ice extent in the Arctic, and this summer the ice concentration has descreased to its lowest value since observations started, in 1979,” according to Professor Christian Haas, Head of the Sea Ice Physics Section at the AWI. The absolute minimum will probably be 4,4 ± 0.1 million km2. “Due to uncertainties resulting from the different analysis methods, there can be slight discrepencies between the values from different data centres.” Summer 2018 wasn’t just unusually warm in Europe; it also left its mark in the Arctic, causing significant melting of the sea ice there. The long-term developments in sea-ice extent are currently very similar to those of 2007 (Fig. 1), which saw the fourth-lowest value ever recorded (see Table 1). “The expected 2018 minimum is significantly below the long-term average and also below the double standard deviation range, making the effects of global warming clearly visible,” says Christian Haas, assessing the current sea-ice status. Data on our meereisportal.de website shows a sea-ice extent of ca 4.4 million km² on 12 September (Fig. 2). Other analysis algorithms, such as the National Snow and Ice Data Centre (NSIDC), may deviate slightly from this.
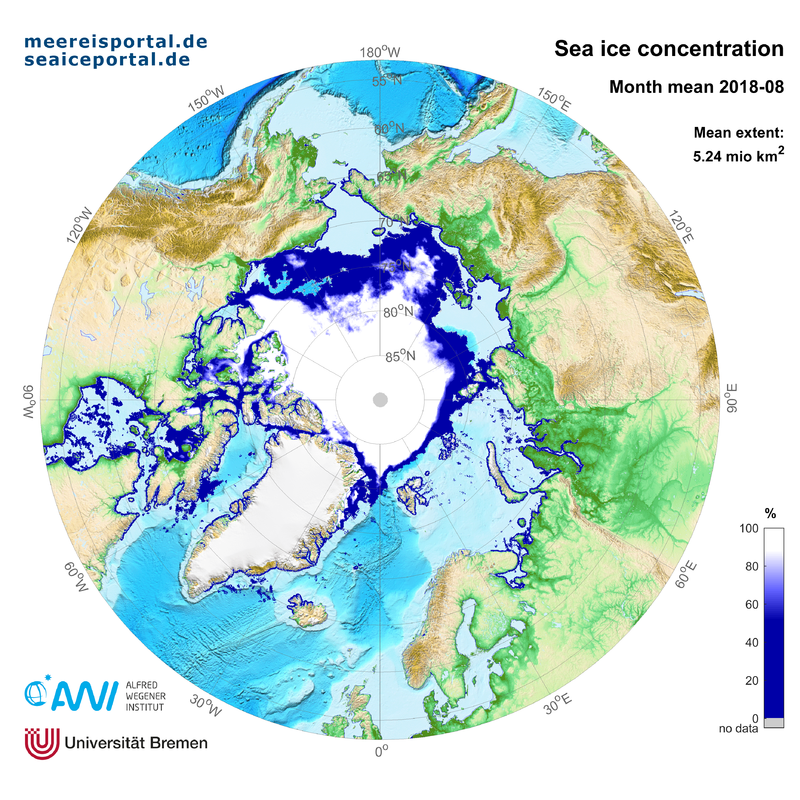
“These minor differences are due to the higher resolution of our data and the slightly different methods that the various data centers use to calculate ice concentration. They show the uncertainties that even the most up-to-date satellite observations of the sea ice can have,” explains Dr Gunnar Spreen from the University of Bremen’s Institute for Environmental Physics (IUP), who is currently on board the research icebreaker RV Polarstern bound for the Laptev Sea. For example, the sensors used on different satellites don’t measure the same wavelength ranges and so have different spatial resolutions. The IUP’s analysis algorithm, for example, uses a very high data resolution of 6.5 km x 6.5 km. In addition, how the coastline is dealt with in the analysis process is also an important factor when it comes to calculating the sea-ice extent, since satellite data also includes the land mass (known as the retrieval algorithm: more information here in a Nature Correspondence Article). In August 2018, the average Arctic sea-ice extent was 5.24 million km² (see Fig. 3). This value is 1.9 million km² lower than the average for the years 1981 to 2010, and 731,128 km ² (about 16 %) higher than the all-time low sea-ice extent in August 2012 (see Fig. 4). In September the sea-ice extent is similar to the daily values in 2007, when the absolute minimum in Spetember reached a value of 4.27 million square kilometres. “We were prepared for a long journey through the ice,” reports Gunnar Spreen from the RV Polarstern, adding, “There has only been this little ice north of the Northeast Passage in 5 % of the summers between 1979 and 2016.”
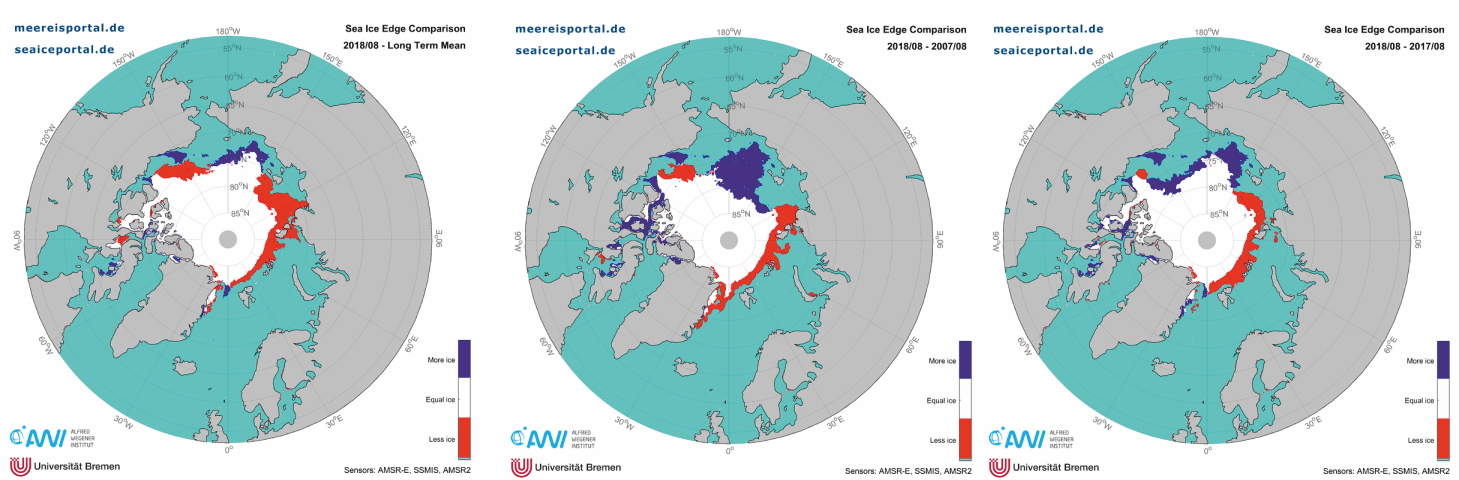
Less ice in the Laptev Sea, more in Canada’s Beaufort Sea compared to last year
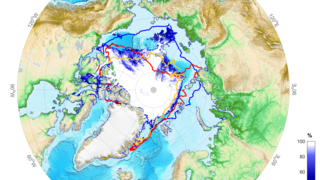
Early in the year it was already clear that the 2018 melting season was exceptional. Warm air inflows in the spring prevented much ice forming in the Barent Sea east of Svalbard or in the Bering Sea, which led to the lowest-ever observed February sea-ice extent in the Arctic (read more here). The spring was also marked by warm air carried in from the Atlantic, which increased the ice retreat, particularly in the Barents and Kara Seas up to the Laptev Sea (Fig.5).
The ice extent in the central Beaufort Sea is also lower than the long-term average and is comparable to that of 2007. In contrast, in Canada’s Beaufort Sea, the Canadian Arctic Archipelago to the east and in the Northwest Passage there is more ice at the end of summer than in previous years (Fig. 5 right). This is due to a lasting high-pressure area driving the Beaufort Gyre’s surface currents, which in the previous months caused thick, several-year-old ice from the north to be transported to the Beaufort Sea. At the same time, in August the air over the Canadian Arctic Archipelago was up to four degrees warmer than the long-term average for the month, which meant that less ice melted in this region (Figure 7). It is only in the East Siberian Sea that the sea ice has not decreased compared to previous years or to the long-term average, and this can hinder the passage of container and freight ships as well as cruise ships between the North Atlantic and North Pacific via the Northeast Passage (also see article on forecasting navigability). This is closely linked to a marked, highly stationary low pressure system over the central Arctic, which has an isolating effect on the warm air masses flowing in and so prevents the ice floes in the region melting (Fig. 8, right). Despite increasing warming, it is not possible to reliably forecast the ice distribution in the region. “The sea ice condition in the Arctic varies significantly from place to place, and shows once again that we are as yet unable to make predictions about the local ice condition on the basis of Arctic-wide developments. There are still areas that are inaccessible, even for icebreakers. And somewhere with little sea-ice this year can have significantly more next year, even though overall there is much less sea ice in the Arctic than there was 20 years ago,” says Christian Haas.
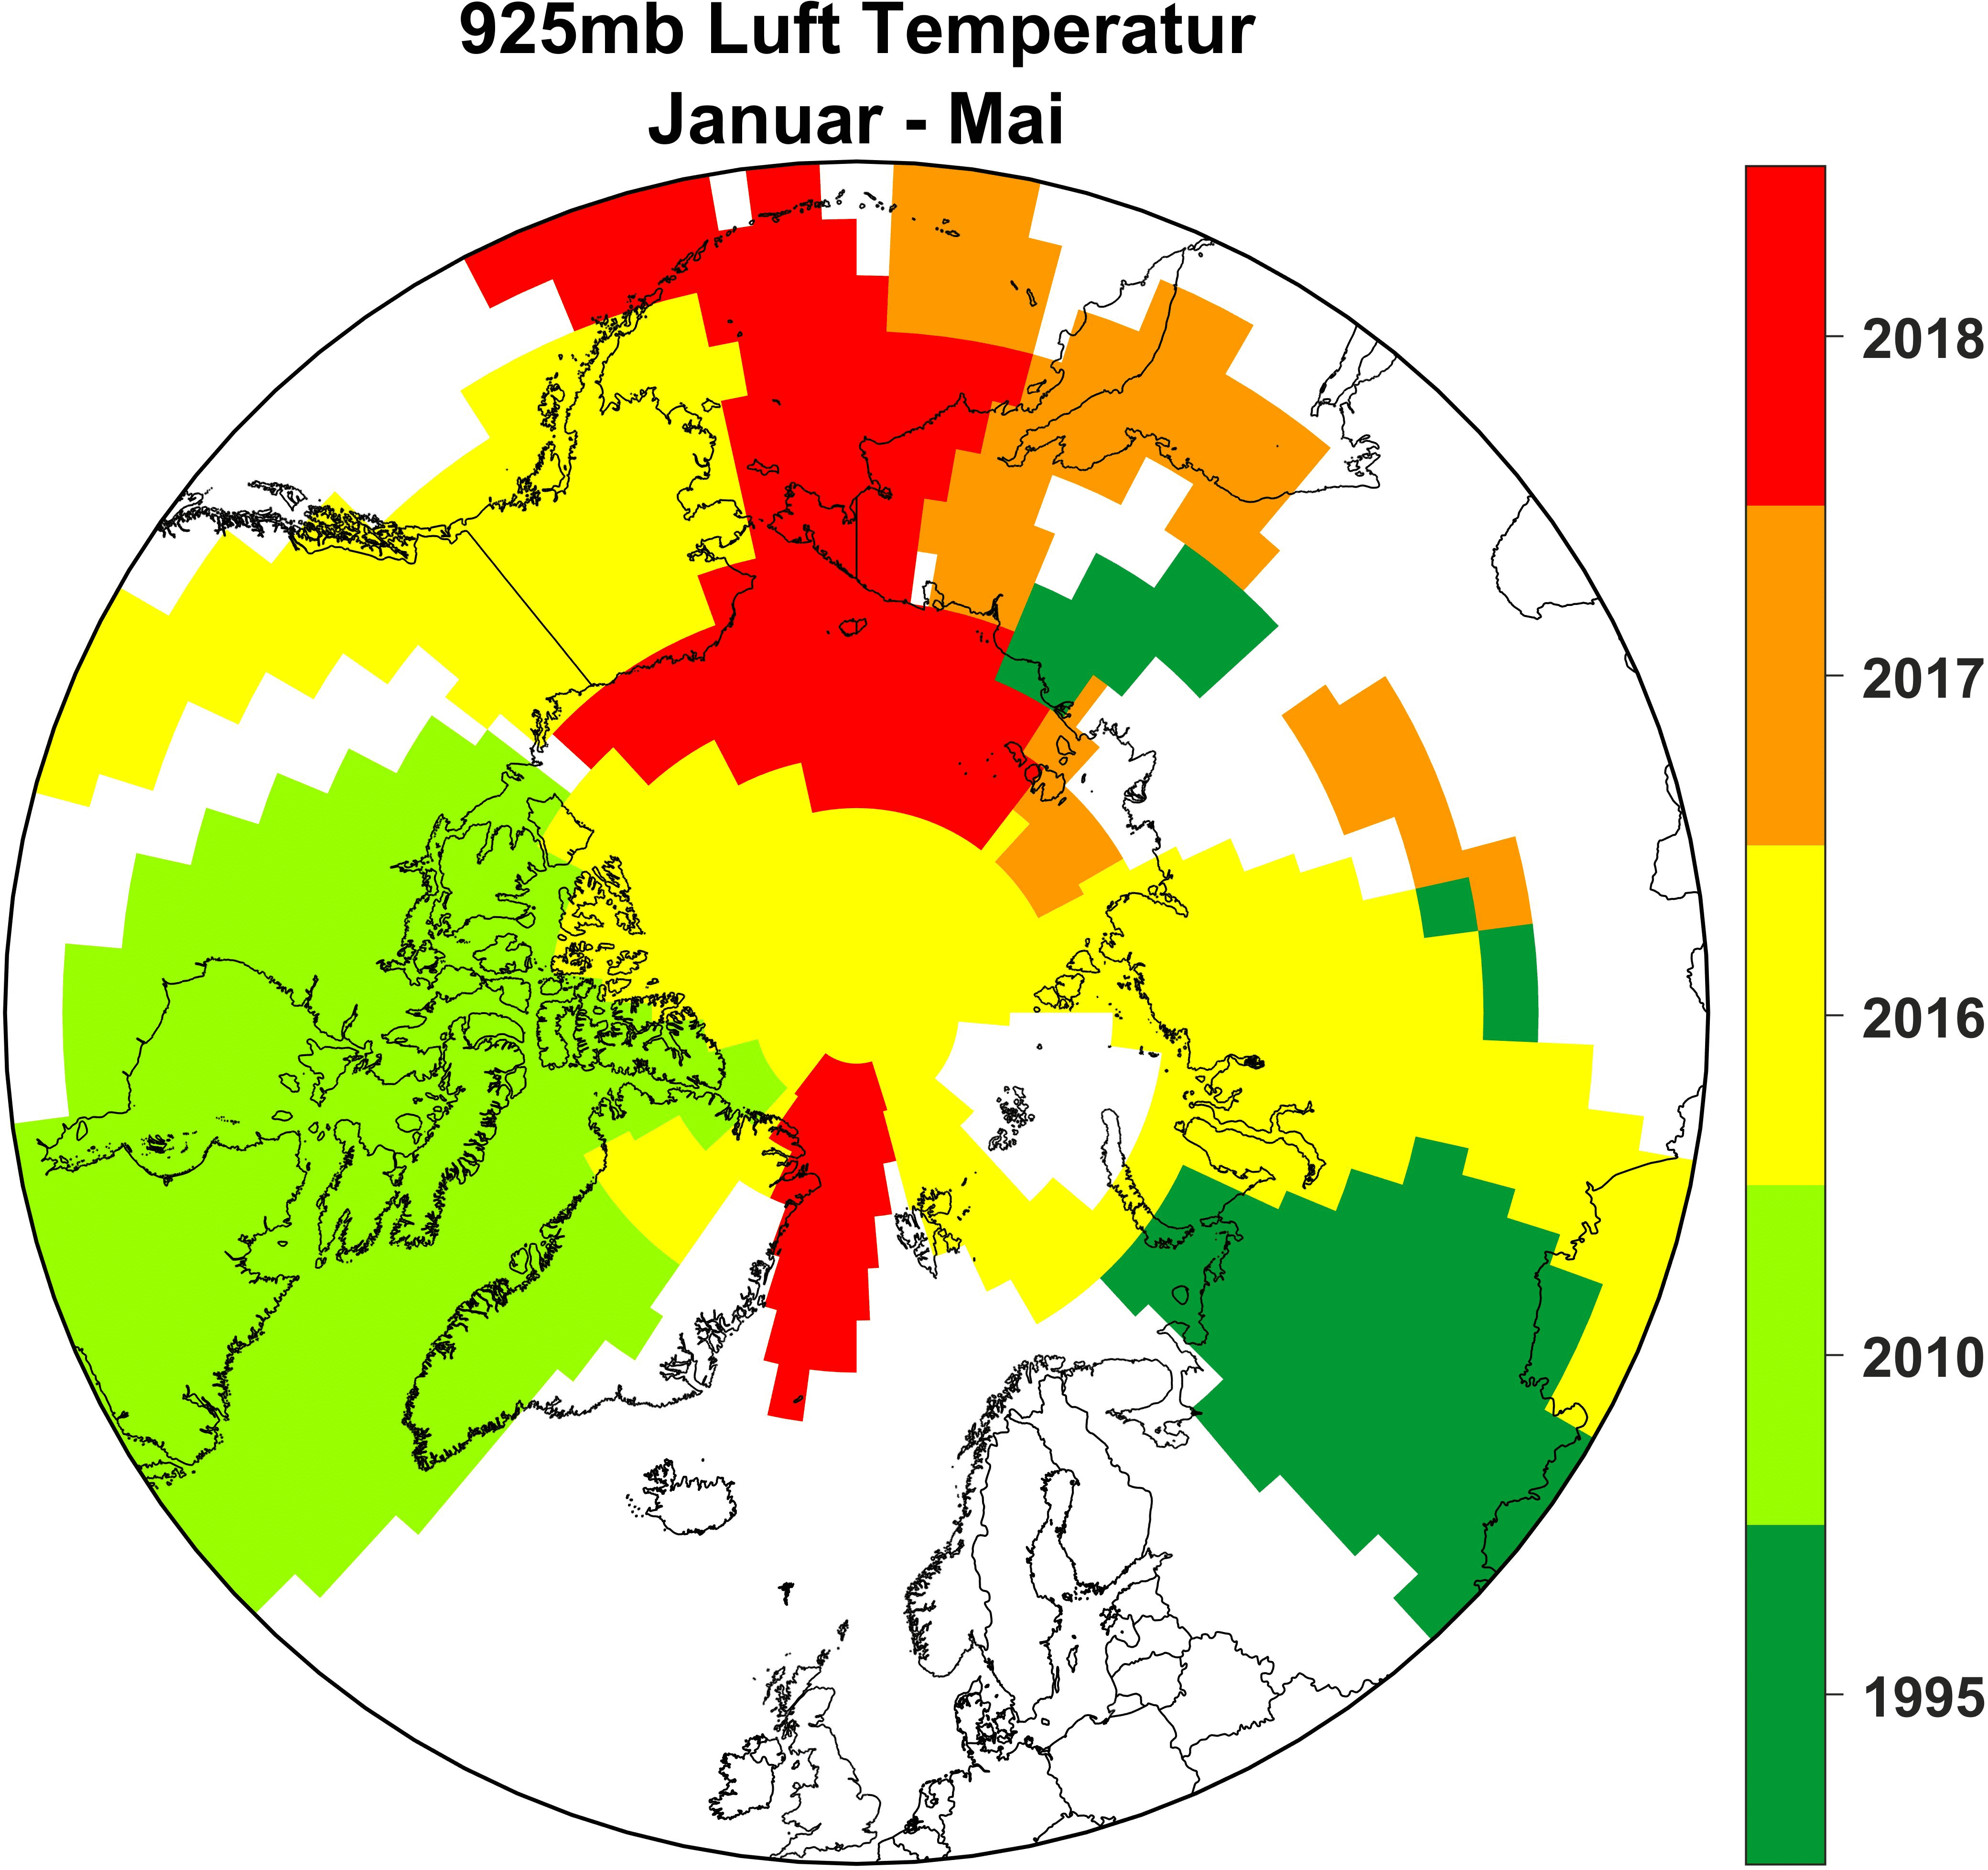
Atmospheric conditions 2018
For years, the area of sea ice in the Arctic has shrunk significantly more than predicted by climate models. Changes in sea ice are closely llinked to interactions between the atmosphere and the ocean. The development of summer sea ice is also dependant on the conditions in the previous winter. Winter 2017 / 2018 was marked by warm Arctic temperatures, poor sea-ice conditions, and record-breaking disruption of the polar vortex. There were also extreme cold and huge snow falls in the USA and Europe (more here). For example, the air temperature over the Arctic Ocean in November and December was significantly above the long-term average, with particularly warm areas (more than 6°C above the mean value for 1981 to 2010) over the Chukchi Sea and north of Svalbard. These conditions continued in January and February and many areas of the Arctic remained warmer than the long-term average.
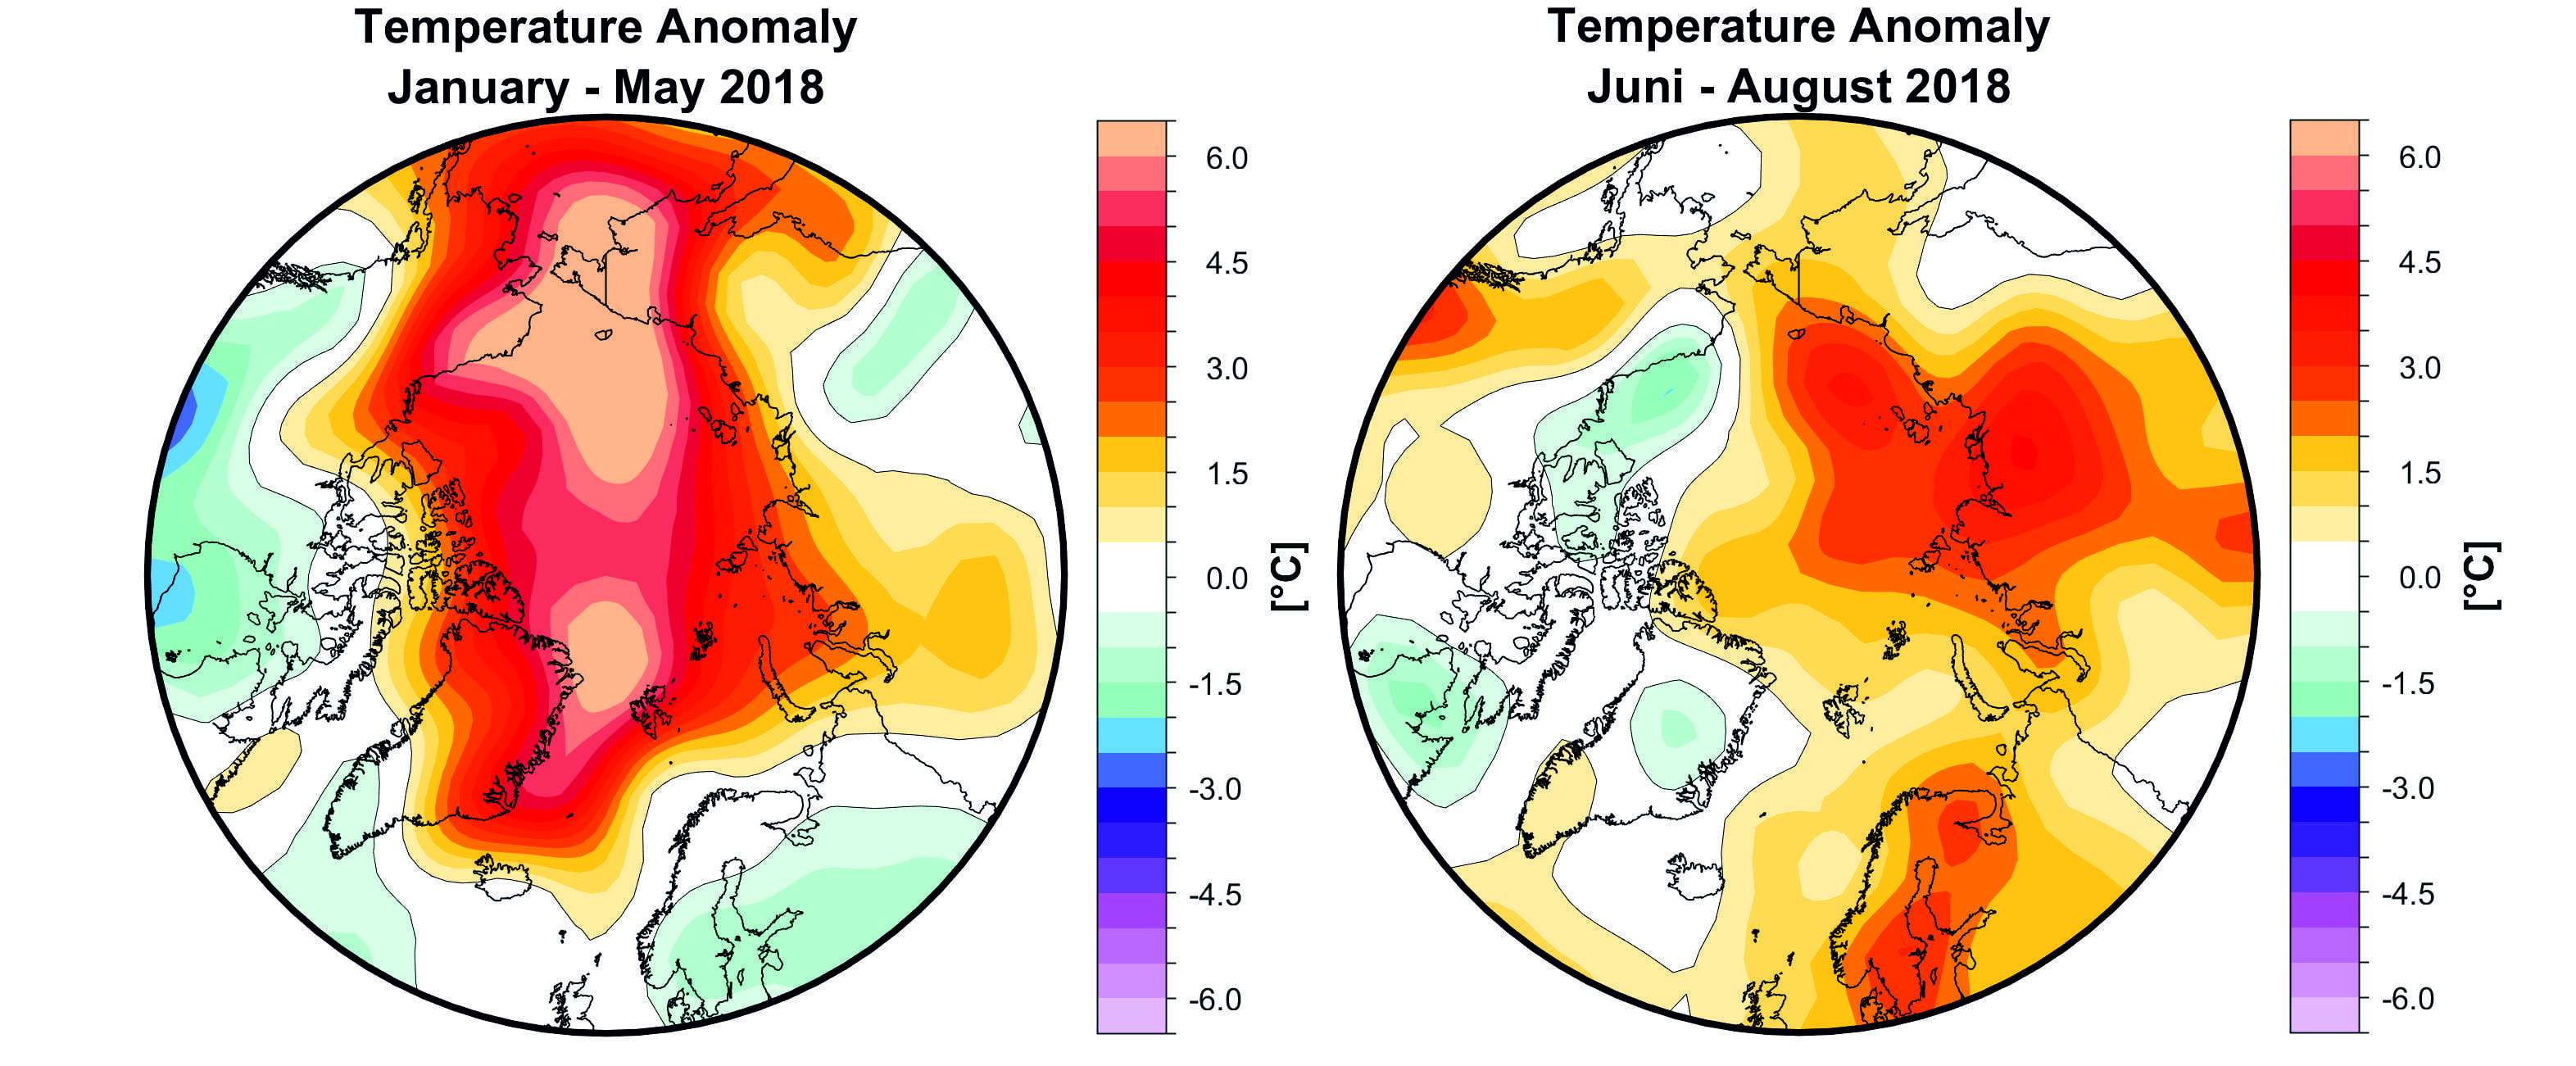
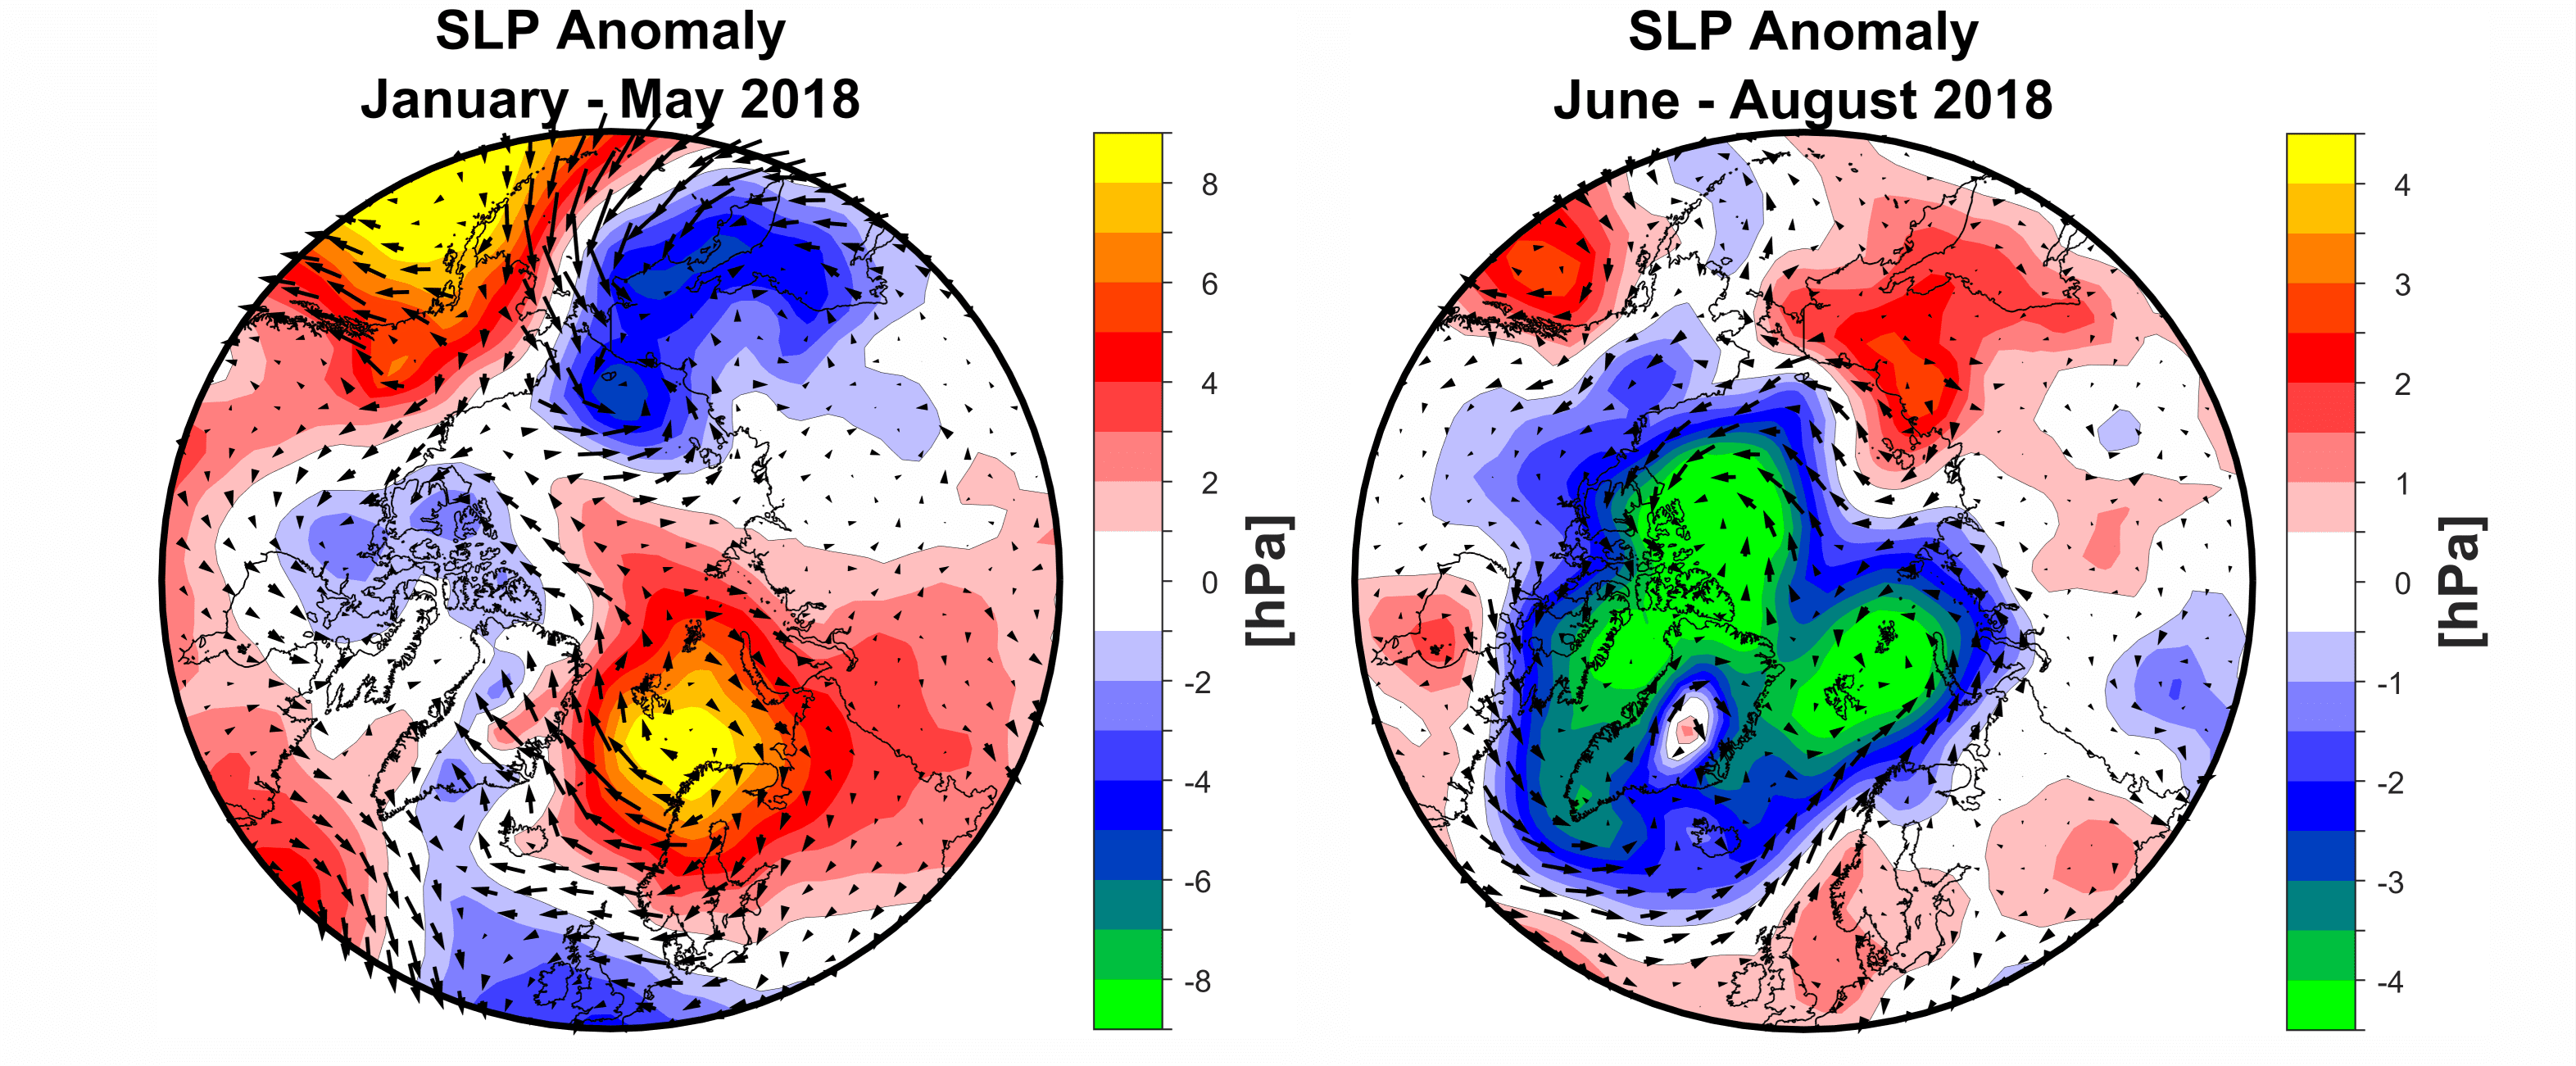
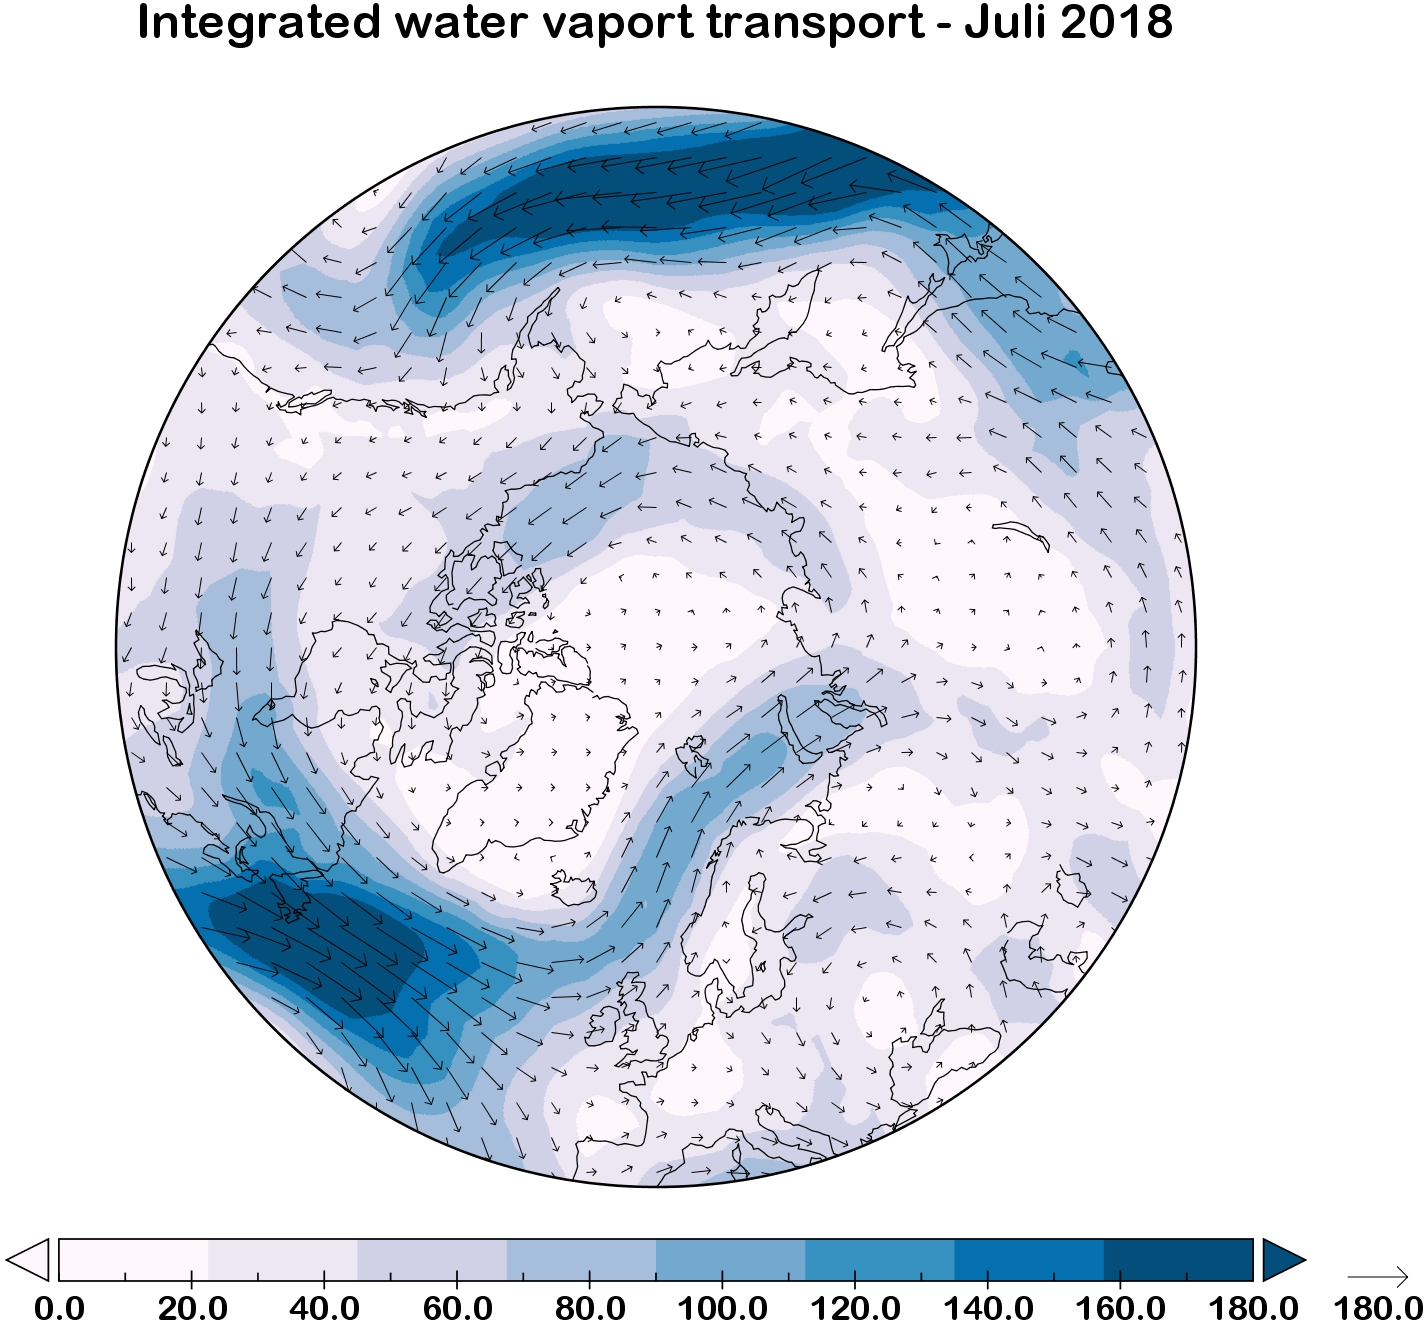
The second half of February was marked by extreme weather conditions, with particularly warm temperatures over the Arctic and exceptionally low temperatures over Eurasia and North America. This situation lasted into April, with temperatures in the East Siberian Sea up to 10 °C higher than the long-term average for that month. The air temperatures in the east Greenland Sea were up to 5 °C and in Baffin Bay 3 °C higher than the long-term average. In the summer, the Arctic, particularly in the East Siberian Sea continued to be warmer than the long-term average, although in other parts of the Arctic, the temperatures were within the normal range. January to May 2018 are so far the warmest months in the Chukchi Sea and Bering Street (see figure 6). Figures 7 and 8 show a summary of the atmospheric condition in the Arctic for the period January to August 2018.
Atmospheric circulation in the Arctic in summer 2018
The conditions in the Arctic in summer 2018 are closely linked to the extreme heat and drought in Germany this summer. This was caused by what is known as atmospheric blocking, a stable high over Scandinavia that forces Atlantic low-pressure systems towards the north or south, repeatedly driving warm and dry air towards the western part of Europe. Climate models of future scenarios show that climate change can increase the likelihood of such weather conditions. Warming at the northern latitudes leads to dwindling snow and ice in the Arctic, which because of its white colour reflects a large part of the sun’s radiation. If there is less ice and snow, the sun shines directly onto the Arctic Ocean and the land, which are darker and so absorb the radiation, causing them to become warmer. Warming in the Arctic increases and progresses much more rapidly than at mid-latitudes (this is known as “Arctic amplification”). This results in the temperature difference between the Arctic and the middle latitudes becoming smaller. However, the contrast in temperature between the Arctic and our mid-latitudes is the driver for the weather in Germany and Europe, as a whole. Low-pressure systems develop to balance out the temperature differences.
The front of a low-pressure area pushes warm air northwards, while the back pushes cold air to the south. If the temperature contrast is lower, the low-pressure system is weaker so that it can be more easily blocked by a strong high-pressure system. What we have observed this summer is a change in the jet stream, a strong band of winds that controls low-pressure areas. The jet stream moves in waves around the globe’s middle latitudes. If a region is in the jet stream’s trough then frequent low-pressure areas occur there; if the area is in a peak, high-pressure influences dominate. “According to forecasts from various climate models, the jet stream will become weaker due to a reduced temperature gradient between the high and mid-latitudes, and the peaks and troughs will move more slowly. Correspondingly, they will alternate less frequently over Europe, so that in the future high pressure areas will remain over the same area for increasing lengths of time periods.”, Dr. Monica Ionita-Scholz climatologist from AWI states out. If, for example, the peak remains over Scandinavia, it keeps the low-pressure area away from us for a longer period – like we experienced this summer.
Ice thickness in the Arctic
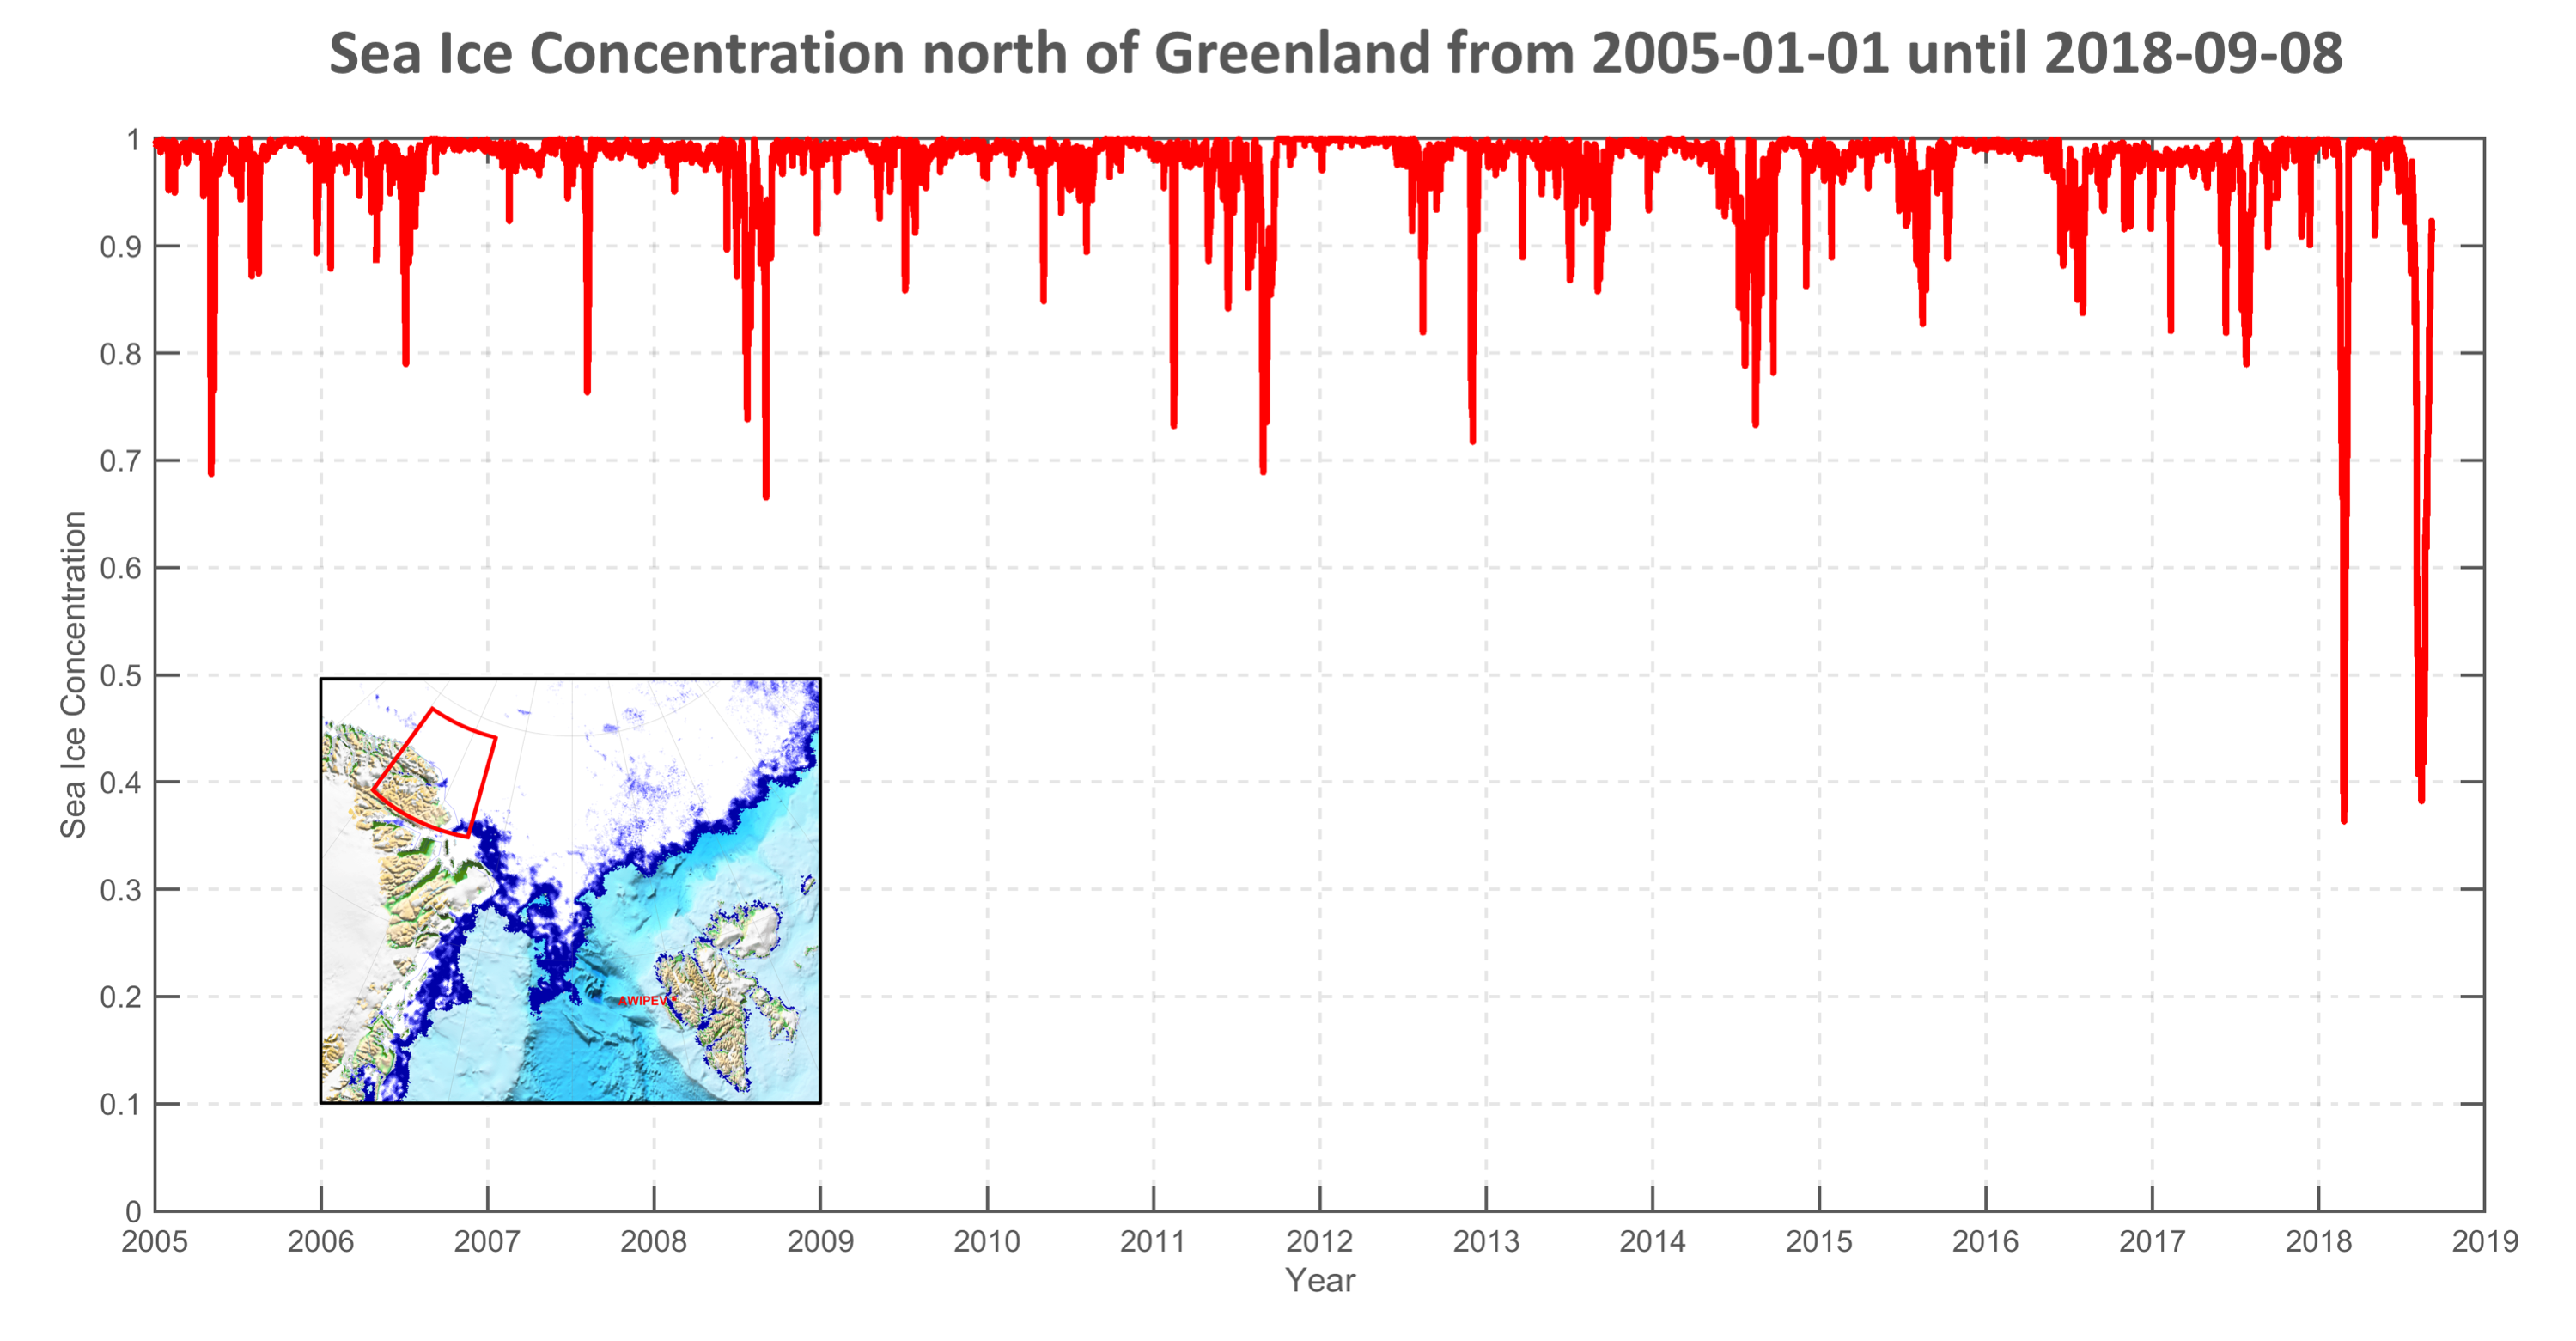
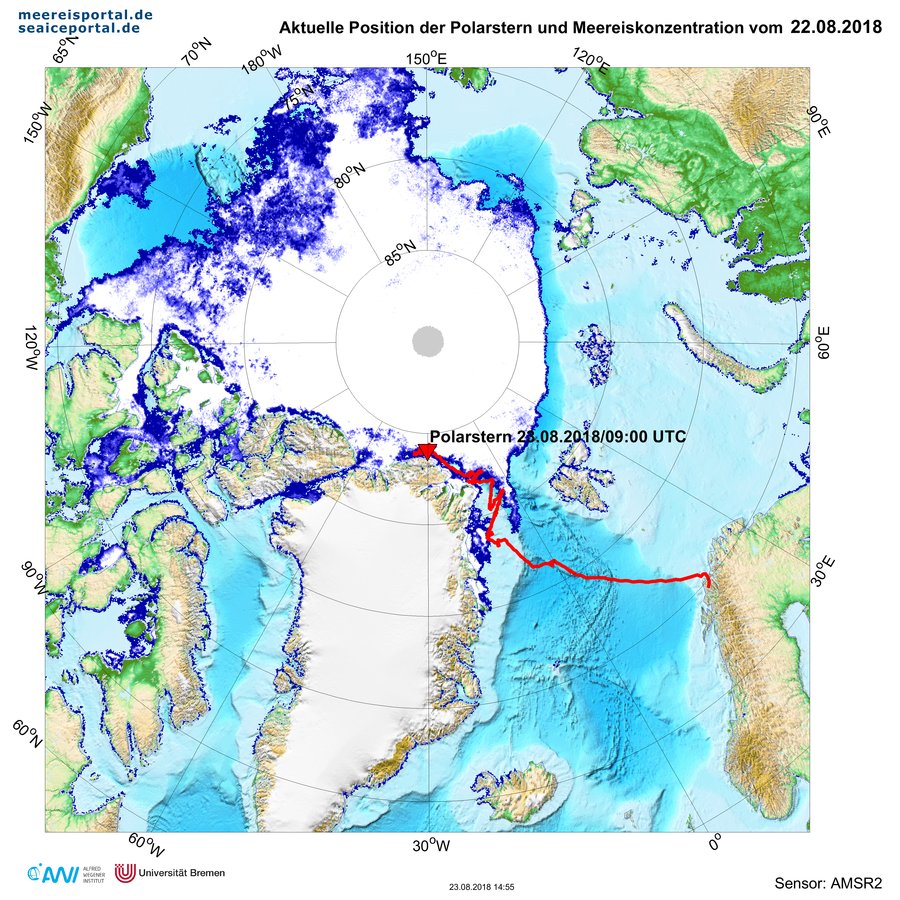
In addition to ice extent, information on the ice’s age and thickness is also important when it comes to assessing the ice cover in the Arctic. Young, relatively thin ice can be more easily driven apart and reduced by summer melting than is the case with thicker, multi-year ice. CryoSat-2 data shows that at the end of the freezing season in April 2018, the average ice thickness of 2.14 m was slightly below the average of 2.19 m in the years 2010-2017, but higher than the lowest values in 2012, 2013 and 2017. It was particularly noticeable that the ice in the East Siberian Sea was significantly thicker than the long-term average, while that north of Greenland and Ellesmere Island was thinner (see illustration in the news article from 22 June 2018). The thickness of the ice in the East Siberian Sea certainly contributed to the survival of the ice in the region in September (Fig. 2). In February and August 2018, large polynyas occurred in the thin-ice region north of Greenland. The polynya in August was over 100 km wide – which is unique in terms of size and extent. The time series in Figure 10 shows that the large decrease in ice concentration in this region in both winter and summer is unprecedented in the observation period since 2005. Although the ice concentration in the period 2005 to 2018 sporadically fell to below 80 % 14 times due to southerly winds, this year it has twice fallen below 40 % – the first time that the value has been so low in the last 13 years. The occurrence of polynyas isn’t unusual, as they are created by land breezes, which drive the ice away from the coast. It is not clear whether the thin ice north of Greenland and Ellesmere Island observed by CryoSat-2 in April contributed to the formation of these prominent temporary polynyas in February and August, since they could also have been created by the particularly strong and persistent southerly winds. The ice-thickness measurements made by the AWI’s aircraft show that the ice in summer was only marginally thinner than in previous years. You can find a detailed report here. The RV Polarstern made use of the more than 100 km wide polynya in August to sail close to the north Greenland Ice Sheet in order to carry out geoscientific investigations (Fig. 11). This year, this was possible for the first time since 1993.
Summary
After the record summer 2018, which was the warmest in Europe and the second warmest in Germany (June, July, August) since 1881, the growing impact of global warming can also be seen in the Arctic. The inflow of warm air- and ocean currents into the Arctic leads to increased sea-ice losses, with serious consequences for the Arctic climate system. The Arctic is now warming at a rate more than twice the global average, which has consequences for the climate and ecosystem, and also for the people living there. If this process continues to accelerate, which is to be expected given the global climate protection efforts to date, this trend will continue. “The latest findings confirm the worrying decline in Arctic sea ice, a trend that we have been observing for more than a decade,” explains Christian Haas, summing up the situation in the Arctic this summer.
Contacts
- Prof Dr Christian Haas (AWI)
- Dr Monica Ionita-Scholz (AWI)
- Dr Renate Treffeisen (AWI)
- Dr Klaus Grosfeld (AWI)
- Lorenzo Zampieri
Questions?
Contact us via E-Mail or our contact form.
Graphics


