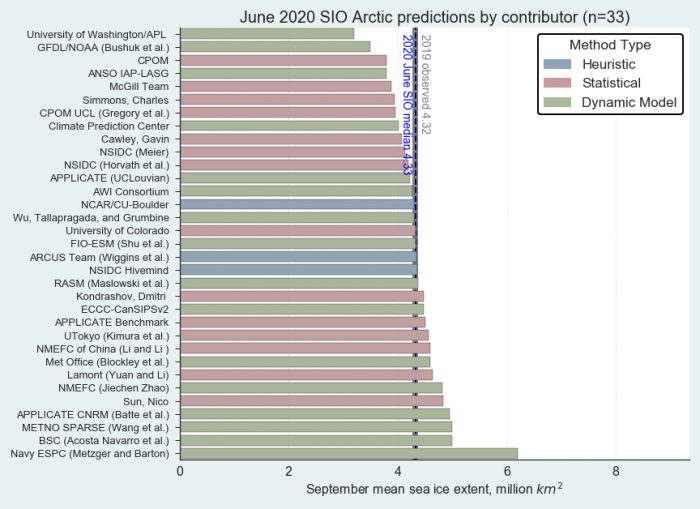
In the months of June, July and August, predictions can be submitted on the September sea-ice extent for the Arctic as a whole, or for specific regions. The forecasting methods vary considerably, and include numerical modelling, heuristic methods and statistical methods, as well as combined approaches. You can find an overview of the Sea Ice Outlook (SIO) here. The AWI has taken part for the past several years; based on numerical modelling, its forecast calls for a sea-ice extent of 4.27 ± 0.38 million km² in September 2020. Taking a margin of error into account, this value would be fairly similar to the actually observed extent in the years 2007 and 2019, which would place it among the three lowest ice extents ever observed (2012: 3.57 million km²; 2007: 4.27 million km²; 2019: 4.32 million km²). The June outlook for September 2020, based on all 33 forecasts submitted, calls for an extent of 4.33 million km², with quartiles of 4.06 and 4.59 million km² (Fig. 1). Generally speaking, this year’s forecast is very similar to that from June 2019 (4.40 million km²) and to the actually observed extent in September 2019 (4.32 million km²). For September 2020, only two of the predictions submitted call for an extent below the all-time historical low; the consensus is that there most likely won’t be a new record low sea-ice extent in September. You can find a detailed description of the SIO for June 2020 here.
Sea-ice forecast for the MOSAiC region: will there still be enough ice in autumn 2020?
The system used for the MOSAiC forecasts at the AWI is similar to that used for predicting the September minimum, but there are several important differences. Both systems start with an analysis of the sea-ice conditions in March and April, which is produced by ‘fusing’ observational data and model simulations (‘data assimilation’). The data used includes satellite-based observations of daily ice concentrations and ocean surface temperature (both from the Ocean and Sea Ice Satellite Application Facility (OSI SAF)); of daily snow thickness (from the University of Bremen); and, most importantly, of the monthly mean ice thickness (CS2 / CS2SMOS from the AWI). The model is then integrated with atmospheric forcing data from a weather model (NCEP-CFSv2) up to the starting time for the forecast (for this MOSAiC study: 3 June 2020) and subsequently calculated through the end of October using forcing data from the past ten years (for the 2020 forecast: from 3 June to the end of October for the years 2010 to 2019). This yields an ensemble of ten scenarios, which describe potential developments of the sea-ice conditions.
The system used for the MOSAiC forecasts differs from the September minimum system in that a) no bias correction is used, and b) a higher model resolution is used. The parameters in the numerical model for the previous system were not optimally calibrated, as a result of which, in comparison to actual observations, it predicted too much sea ice melting in the summer. When the actually observed ice thicknesses in March and April were assimilated, it became clear that the model did not predict enough ice cover in the summer. A bias correction of the observed ice thicknesses can compensate for this effect. Calibrating numerical models is a lengthy and complicated process. However, the numerical model used at the AWI was substantially improved with the help of a genetic algorithm (Sumata et al. 2019 a and b), which made a bias correction superfluous. Consequently, the system can now not only be used for September forecasts, but also for other purposes. Since the optimised parameters are largely scale-independent, the model’s resolution was also improved, allowing it to depict the Arctic at a grid scale of 25 km. The assimilation system remained unaffected by these changes.
Results
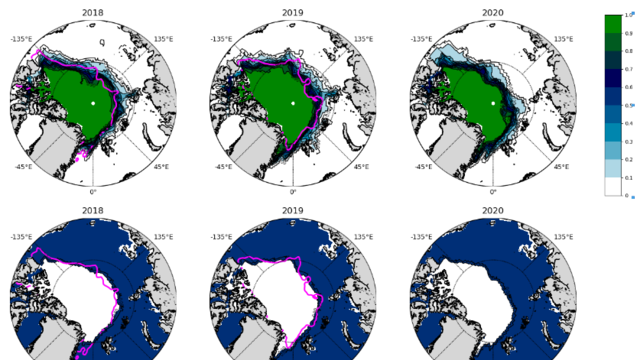
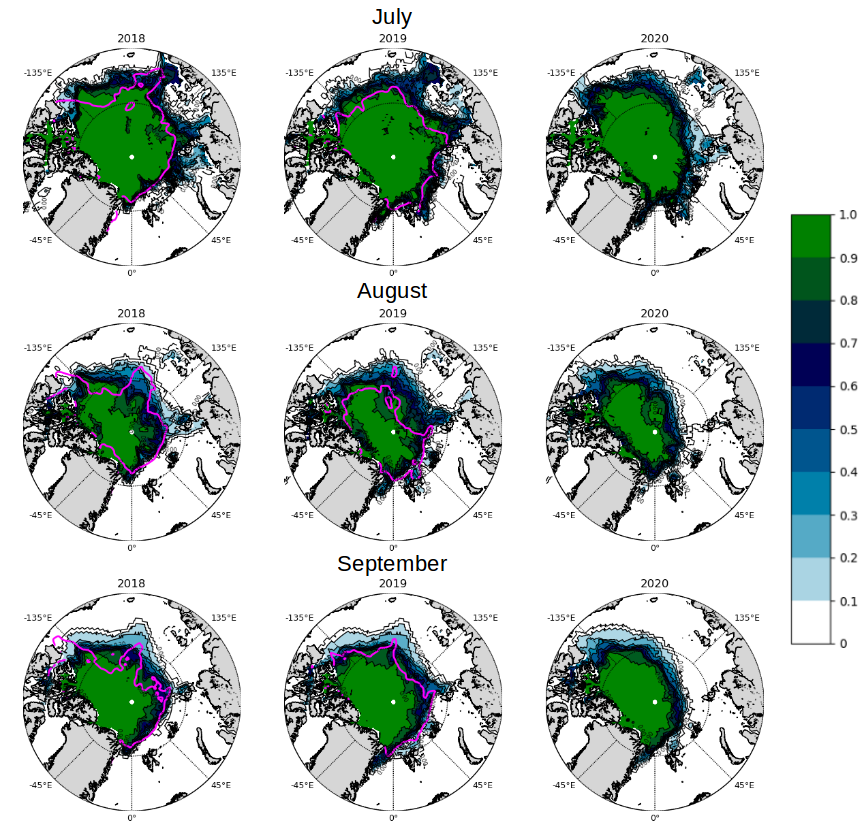
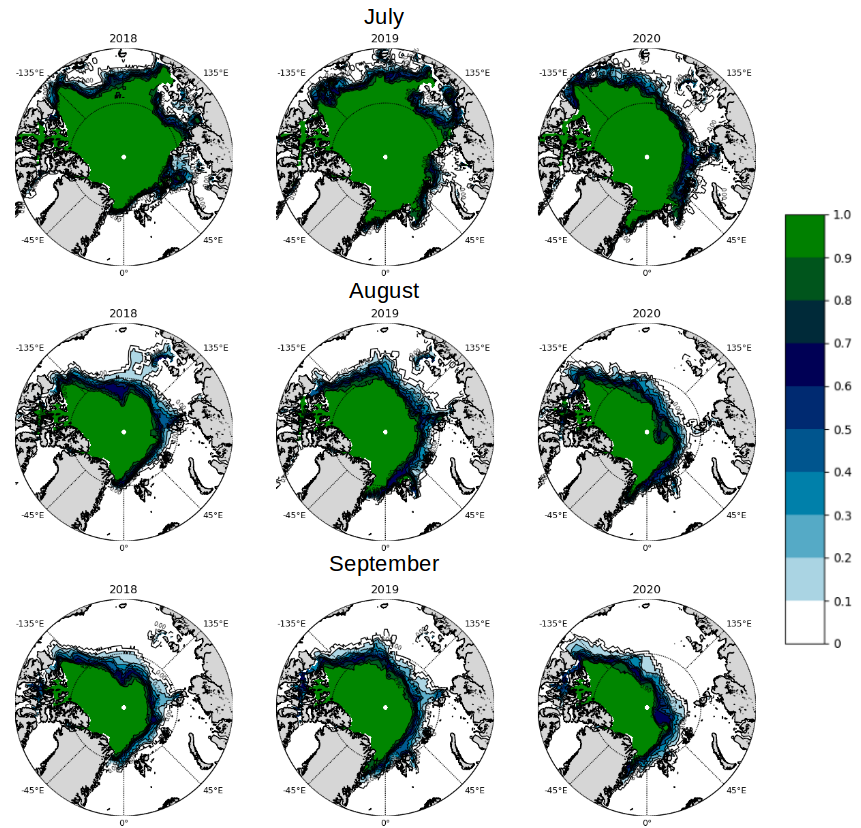
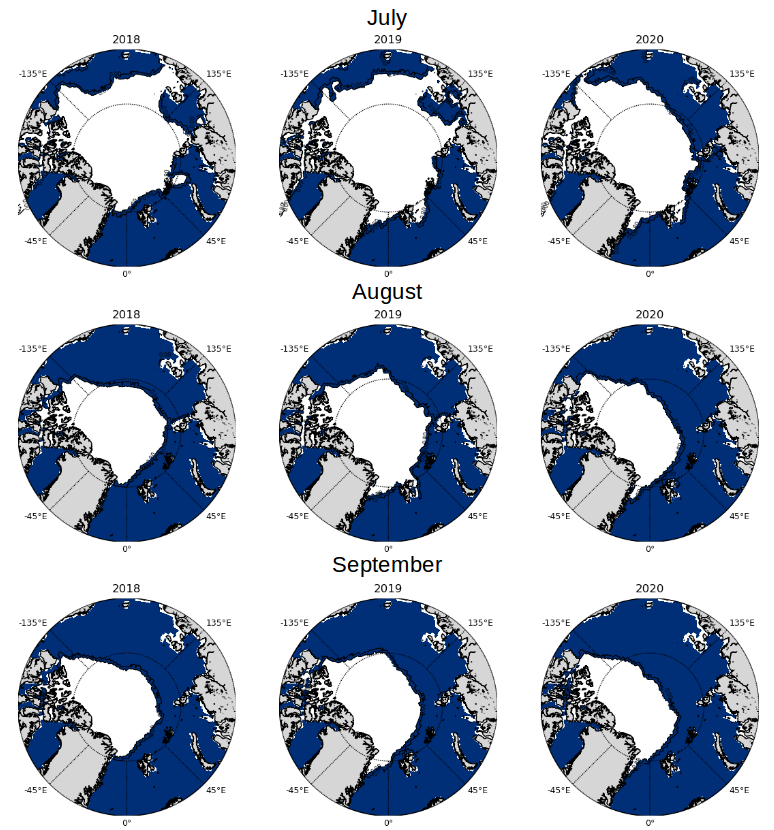
In addition, in collaboration with colleagues from the AWI’s Sea Ice Physics working group, who provided field observations, suitable metrics for the MOSAiC forecast were established. These metrics define regions with a) more than 80 % ice cover and b) an effective ice thickness of more than 1 m in the ice-covered cells. Figure 2 shows the likelihood (0-1) of encountering an ice concentration of 80 % or higher in July, August and September 2020 (right column), while Figure 3 shows the likelihood of encountering an ice thickness of more than 1 m in the same month (right column). In addition to the likelihood shown in Figures 2 and 3, the ensemble mean predictions for an ice concentration of 80% or higher and of an ice thickness of 1 m or greater are displayed in Figures 4 and 5, respectively. While the probabilistic representations in Figures 2 and 4 display the variability within the ensemble (a value of one means that all ensemble members show at least one ice concentration of 80% or at least one effective ice thickness of 1 m), the presentation of the ensemble mean in Figure 4 allows a better comparison with the observed 80% ice concentration or, in Figure 6 (bottom panel), the observed 1 m effective ice thickness.
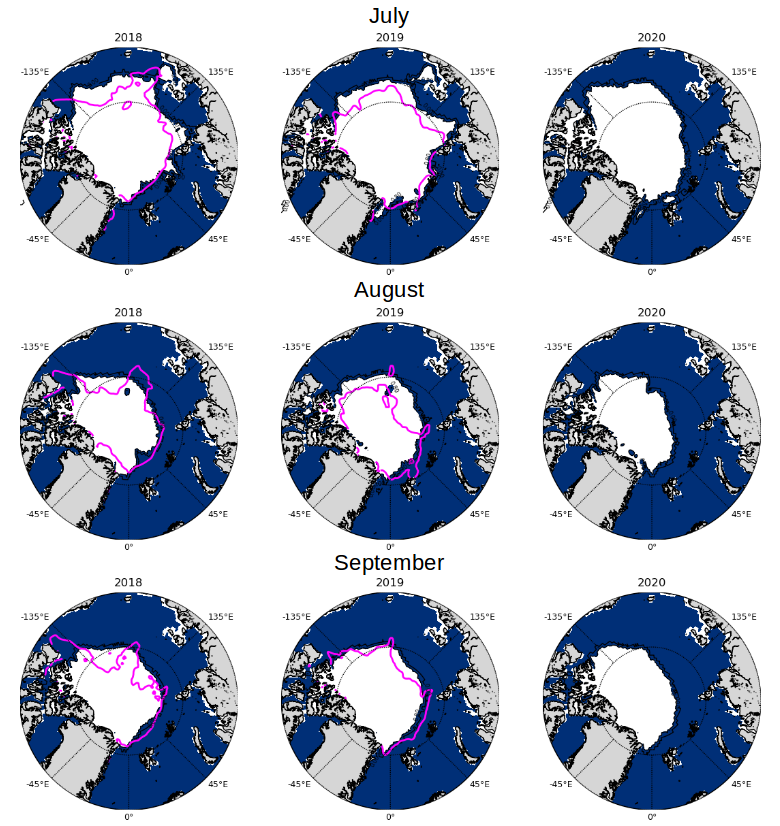
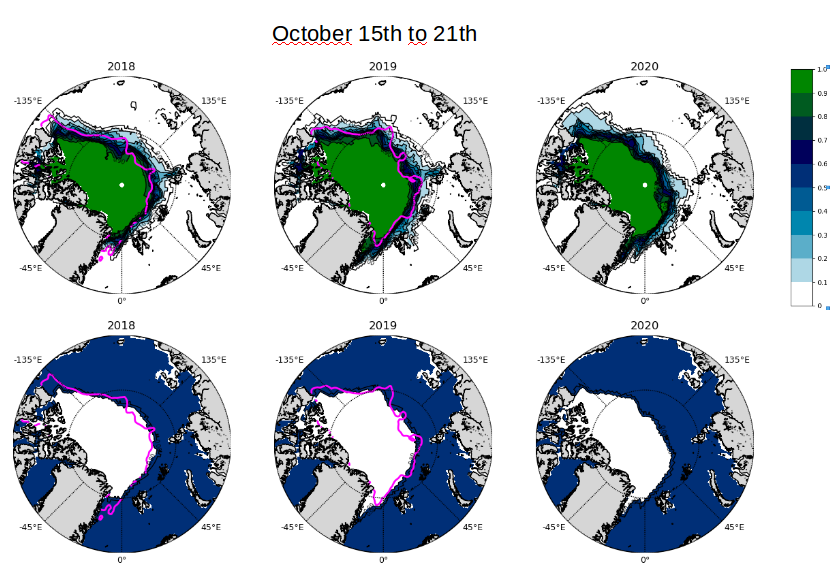
Needless to say, a forecast isn’t particularly useful without being validated by observational data. The system can be validated by retroactively forecasting previous years. Principally speaking, this can be done starting in 2011, since it was the first year with ice-thickness observations. To date, however, only 2018 and 2019 have been retroactively forecasted and are displayed in Figure 2 for ice concentrations of 80 % or higher together with the observed 80% isoline from OSI SAF (left and middle columns). Due to the lack of observations, the ice thickness forecasts in July to September cannot be validated. Instead Figure 6 shows a validation for the first week in October where observations are available (15 to 21 October from CS2SMOS).
While for the forecasts of the sea-ice extent in September (15% ice concentration) substantial experience has been gathered over the last decade in connection with the SIO, predictions of the 80% ice concentration and 1 m ice thickness conditions are experimental and should be used with caution.
For all three months (July, August and September) the likelihood (Figure 2) and the ensemble mean (Figure 4) show some overestimation of the 80% isoline in the years 2018 and 2019 for the Beaufort Sea and north of the Laptev Sea, while the 80% isoline is relatively well forecasted between Svalbard and Franz Joseph Land. In the 2020 forecast, the likelihood and the ensemble mean 80% isoline have shifted considerably to the north: north of the Chukchi Sea, the East Siberian Sea and the Laptev Sea, indicating a much longer ice-free season along the Northern Sea Route compared to 2018 and 2019. Between Svalbard and Franz Joseph Land the location of the 80% isoline is more similar to 2019 than to 2018, when the isoline was farther north. In addition, the total area inside the 80% isoline is considerably lower in 2020 compared to both 2018 and 2019.
Both the likelihood forecast (Figure 3) and the ensemble mean forecast (Figure 5) of the effective ice thickness in excess of 1 m also show a northward shift of the isoline in July 2020 to the north of the Chukchi Sea, East Siberian Sea and Laptev Sea, and a shift to the west in the southern Beaufort Sea, compared to 2018 and 2019.
Between Svalbard and Franz Joseph Land the isoline in July 2020 is similar to that in July 2019, whereas in July 2018 the isoline was considerably farther north (in agreement with the observed ice concentration). August and September show a continuation of the previously mentioned differences in July. Based on its location, the ice volume within the 1 m isoline is lower in 2020 than for 2018 and 2019 for all three months. The same is true for the week of 15 to 21 October (Figure 6), for which a validation for 2018 and 2019 was possible.
In summary, considering the current position of RV Polarstern north of Fram Strait, in the coming months it can be safely assumed that the ice conditions will be similar to those in 2019, while in 2018 the isolines for 80 % ice concentration and 1 m ice thickness were farther to the north.
Further literature
- Sumata, H., Kauker, F., Karcher, M. and Gerdes, R. (2019a): Simultaneous Parameter Optimization of an Arctic Sea Ice–Ocean Model by a Genetic Algorithm, Monthly Weather Review. doi:10.1175/MWR-D-18-0360.1
- Sumata, H., Kauker, F., Karcher, M. and Gerdes, R. (2019b): Covariance of optimal parameters of an Arctic sea ice-ocean model, Monthly Weather Review. doi:10.1175/MWR-D-18-0375.1
Contacts
Questions?
Contact us via E-Mail or our contact form.
Graphics


![[Translate to English:]](/fileadmin/_processed_/2/1/csm_Arktis-Arctic_september_2020_sea_ice_prediction_Vorhersagen_Meereisausdehnung_arcus_33a66cc798.png "[Translate to English:]")