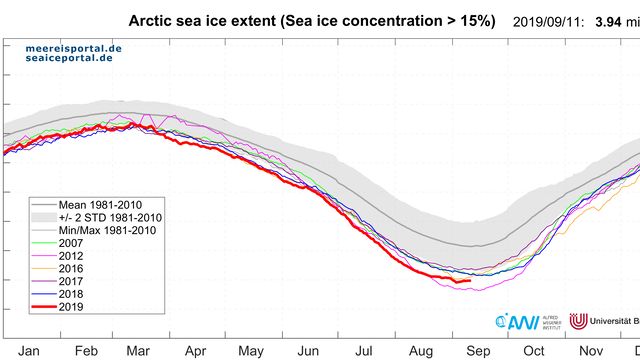
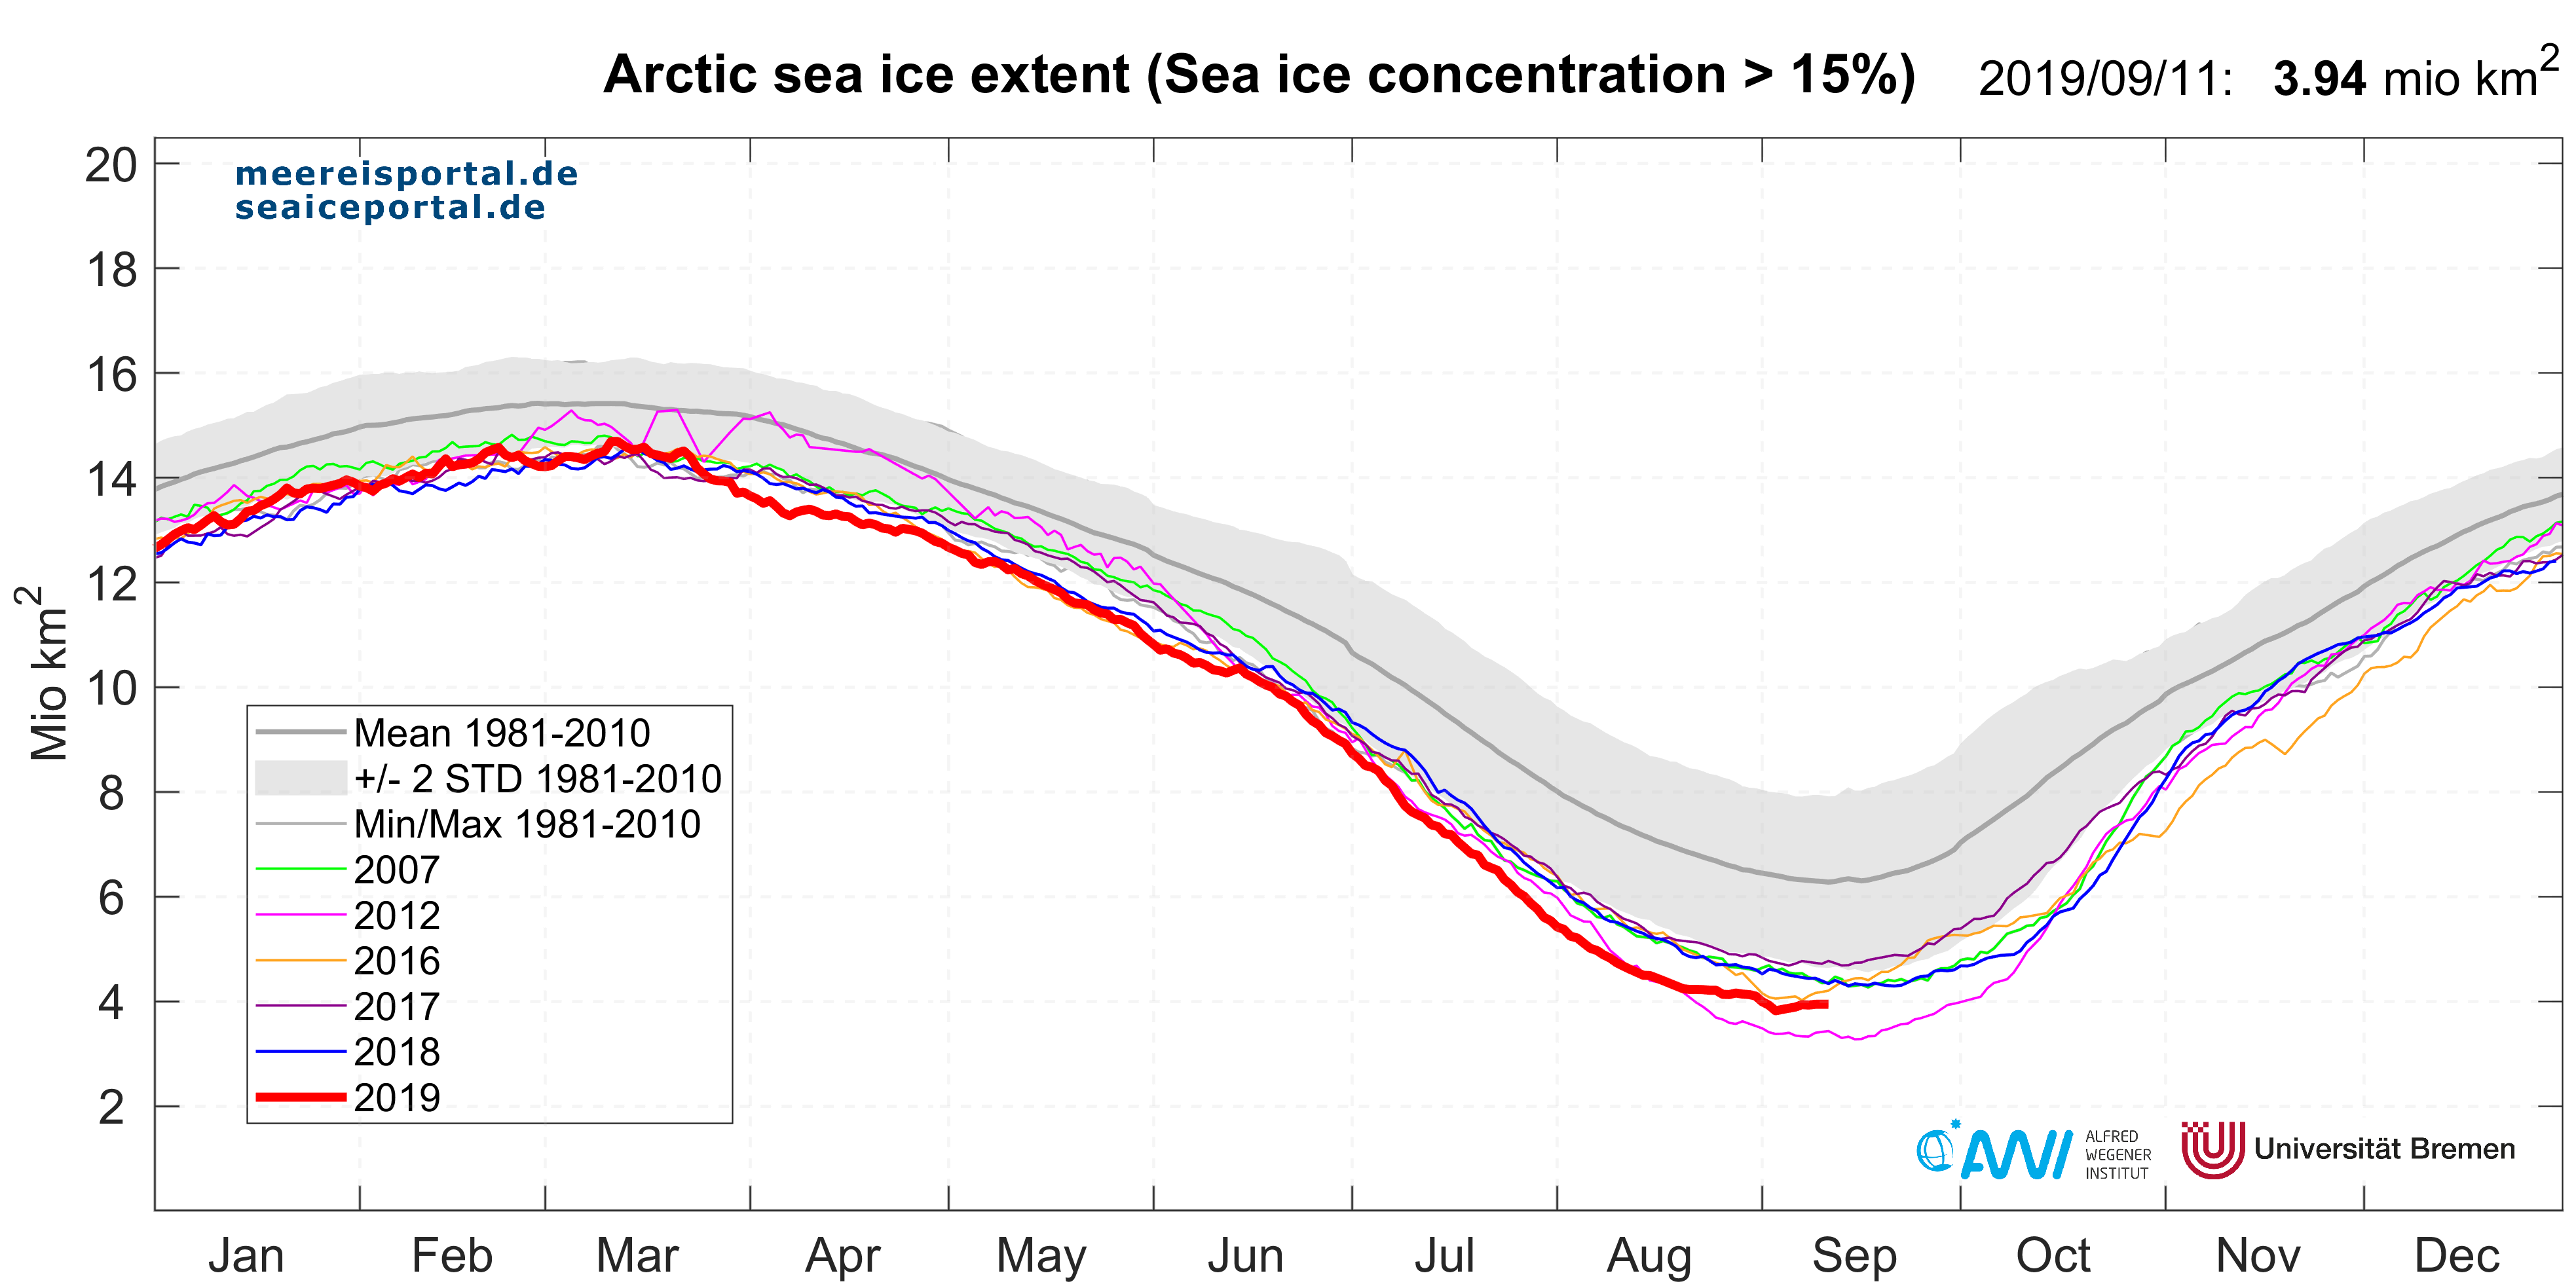
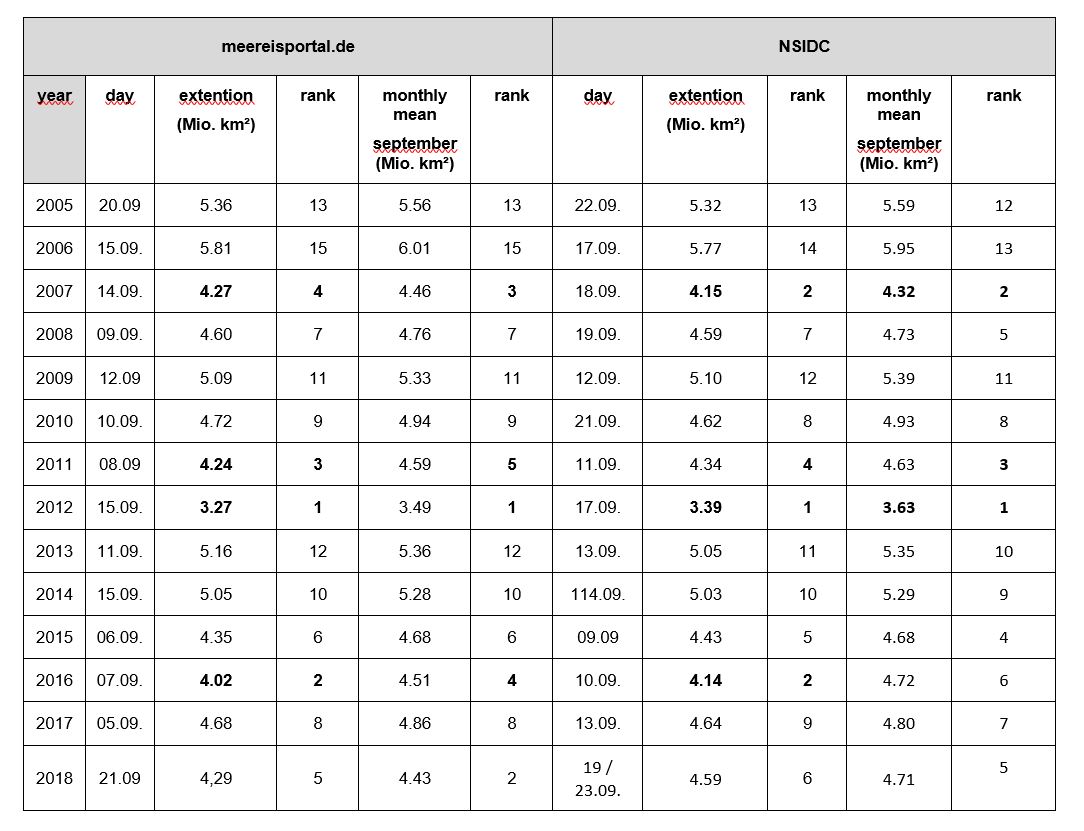
On 11 September the sea-ice extent (sea-ice concentration > 15 %) was 3.94 million km² (see Figure 1) and on 3 September 2019 it had already decreased to 3.82 million km², the lowest level so far this year. It remains to see whether it will drop below this (see Table 1, Figure 2). Based on previous years, the summer sea-ice minimum is reached in mid-September, but sometimes not until the second half of the month, depending very much on the prevailing wind conditions.
Our meereisportal.de data shows a sea-ice extent of circa 3.94 million km² on 11 September. Other evaluation algorithms, like, for example, that of the National Snow and Ice Data Centre (NSIDC), can deviate slightly from this (see article 2018). “These minor differences are due to the higher resolution of our data and the slightly different methods the various data centres use to predict the ice concentration. They show the uncertainties that even the most modern satellite observations of the sea-ice can have,” explains Dr Gunnar Spreen from the University of Bremen’s Institute for Environmental Physics (IUP). For example, the sensors used on different satellites measure different wavelength spectra and so have different spatial resolutions. For instance, the IUP’s evaluation algorithm uses a high data resolution of 6.5 km x 6.5 km. The way the coastline is dealt with in the evaluation is also an important factor in calculating the ice area, since satellite data naturally also covers land areas (so-called retrieval algorithm; you can find more information on this here in a Nature Correspondence Article).
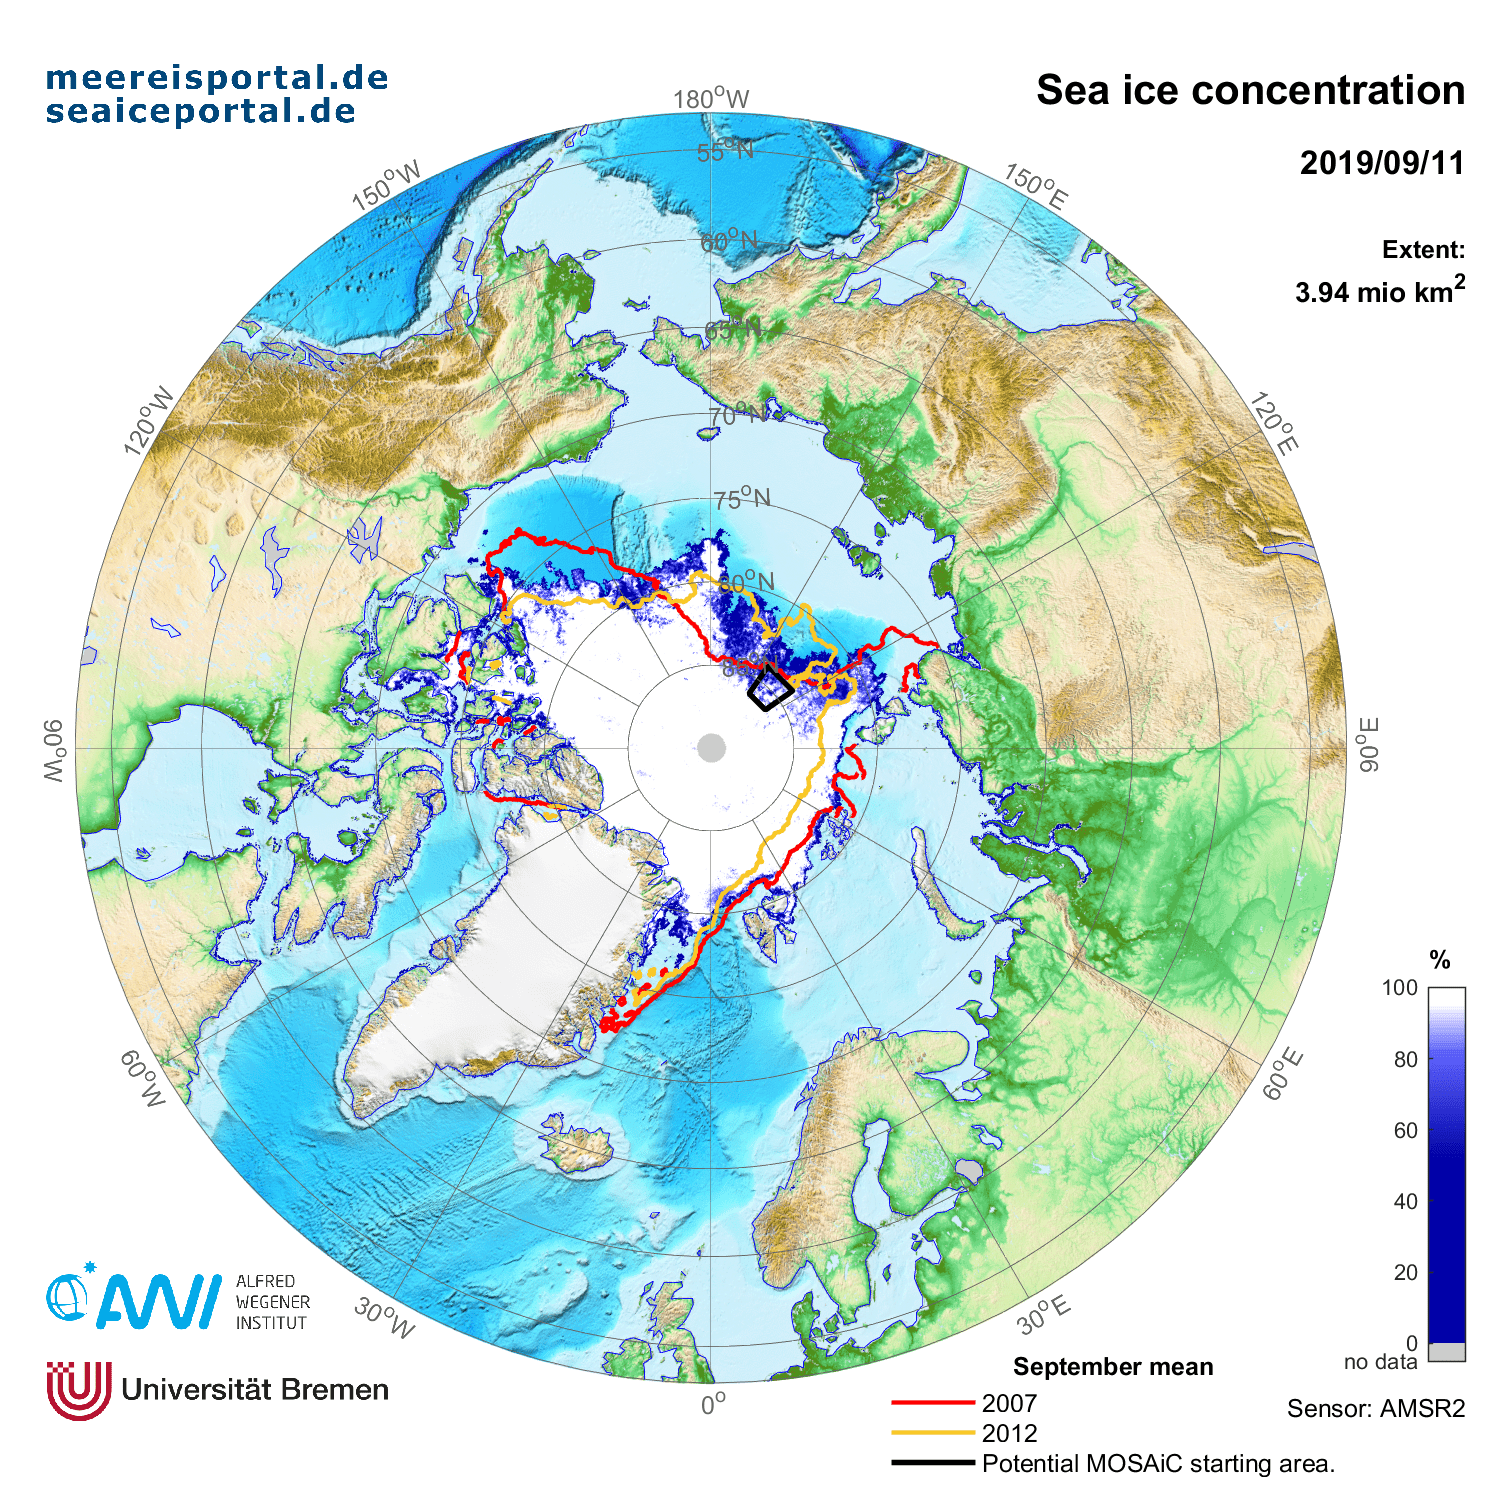
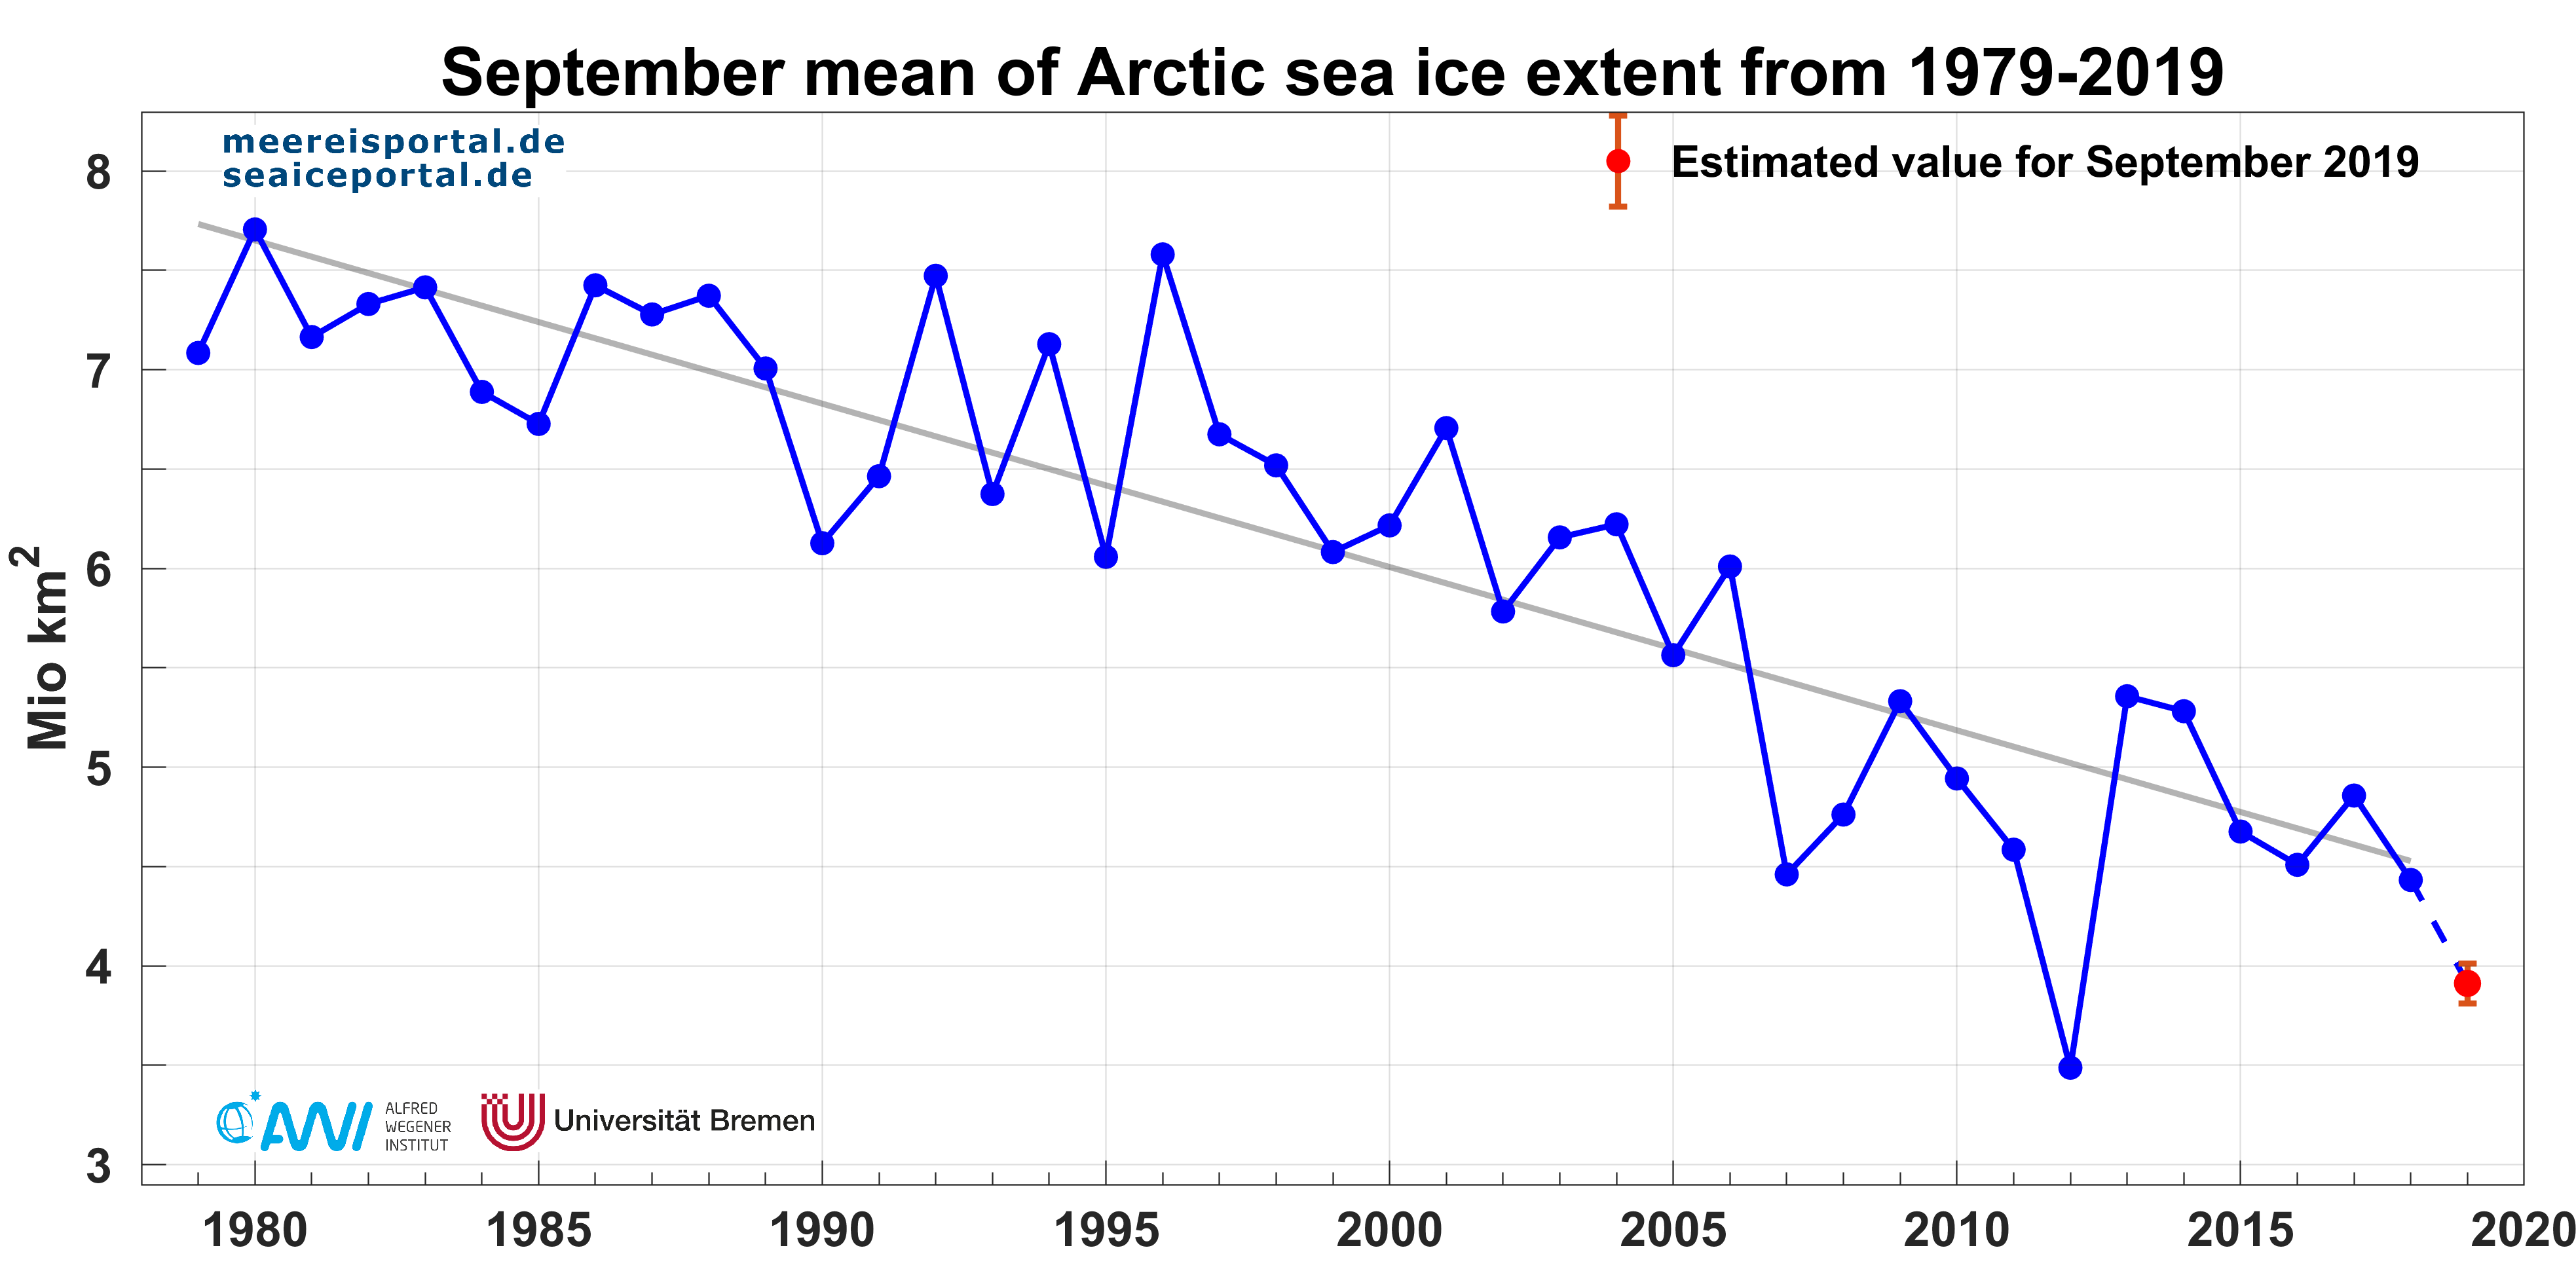
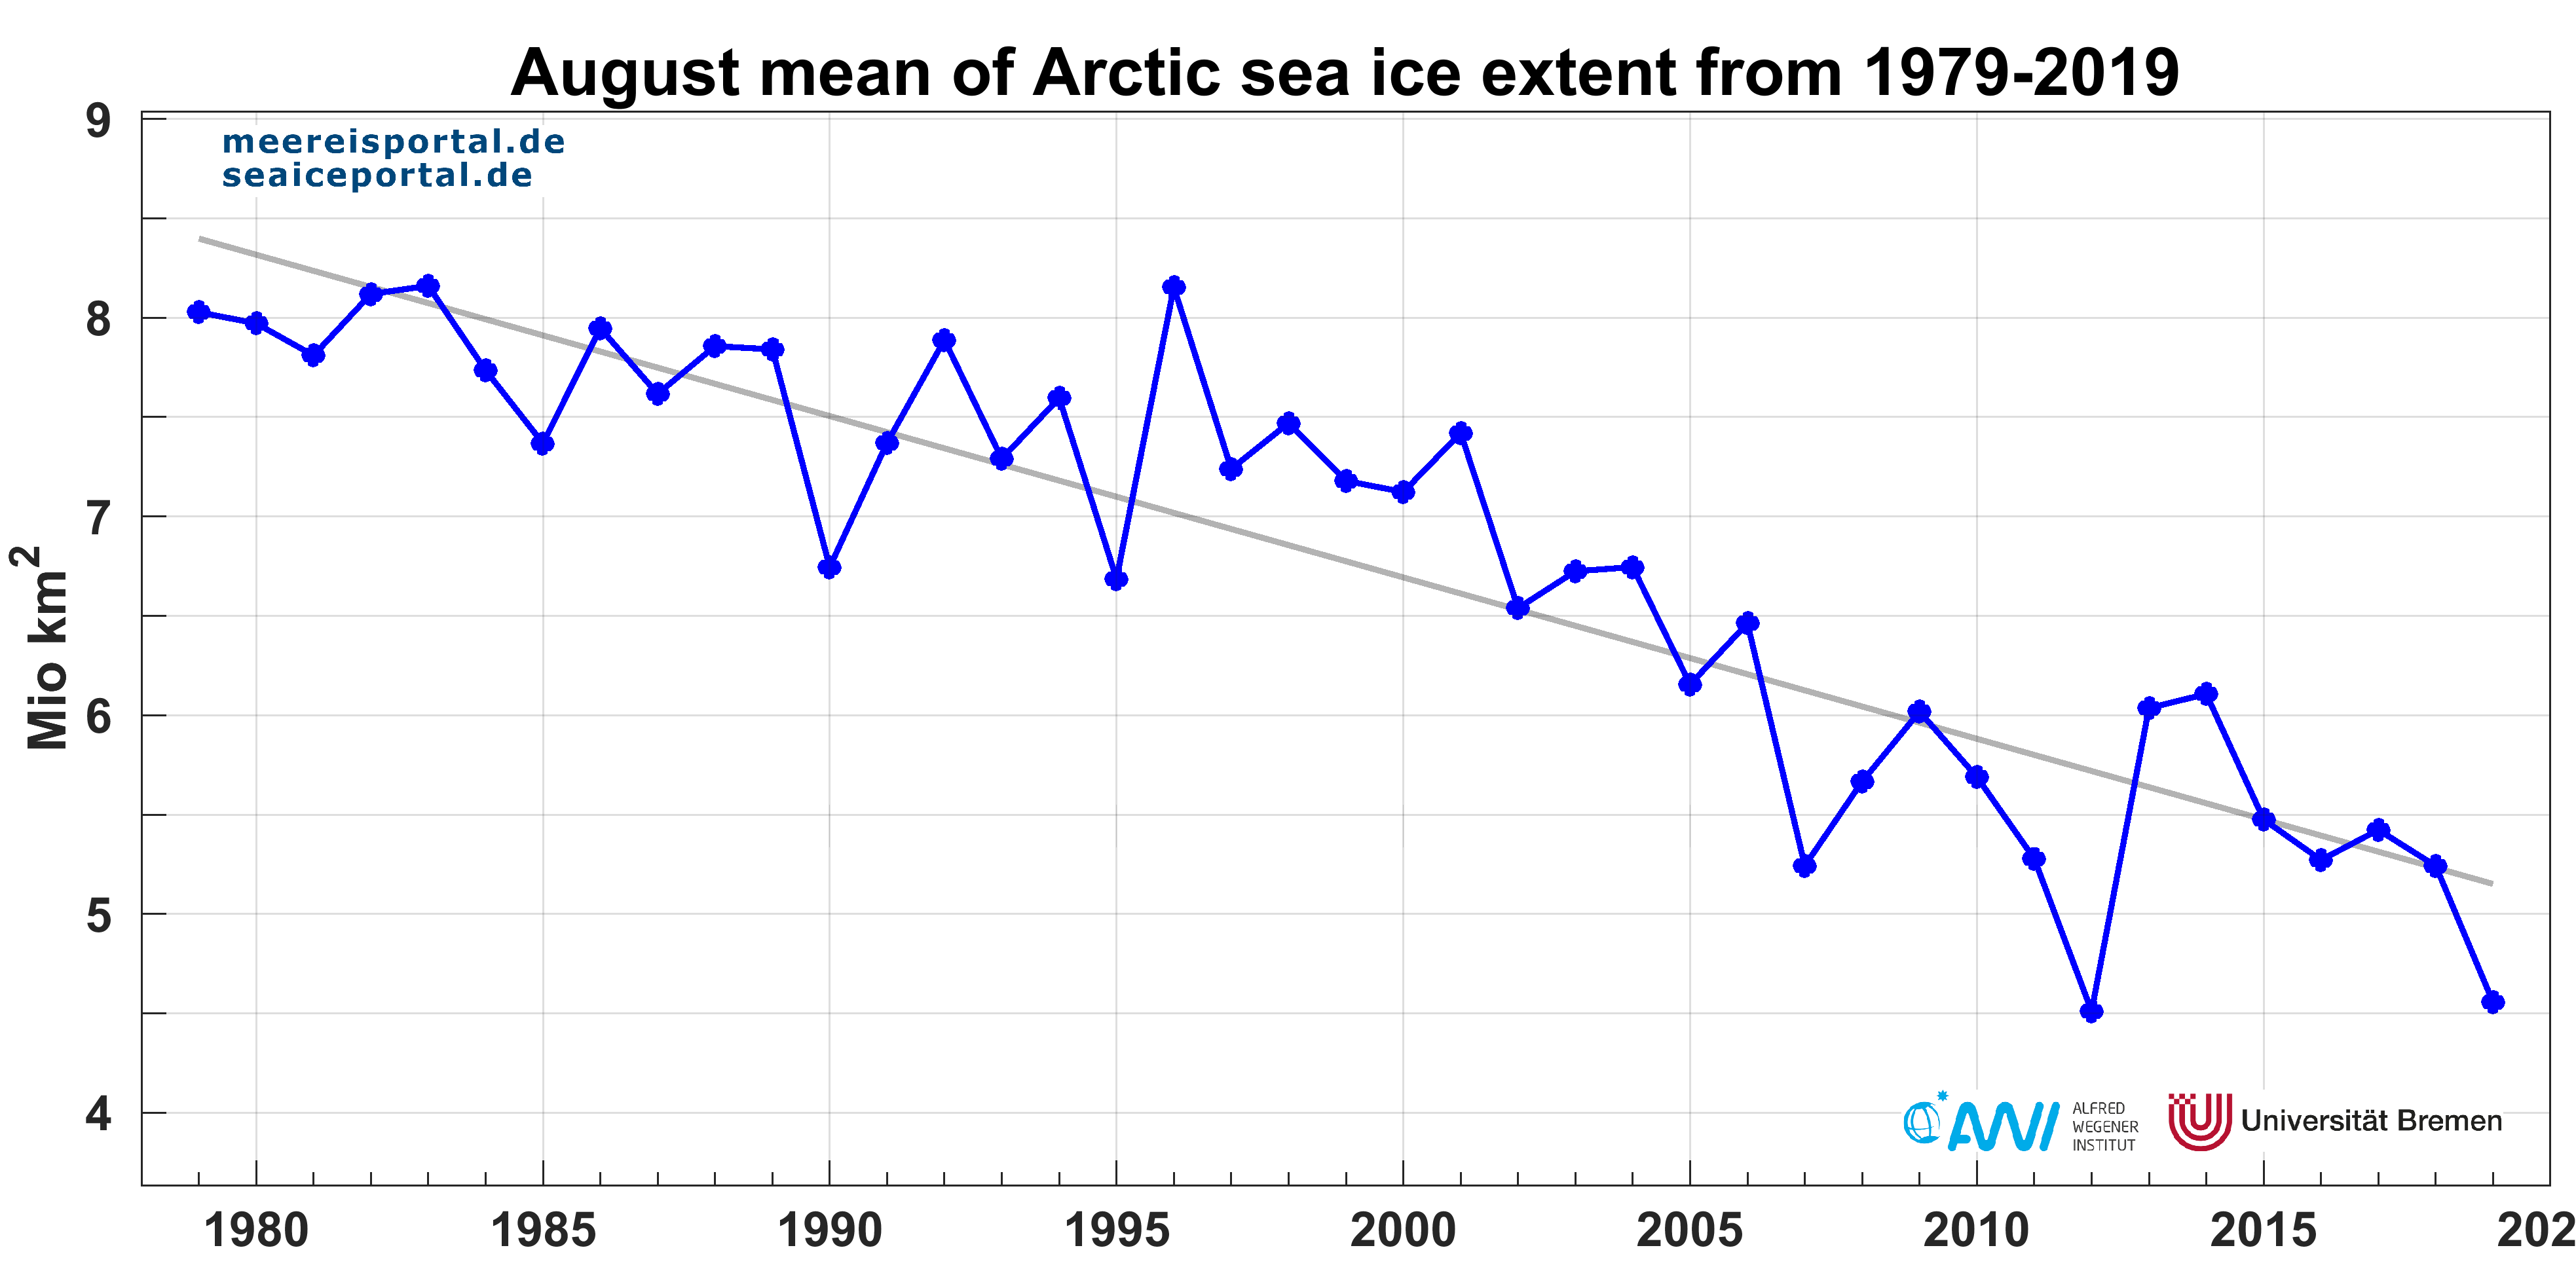
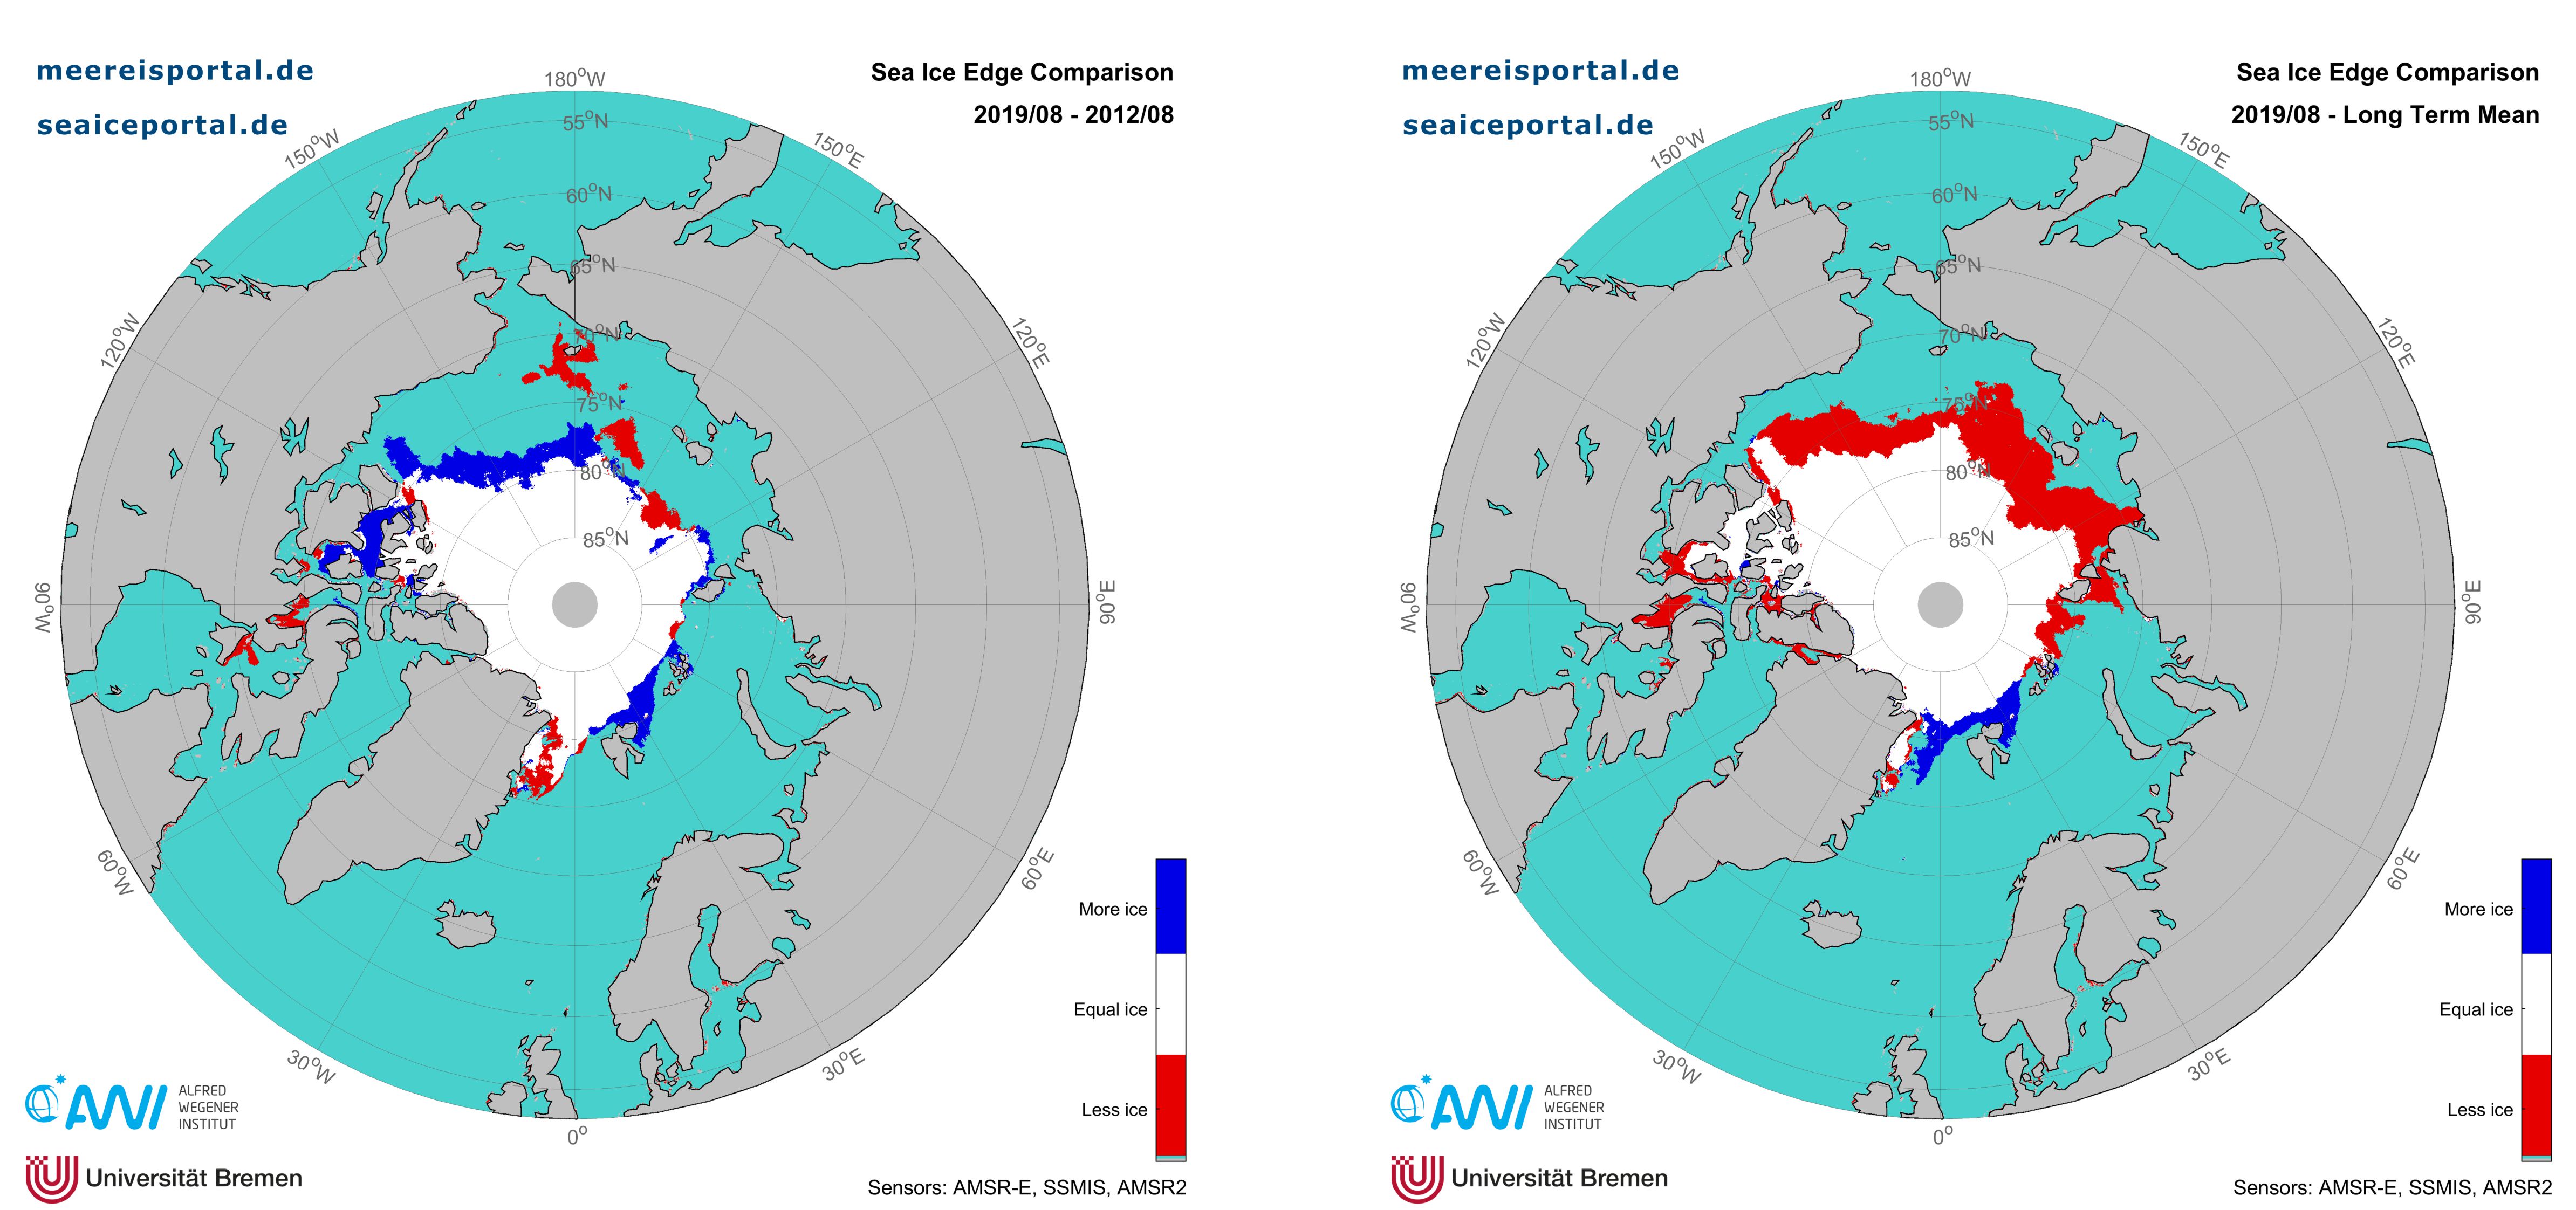
Up to mid-August, this years’ ice extent values were lower than those observed in 2012 – the year with the lowest summer minimum to date. However, the melting has now slowed. Even so, this year will see the second-lowest sea-ice minimum since the beginning of continuous satellite observation in 1979 (see Figure 3). In August, the second-lowest ever extent was observed (see Figure 4), after a new record minimum had already been recorded in July. In August the ice extent was 45,166.5 km² greater than the 2012 minimum. During the second half of August, the decrease slowed considerably, and this has continued into early September. The sea-ice concentration was particularly low in the Beaufort and Laptev Seas. Throughout the whole of August, the ice loss in the East Siberian Sea was particularly marked. Currently, the ice edge is located much farther north compared with the climatological average. Only in the area around Svalbard did the ice remain roughly in the region of the long-term average or even push slightly southwards (see Figure 5). Compared to 2012, more ice remained in the Beaufort Sea.
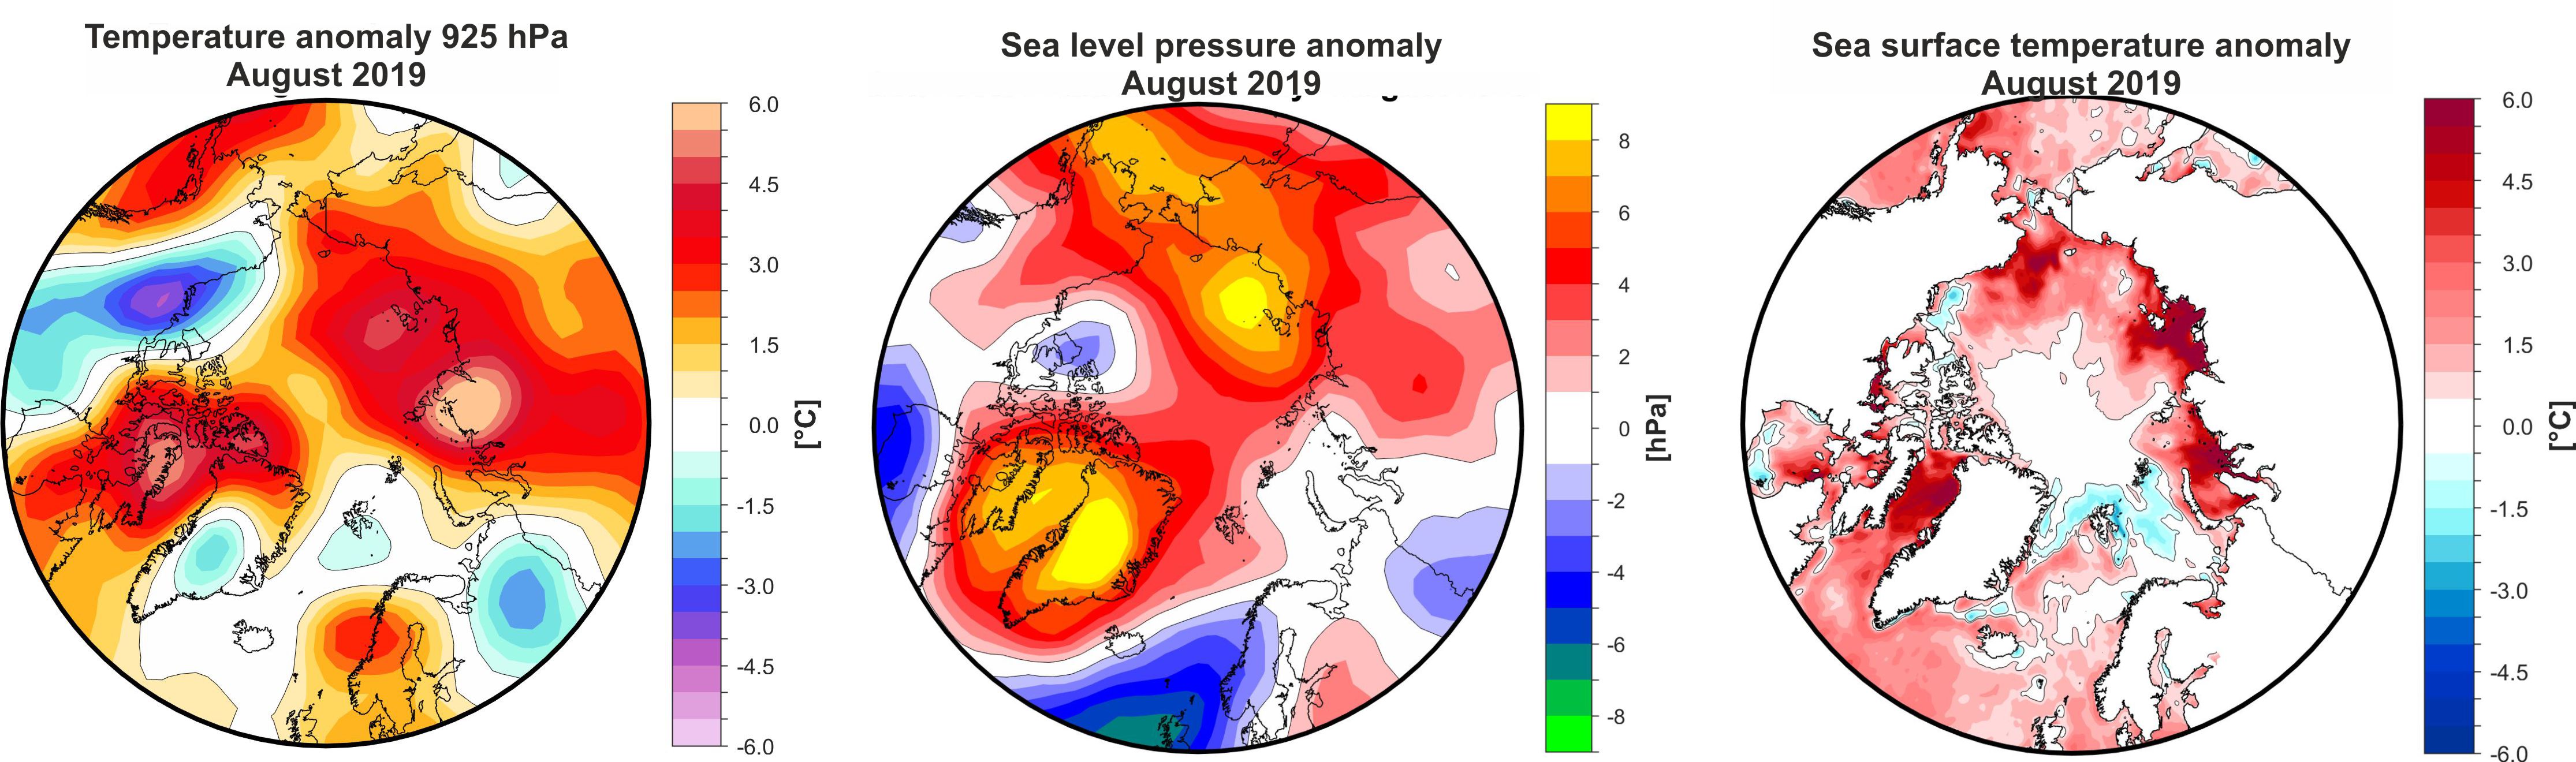
Throughout August, the temperatures at 925 hPa (roughly 750 m) were above the long-term average for almost the entire Arctic Ocean. The temperatures for the region from the East Siberian Sea to the Laptev and Kara Seas were between 2 and 5 degrees higher than the average for 1981-2010, and in the Canadian Arctic Archipelago up to 3 degrees higher (Figure 6). In contrast, the temperatures in Svalbard were up to 1 degree below the average. Cooler conditions were seen in the Beaufort Sea. In the third week of August, a low-pressure system developed over the Northwest Territories in Canada, and this then moved toward the Beaufort Sea and the Canadian Arctic Archipelago.
In August, the sun is already low on the Arctic horizon, the air temperatures fall below freezing and snow starts to fall. Summer appears to be over and the surface melt comes to an end. But: the melting continues since there is still enough heat in the ocean to continue to melt the bottom of the sea ice. The surface melt reaches its maximum in July and ends in mid-August. In contrast, the melting of the bottom side of the sea-ice reaches its maximum level in August and often continues into late September or October (see Figure 6) (source: NSIDC).
Significance for the start of the MOSAiC expedition
For the MOSAiC expedition, which starts on 20 September, the conditions are generally favourable. However the expedition needs an extremely large floe, and due to the proximity to the ice edges, there are very few of these. The ice in the planned starting region (area marked in black in Figure 7) has retreated significantly and the route to the target region is largely free of ice. We therefore anticipate good accessibility for RV Polarstern and the Russian ship Akademik Fedorov, which will escort RV Polarstern to the target region. A suitable ice floe for the RV Polarstern to moor to, and which will offer a ‘safe anchorage’ for the next eight to ten months, can only be selected once they arrive in the region. Professor Christian Haas, head of the Sea-ice Physics section at the AWI adds: ‘The light ice conditions have advantages in terms of reaching the starting area, but on the other hand, the northerly position of the ice edge also means that there are only a few ice floes in the target area that are large enough and thick enough to set up an ice camp on.’ An overview of the various sea-ice-related satellite observation products for the MOSAiC drift experiment has been available here since last week. Twice a week, the Sea Ice Ticker also provides a brief assessment of the sea-ice situation for the planned starting region. This service will continue until RV Polarstern has moored to an ice floe. After that, the meereisportal.de will regularly publish exclusive articles on the work and the first findings of the MOSAiC Sea Ice group. General information on the MOSAiC expedition is always available at: https://www.mosaic-expedition.org/.
Contacts
Questions?
Contact us via E-Mail or our contact form.
Graphics


 and monthly mean: Arctic between 2005 and 2018.")


 and monthly mean: Arctic between 2005 and 2018.")
