In September, the summer sea-ice melting ends in the Arctic. In other words, on a certain day of the month, the sea-ice cover reaches its lowest extent for the year and then begins growing again, because the surface water begins freezing again. Polar and climate researchers around the globe watch with great interest to see how much sea ice survives the summer. Viewed over an extended timeframe, the so-called September minimum offers an indication of whether the Arctic sea-ice extent is generally shrinking, growing or remaining the same. Accordingly, the sea-ice minimum has since become an important parameter for gauging global climate change. Only a few weeks ago, when the IPCC presented its 6th Assessment Report, Working Group I stressed that the September Arctic sea-ice extent had declined by 40 percent over the past four decades, representing one of the starkest signs of climate change.
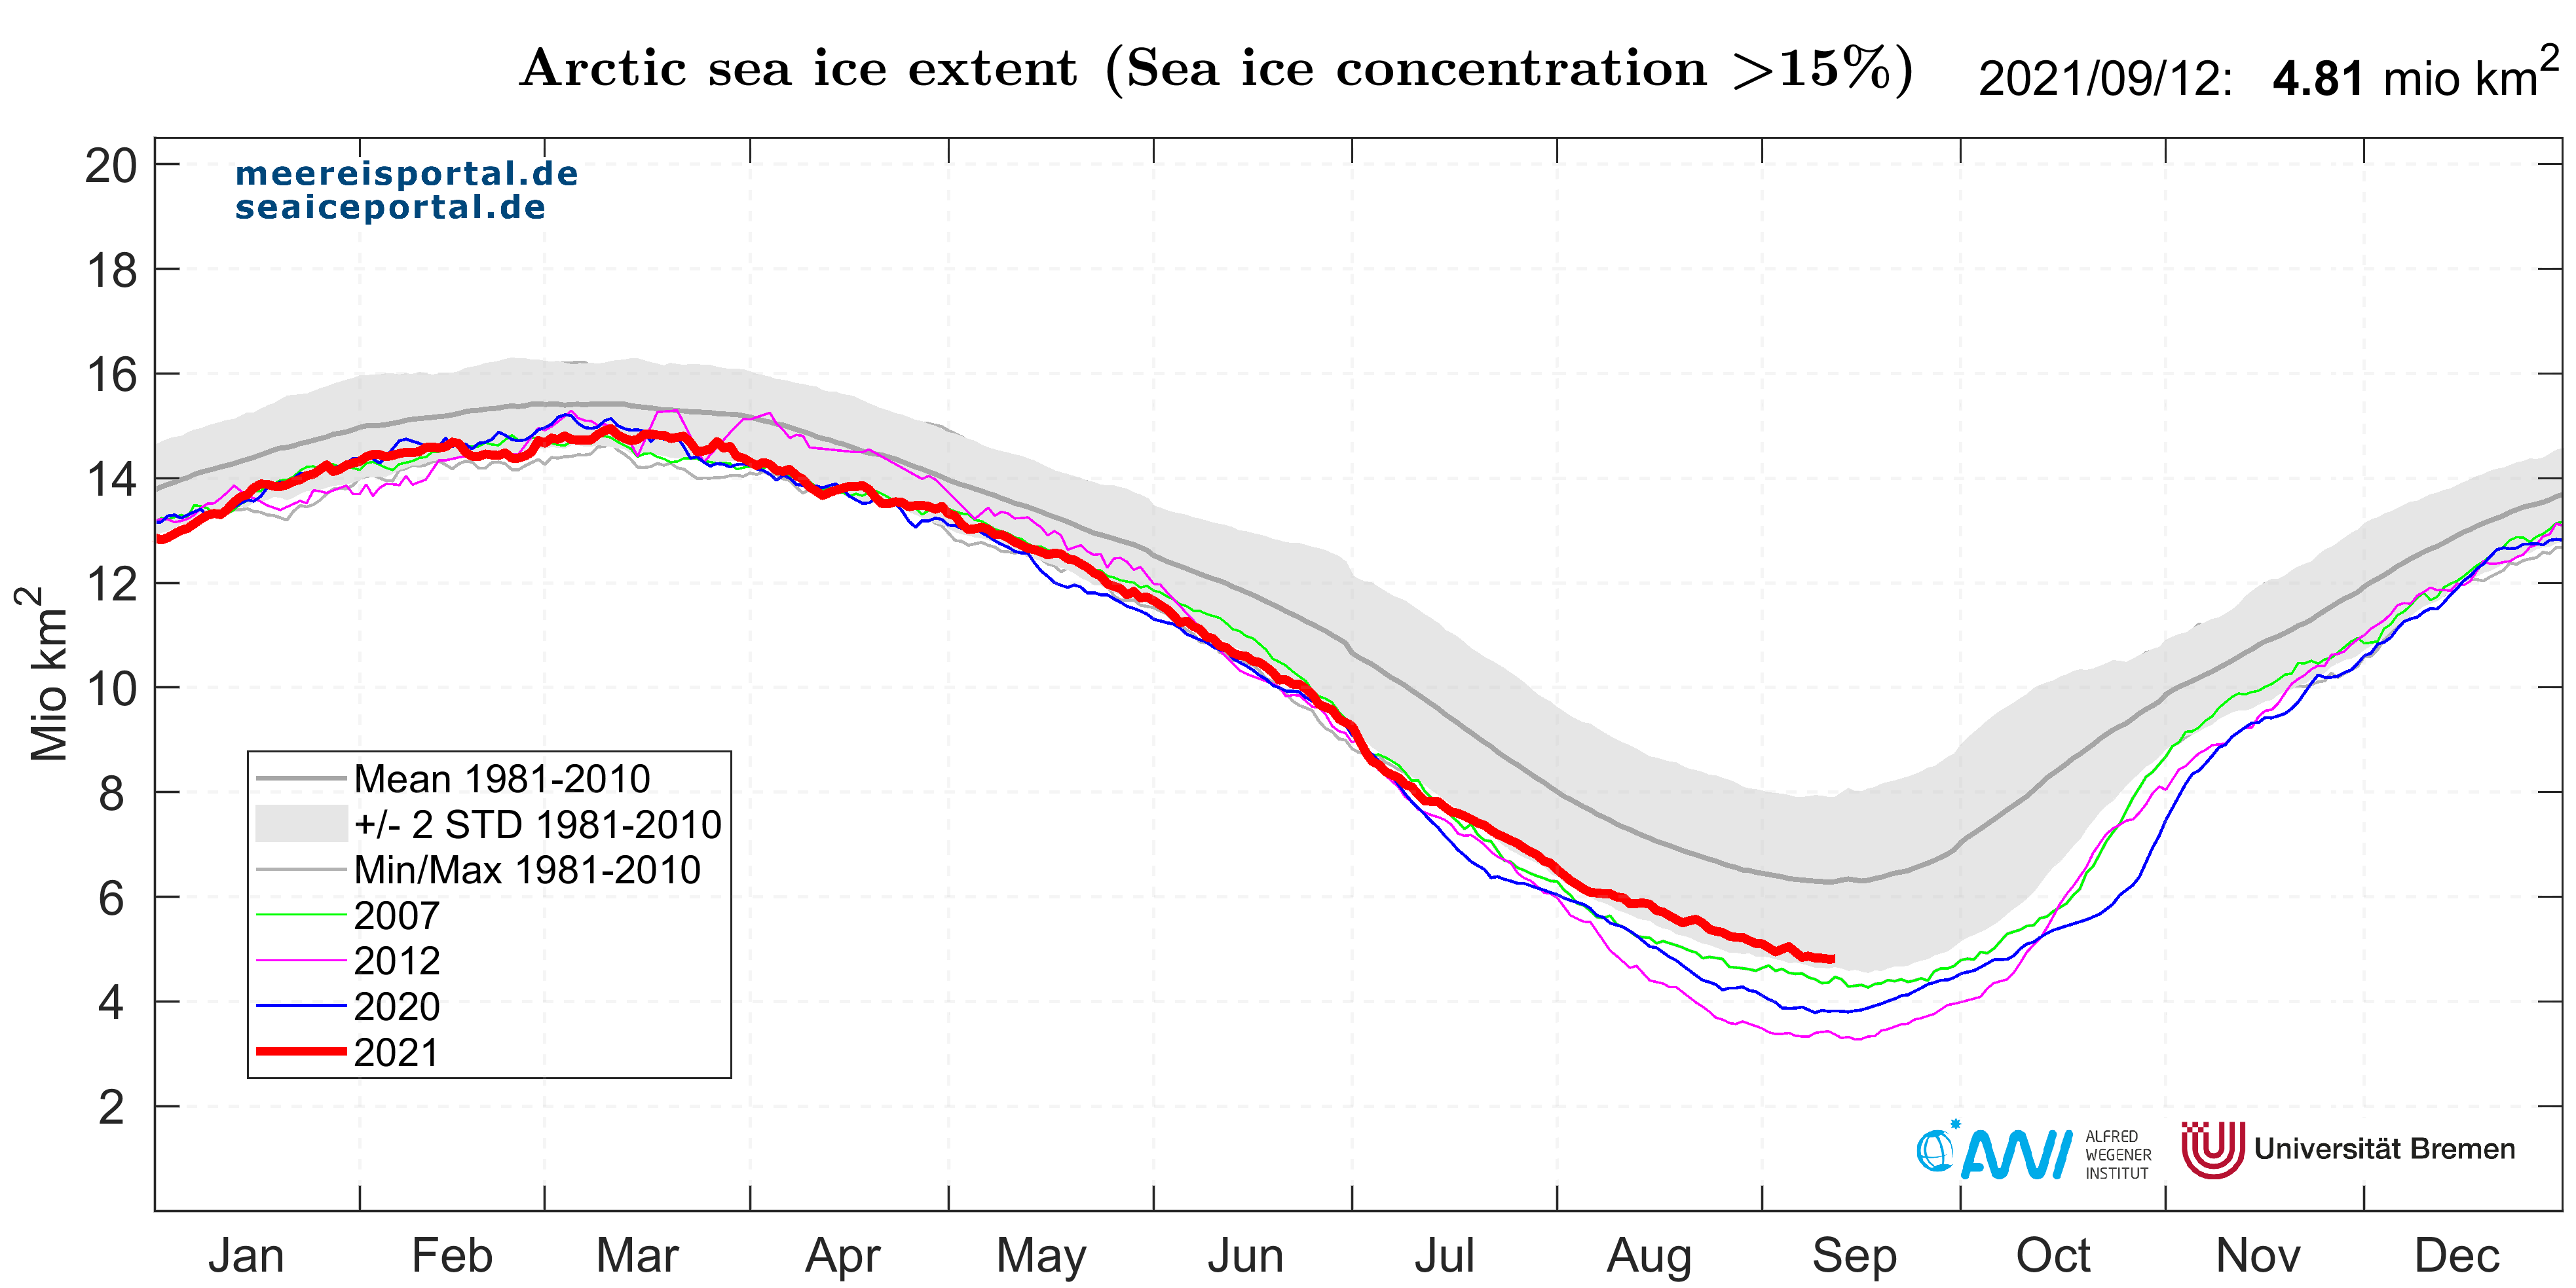
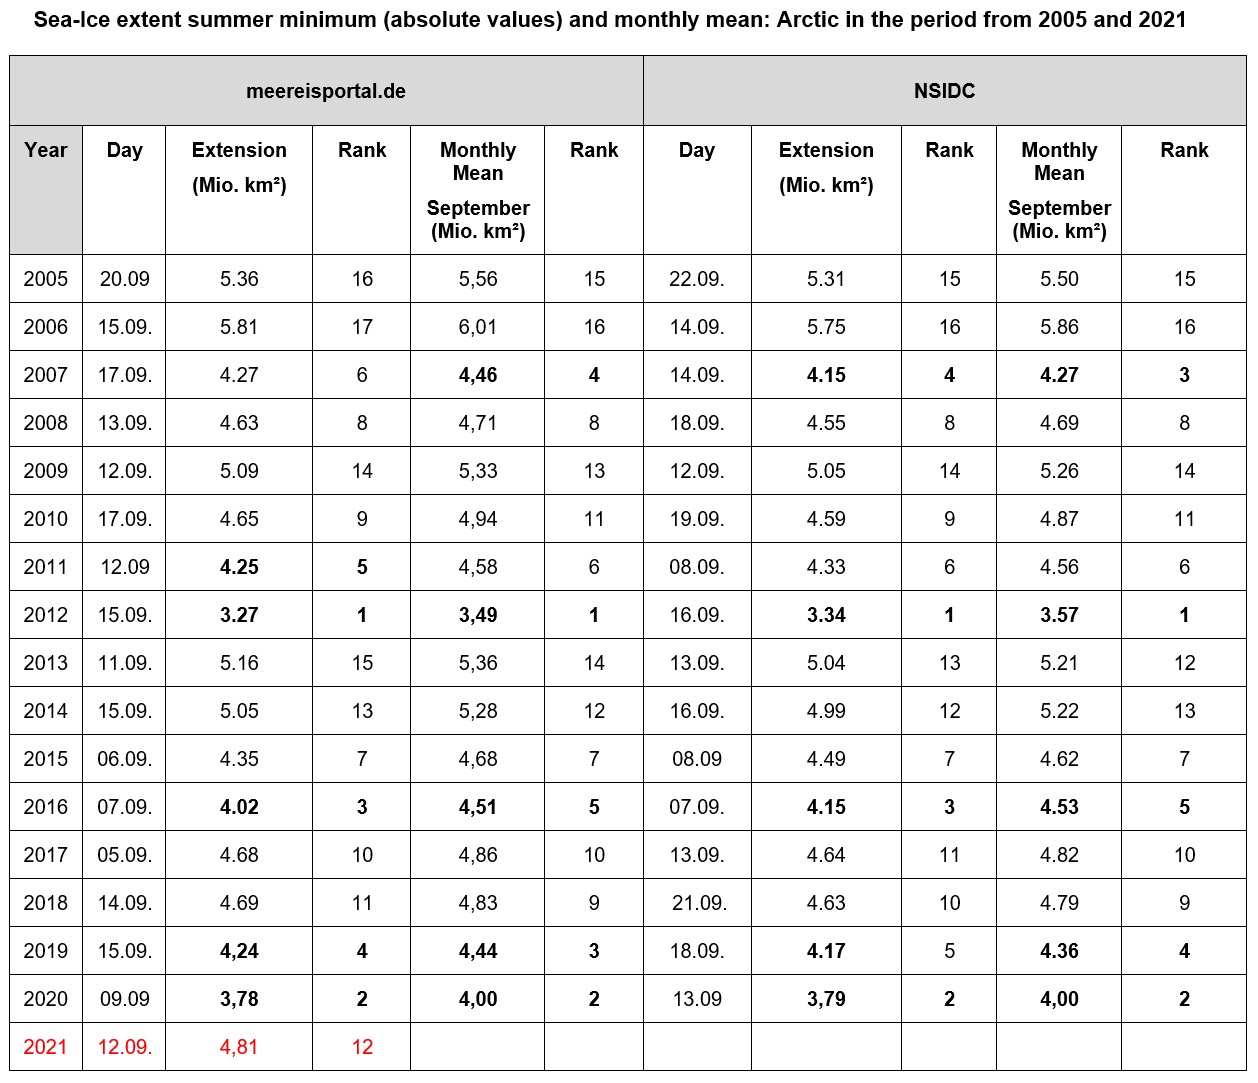
This year, the summer heat had a more moderate effect on the Arctic than in the past five years. Up to the end of the current melting season on 12 September 2021, the Arctic sea-ice cover shrank to a total area of 4.81 million square kilometres; 1.54 Million square kilometres more than in the record low year 2012. Back then, the satellites recorded a residual area of 3.27 million square kilometres. As such, the 2021 Arctic sea-ice minimum comes in at 12th place on the negative list for absolute values (Table 1).
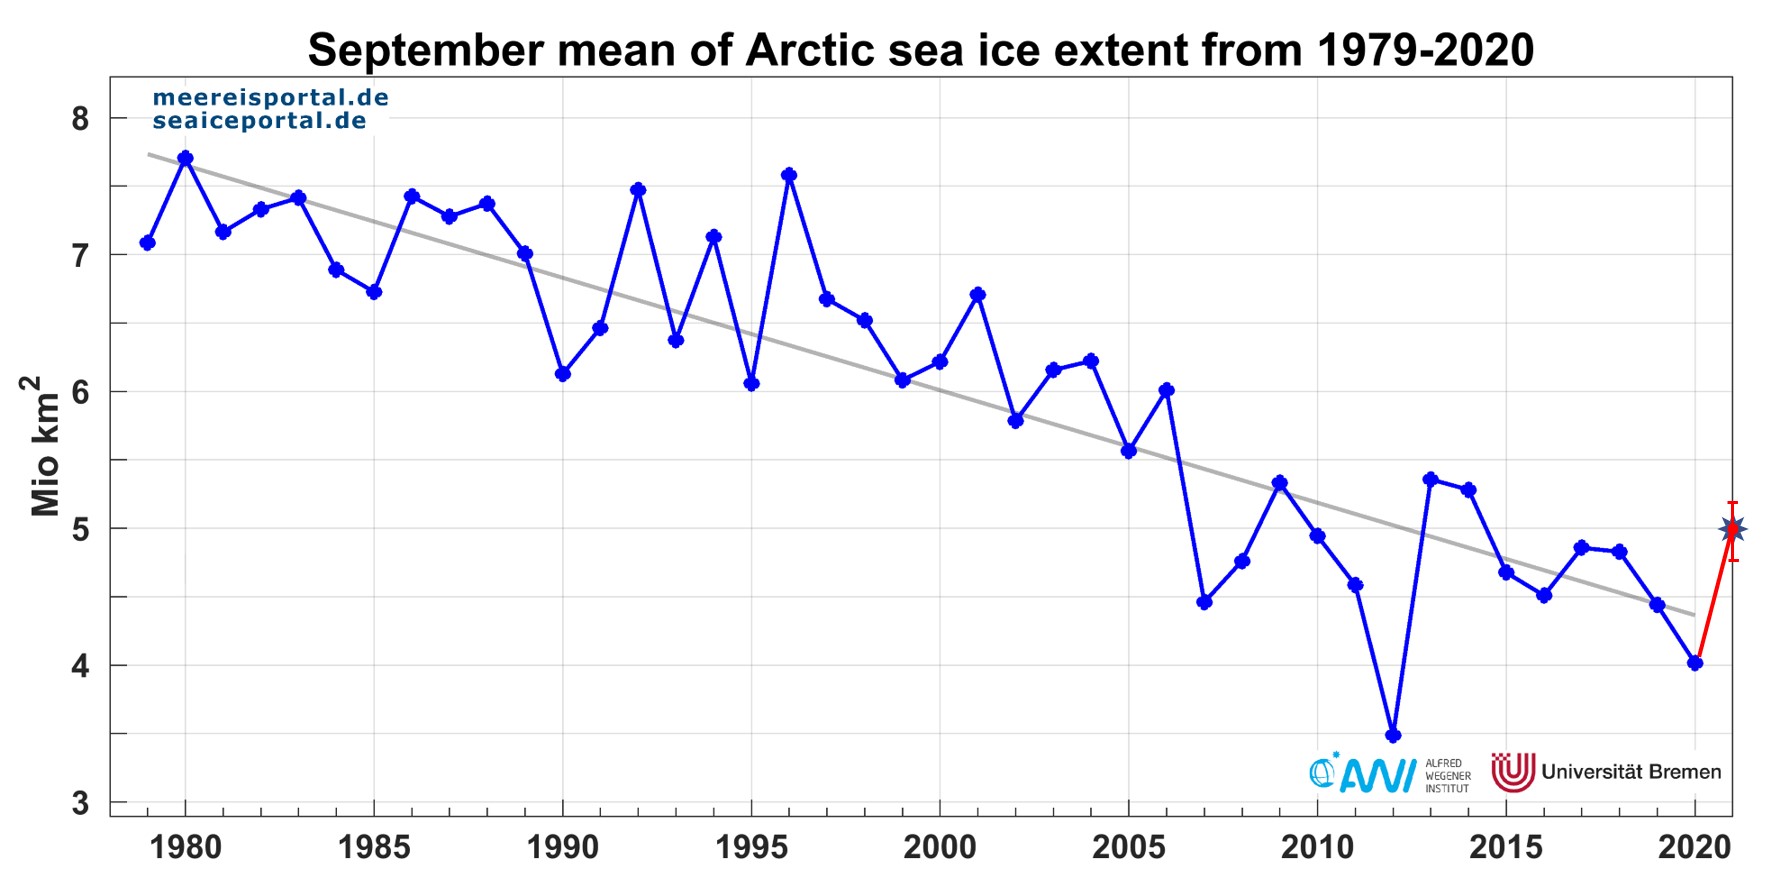
In the daily ice data, the moderate sea-ice decline in summer 2021 can especially be seen from the beginning of July (Fig.1). Here, the extent is hovering near the lower edge of two standard deviations from the mean for the years 1981 – 2010 (grey band in Fig.1) and lies significantly higher than the last several minimum years. The monthly mean value for September is currently projected at 5 +/- 0.2 million km² (Fig. 2).
No signs of recovery
“Despite this comparatively moderate ice retreat, we’re definitely not seeing a recovery of the Arctic sea ice,” says Prof Christian Haas, Head of the Sea Ice Physics Section at the Alfred Wegener Institute, Helmholtz Centre for Polar and Marine Research. “First of all, the current sea-ice minimum lies far below the values we know from the 1990s and 2000s. In other words, it confirms the trend of substantial decline in sea-ice extent of roughly 12.7 percent per decade. For another, both satellite observations and on-site observations, e.g. from the Wandel Sea off the northeast coast of Greenland, and in the Beaufort Sea, show that the ice thickness is decreasing and the sea-ice concentration in both regions is unusually low. In many areas, there are broad expanses of open water between the floes,” the expert explains.
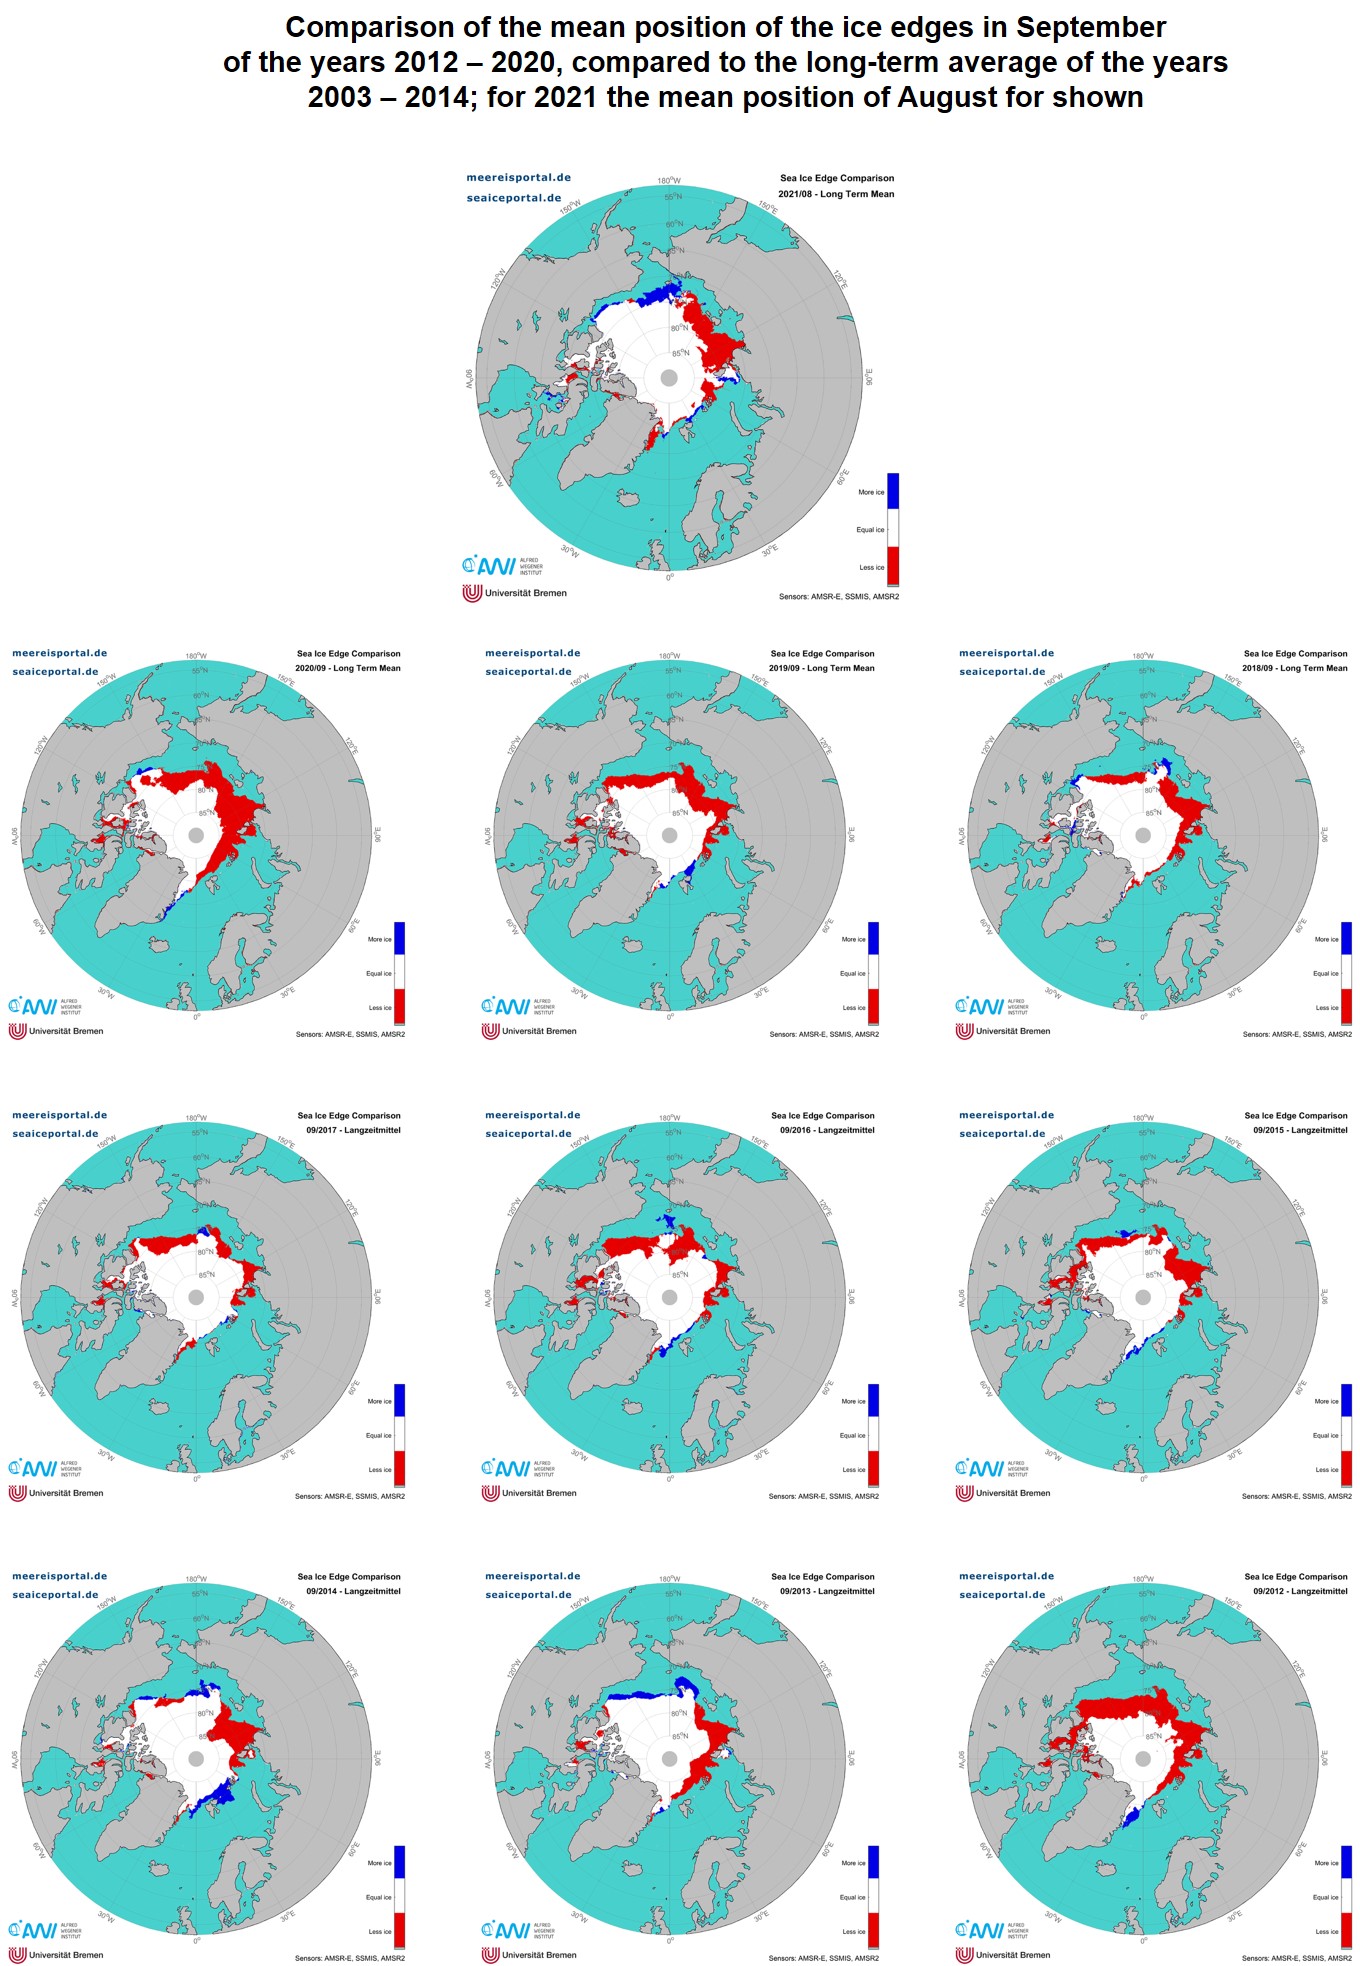
In his opinion, the current ice distribution shows once again how variable the sea-ice development is, and what regional differences can appear from year to year. For instance, there were similarly large changes in the remaining ice area from 2012 to 2013, and from 1995 to 1996. Among the regional peculiarities in 2021 is the fact that, this summer, a comparatively great deal of ice survived in the western Arctic, whereas the Laptev Sea experienced the greatest loss of ice since the beginning of satellite observation in 1979. There was also substantial melting in the Greenland Sea, as a result of which the ice edge retreated far to the north, and by early September the Sea was nearly ice-free. That being said, the phenomenon isn’t wholly unprecedented: in 2002, satellites also recorded very little ice in the Greenland Sea.
A stable low-pressure system slowed melting, winds distributed the ice
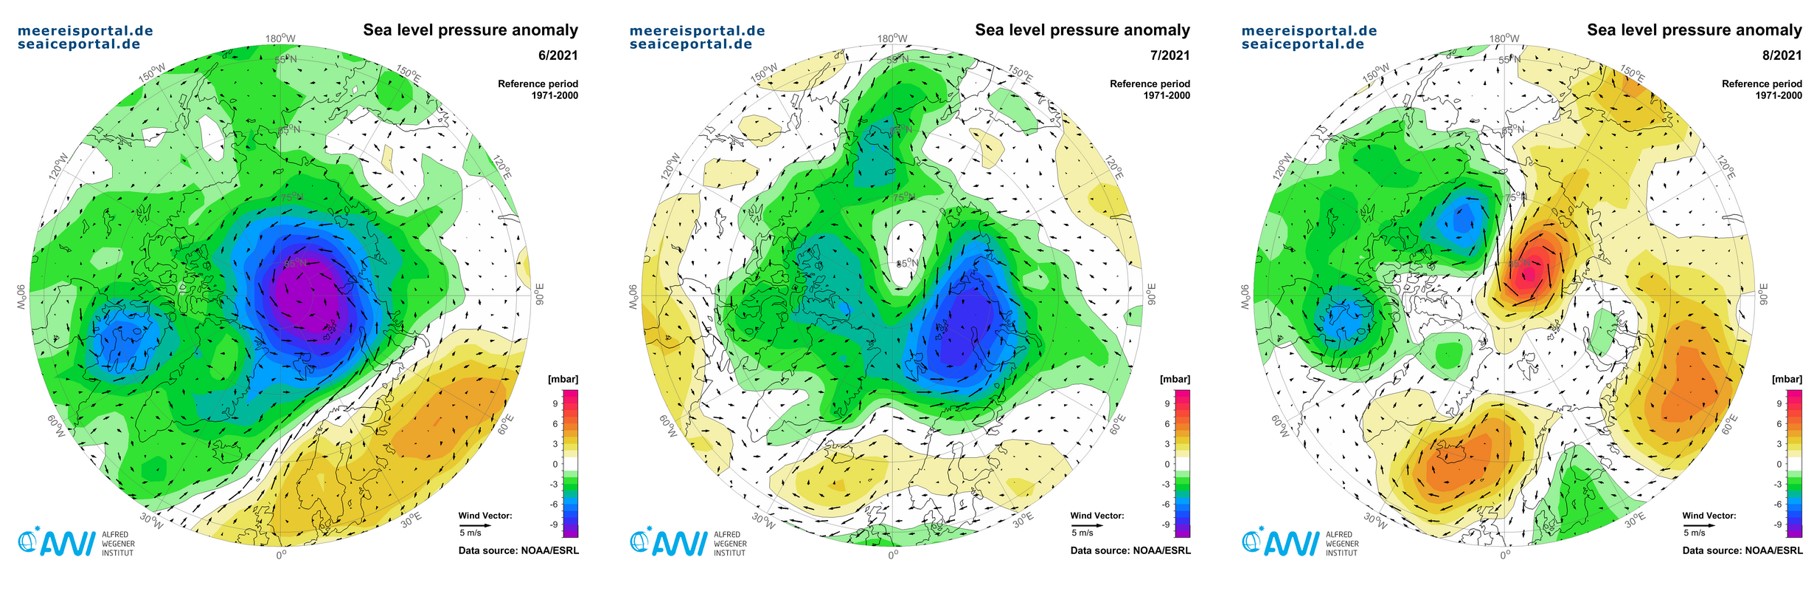
An essential factor in the slow melting this summer was the persistence of a low atmospheric pressure over the Central Arctic (Fig. 4). “Especially in June and July, this low-pressure system prevented the influx of Atlantic and Pacific warm air masses into the Central Arctic and stabilised the sea-ice situation. In August, a high-pressure system prevailed over the European part of the Arctic, while the low-pressure system shifted to the Beaufort Sea, producing temperatures 2 to 3 degrees Celsius below the long-term average. This comparatively cold air kept the ice from melting, even though the ice concentration in the region was in some cases extremely low,” says AWI climatologist Dr Monica Ionita-Scholz.
The relatively long dominance of the low atmospheric pressure system also meant that, throughout the summer, the air temperatures north of 70° North were on average only 1 to 2 degrees Celsius above the long-term average. “For comparison: in summer 2020 we recorded air temperature differences of 5 to 6 degrees Celsius, compared to climatology, in the central regions of the Arctic Ocean,” the AWI expert explains.
The low-pressure system is also the reason for the markedly low ice concentration in the western Arctic, but especially in the Beaufort Sea. “At the edges of such a low-pressure system winds blow, driving the sea ice apart in a clockwise motion and distributing it broad-scale. In August, we could see exactly this process at work, particularly in the Beaufort Sea,” says Christian Haas.
At the same time, off the northern coast of Alaska thick multiyear ice, which had been transported toward the coast in spring by the wind-driven Beaufort Gyre, was melting. The loss of this major quantity of old sea ice caused the already low percentage of thick ice in the Arctic to drop further, the AWI experts surmise. That being said, they will only have a detailed overview of the remaining ice’s thickness and age distribution in October, when all the meltwater ponds on the ice have frozen again and the CryoSat-2 satellite can once again deliver reliable thickness measurements. An analysis of its data in April 2021 revealed a record low ice volume at the beginning of summer.
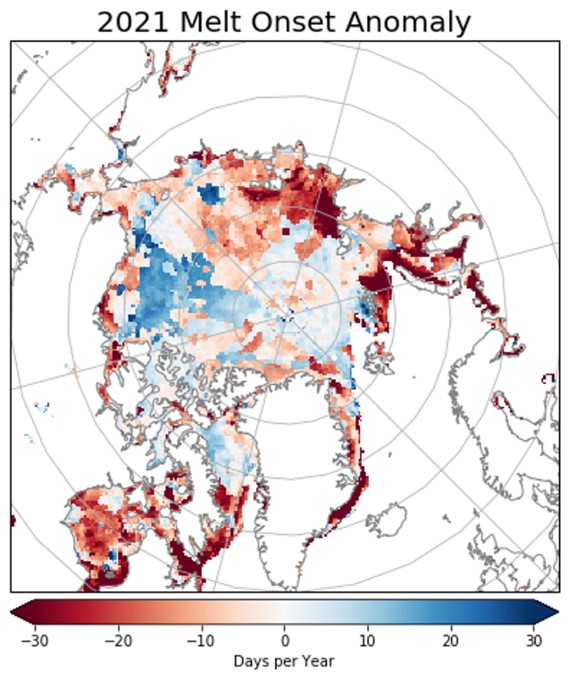
In this regard, we would also like to mention sea-ice analyses conducted by researchers in the US, which indicate that this year – especially in the Laptev Sea, Kara Sea, Barents Sea and certain regions off the eastern coast of Canada – the sea-ice melting began more than a month earlier than the long-term average for the years 1981 to 2010 (Fig. 5). This development likely accelerated ice loss in the marginal seas of the Arctic Ocean.
Northeast Greenland: 40-minute flight to the ice edge
The exceptionally high sea-ice retreat off the northeast coast of Greenland had direct effects on the AWI Sea Ice Group’s aerial summer measuring campaign in the region, part of the IceBird series. “Whereas in past years, we could start taking sea-ice thickness measurements over the Wandel Sea shortly after taking off from Station Nord, because we immediately had ice below us, this time we had to fly over open water for nearly 40 minutes just to reach the ice edge,” recalls AWI sea-ice physicist Dr Jakob Belter.
This long delay not only cost valuable time in the air that the team had planned to use for measuring work; Belter was also personally shocked by the scale of local sea-ice melting: “If you consider that our base of operations, Station Nord, is located on the 81.6 parallel north, you wouldn’t normally assume you’d have to fly over half an hour before you could start doing your work,” he said at the end of the campaign.
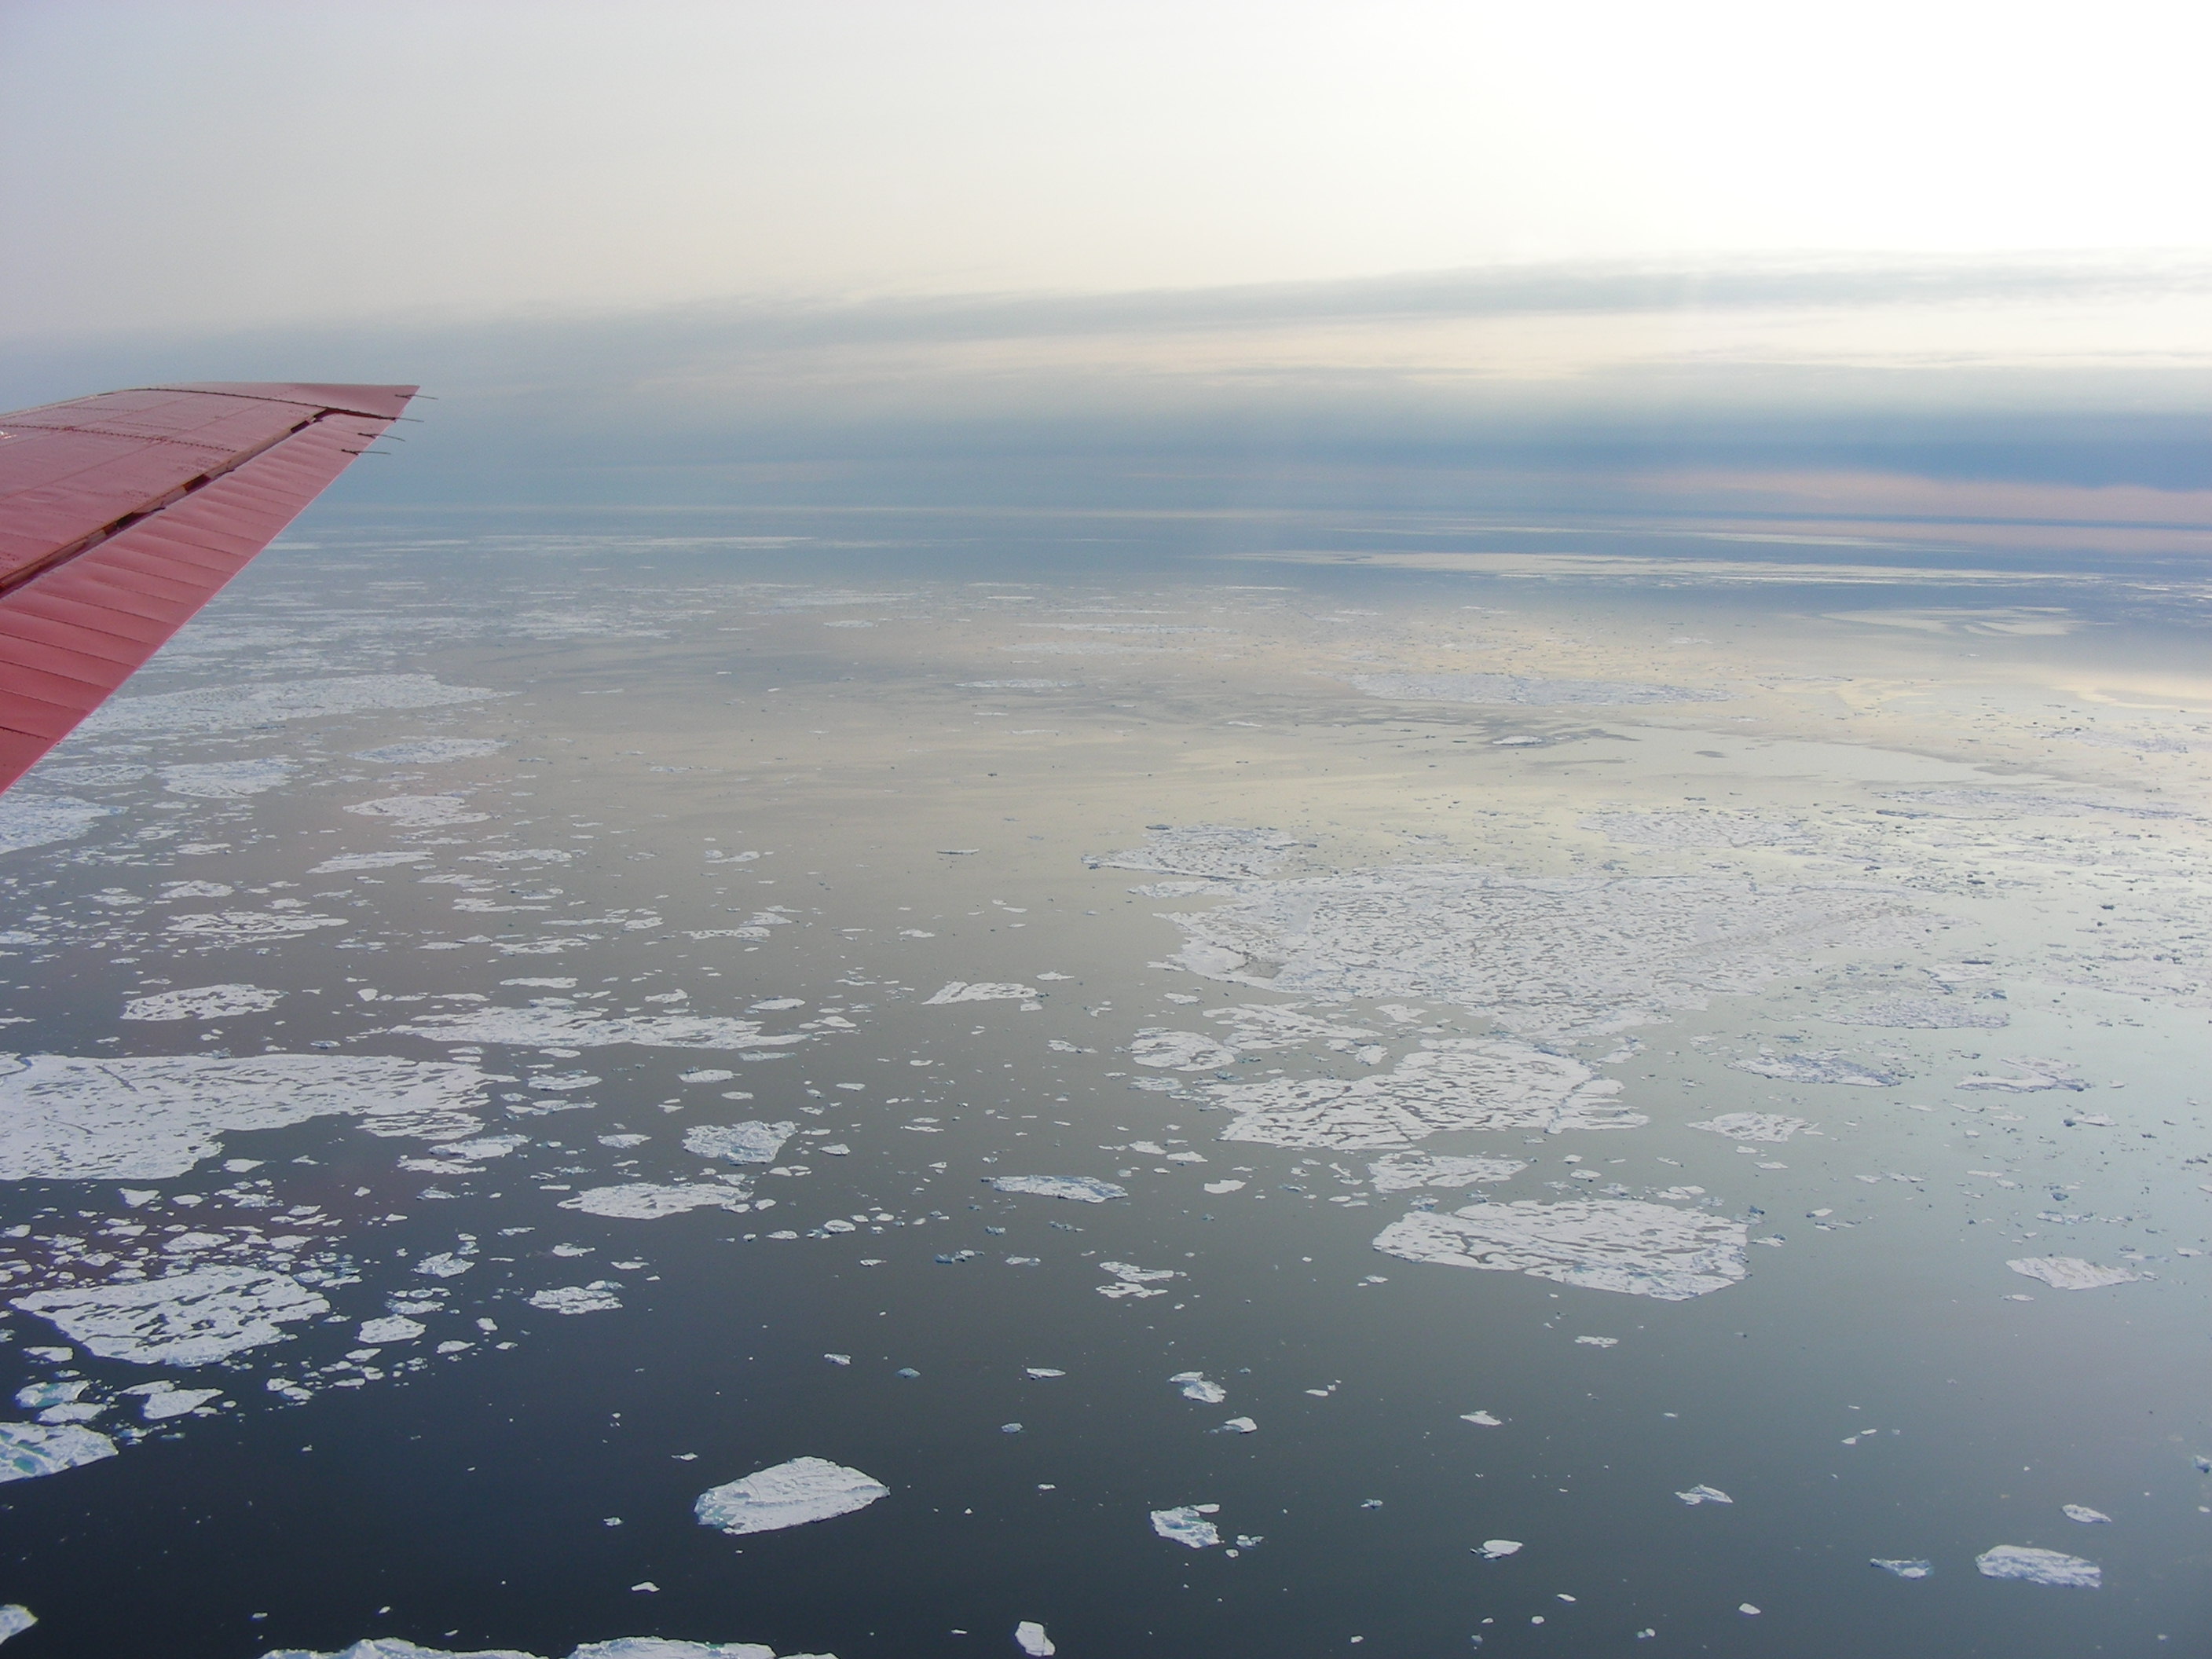
The open waters off the northeast coast of Greenland were part of the so-called Wandel Sea Polynya (Photo 1). It chiefly forms in summer, when strong offshore winds drive the sea ice away from the northeast coast of Greenland. Last year, an extremely large Wandel Sea Polynya offered the research icebreaker Polarstern an easy and rapid transit to the North Pole during the last leg of the MOSAiC expedition. This year the summertime phenomenon was somewhat smaller. Nevertheless, as Belter and his AWI colleague Dr Gerit Birnbaum observed, especially the floes in the marginal ice zone were extensively covered with meltwater ponds; many were so riddled with them that they could hardly even be called floes.
The farther north the measuring flights went, the thicker the ice cover became. That being said, the mean thickness of the ice measured was only 1.71 metres. Compared to the long-term statistics from the IceBird summer campaign, that’s a new record low, as Belter reports for the sea-ice portal here. In contrast, the most frequently measured (modal) ice thickness, at 1.47 metres, was quite similar to the values from the past several years. “That tells us that the ice measured at the end of the Transpolar Drift in summer 2021 experienced comparatively little deformation, which is highly relevant for ongoing studies,” the AWI expert explains.
Even the old sea ice is showing signs of decay
AWI sea-ice biologists Dr Hauke Flores and Dr Nicole Hildebrandt spent the last few weeks of the Arctic summer 2021 on board the Swedish research icebreaker “Oden”. The expedition “Synoptic Arctic Survey” took the ship and her crew from Svalbard to the Nansen and Amundsen Basins, then to the North Pole, and from there over the Lomonosov Ridge into the Canada Basin and the waters north of Greenland. “At the 13 ice stations where we’ve taken samples so far, we’ve mostly found two-year-old ice with thicknesses of between 1.5 and 2 metres,” summarises Hauke Flores in an email from on board the ship.
In the region north of Greenland, the experts encountered multiyear ice with thicknesses up to three metres. “Even in this relatively thick, old ice the rapid changes in the Arctic were painfully apparent. 40 to 60 percent of its surface was covered with meltwater ponds. We also observed how it released large flakes of organic material that, a few years ago, had begun growing on its underside,” writes Flores. He and his team collected biological and biogeochemical samples from this older ice. According to the sea-ice biologist: “This material will form the basis for documenting and understanding the dramatic changes in the Arctic ecosystem, and one day our ice samples may help to create an archive of biodiversity in the ‘old’ Arctic.”
For AWI sea-ice expert Christian Haas, these various signs indicate that the transformation of the Arctic is progressing, even if there was no dramatic sea-ice retreat this summer. “There’s no reason to breathe a sigh of relief. We’ve seen first-hand the various effects of melting and drifting on the sea-ice extent and thickness, and taken together, the signs of climate warming in the Arctic are clearly visible,” he says, summarising the 2021 melting season.
Haas can support his conclusion not only with data, but also with years of personal impressions from the Arctic: he was part of the team that, 30 years ago this month (on 7 September 1991), took the first sea-ice thickness measurements in the Arctic for the AWI – on the German research icebreaker Polarstern’s first voyage to the North Pole. “Back then, the smooth, undeformed ice at the North Pole was 2.86 metres thick on average – roughly twice as thick as today,” he recalls.
Contacts
- Prof Christian Haas
- Dr Monica Ionita-Scholz
- Dr Lars Kaleschke
- Dr Gunnar Spreen
- Dr Klaus Grosfeld
- Dr Renate Treffeisen
- Dr Jakob Belter
Questions?
Contact us via E-Mail or our contact form.
Graphics


 and monthly mean values in the Arctic from 2005 to 15 September 2021.")


 and monthly mean values in the Arctic from 2005 to 15 September 2021.")

[Translate to English:]
