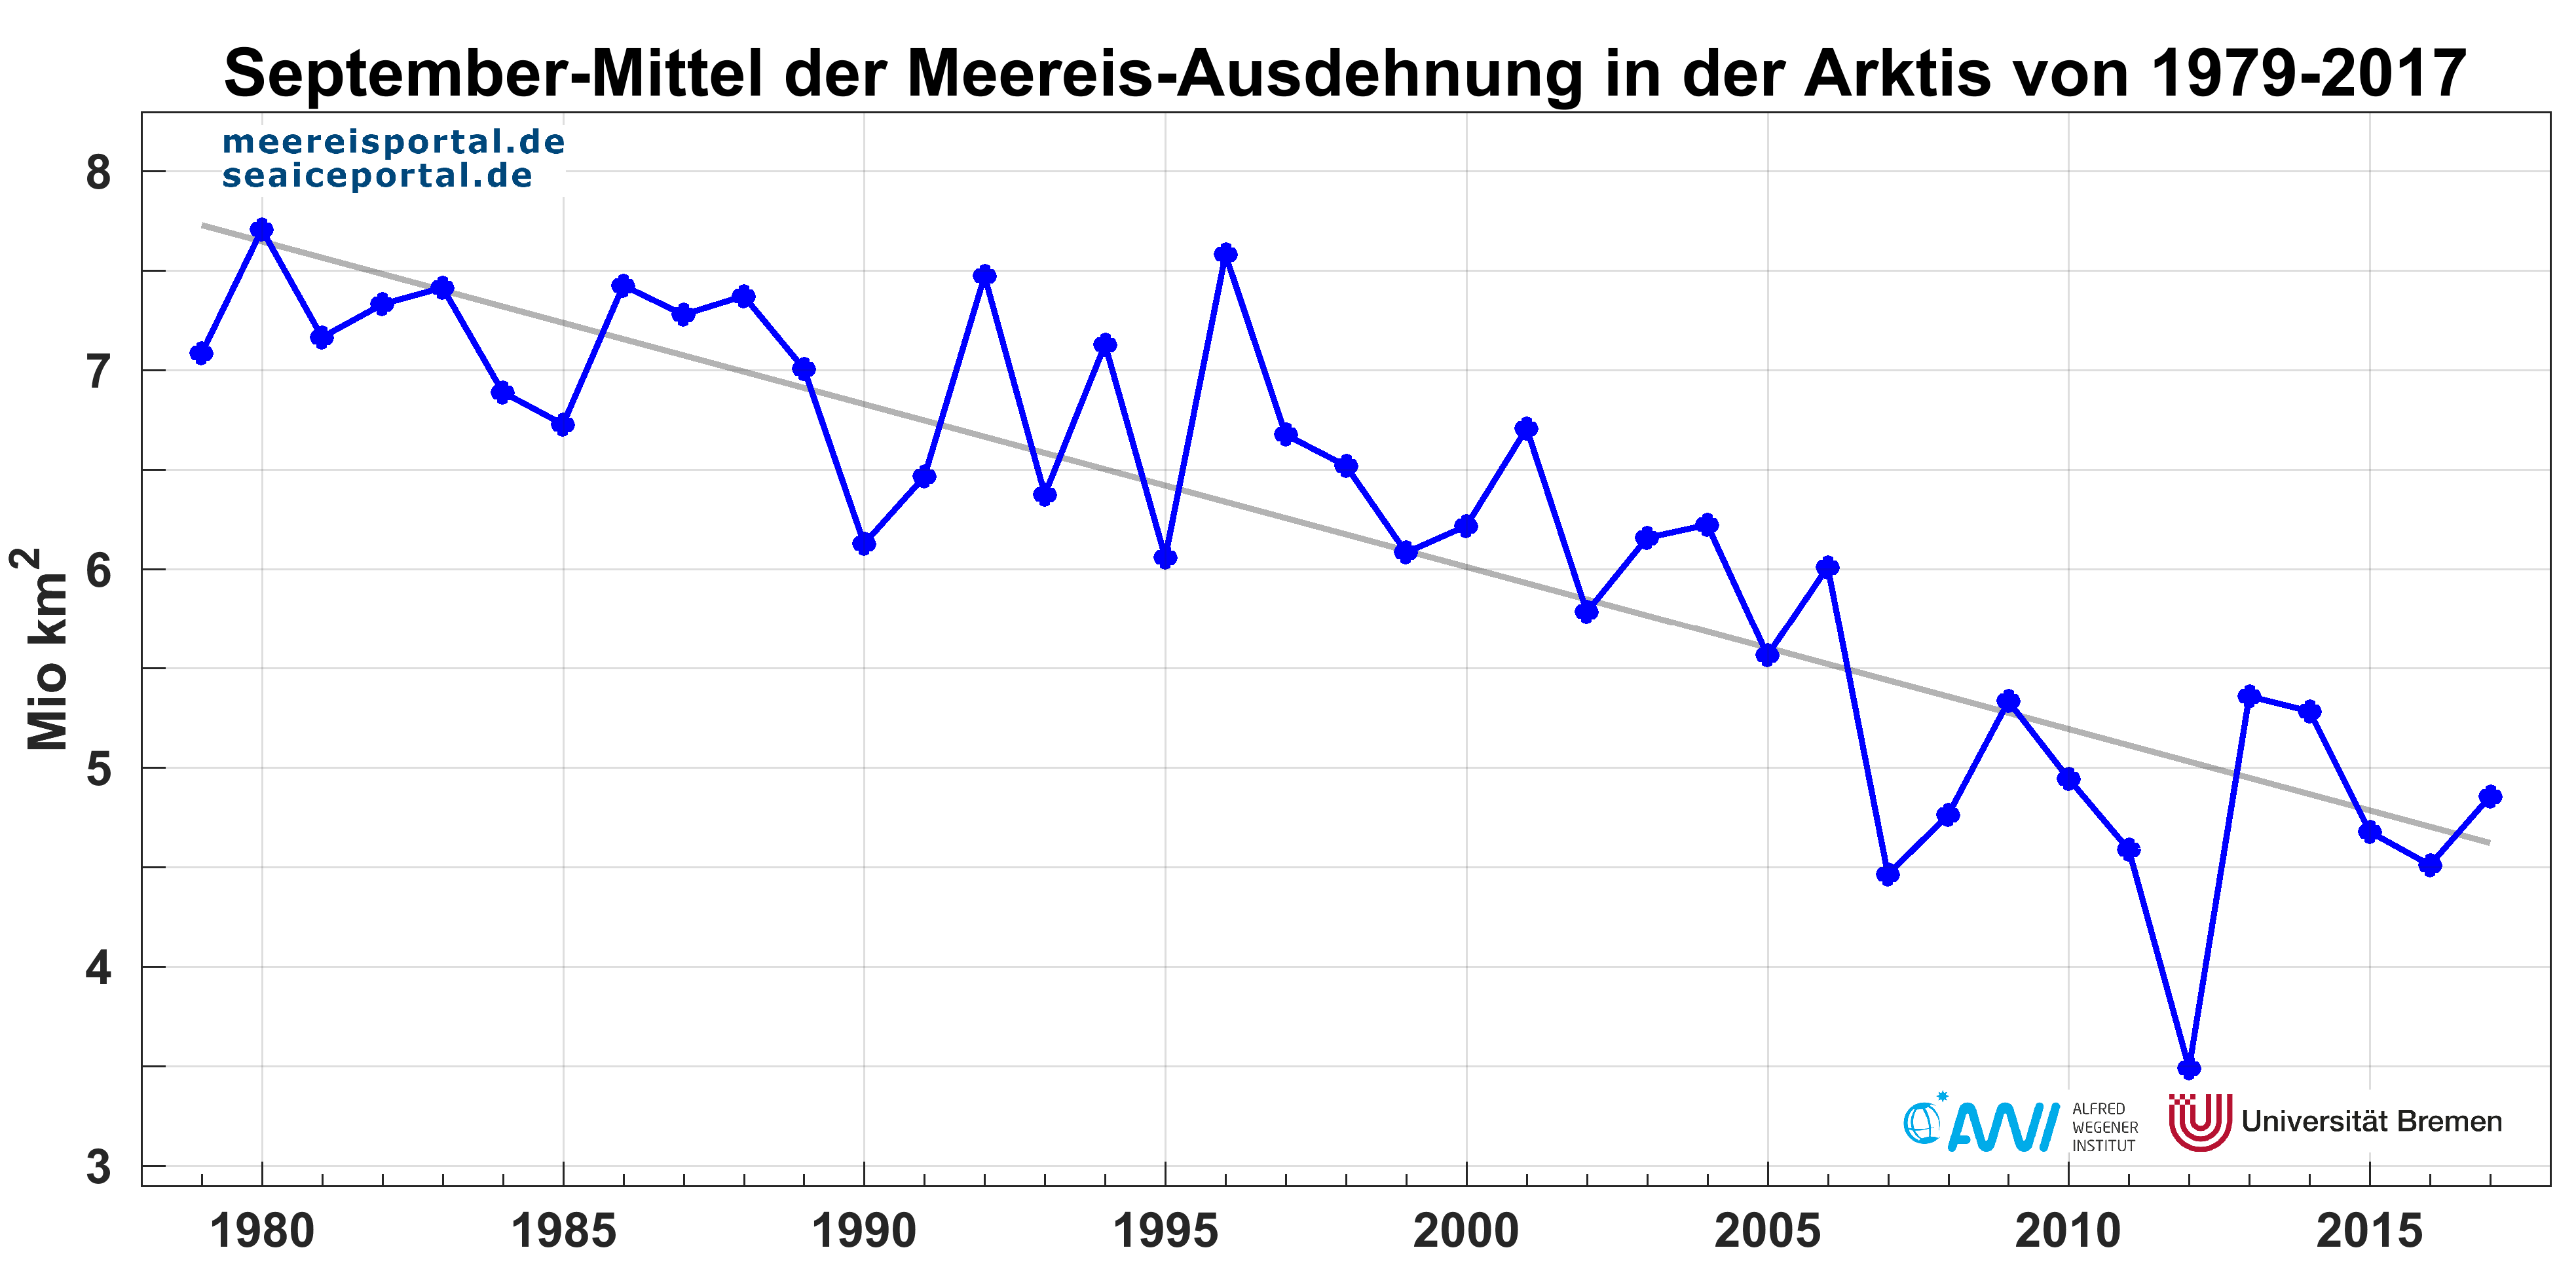
The decline in summertime sea-ice in the Arctic is an important indicator for the progressive climate change and its effects on the polar regions of the Northern Hemisphere. Since the advent of continuous satellite monitoring in 1979, the September sea-ice cover in the Arctic has lost an average of ca. 13.3 % per decade in relation to the long-term mean for the years 1981 to 2010, and has shrunk from ca. 7.5 million km² to an average extent of ca. 4.6 million km² (Fig. 1).
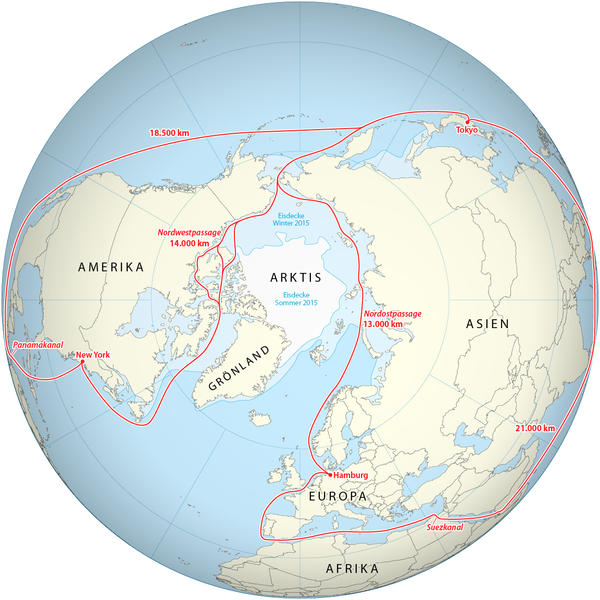
Though this sea-ice retreat will above all have dramatic consequences for the climate and ecosystem of the Arctic and beyond, it also opens new avenues in the form of potential shipping routes for container and cargo ships, as well as tourist routes between the North Atlantic and North Pacific. Here the classic routes are the Northwest and Northeast Passages, which traverse the Arctic Ocean and marginal coastal seas (Fig. 2). For example, a container ship underway from Hamburg to Tokyo could, instead of taking the 21,000-kilometre-long classic route through the Suez Canal, opt for an alternative route through the Northeast Passage, Barents, Kara, Laptev , East Siberian and Chukchi Seas to the Bering Strait, which would only be 13,000 kilometres long. Similarly, a ship outbound from New York could, instead of following an 18,500-kilometre-long route through the Panama Canal, pass through the Davis Strait, Canadian Arctic Archipelago, Beaufort Sea and Bering Strait into the North Pacific, reaching its destination in only 14,000 kilometres. These new routes could save a great deal of fuel and time alike – crucial factors in today’s fast-paced global commerce. While only few ships braved the “Northern Sea Routes” in 2010, more than 60 were recorded in 2013 (Northern Sea Route Information Office; National Snow and Ice Center, Cosco, Lloyd’s List). Current projections indicate that, by 2030, roughly 25 % (more than 2,000 ships) of commercial container shipping between Asia and Europe will utilise the Northern Sea Routes. If this comes to pass, it will require substantial investments in new ships, and in the Arctic infrastructure.
But how safe are these shipping routes in terms of the ice, and can we already make predictions regarding sea-ice for the Northwest and Northeast Passages? Can we already provide reliable forecasts for the navigability of the Northern Sea Routes on a timeframe of several months, to enable shipping with the lowest possible risk?
These and other questions are being explored by the sea-ice modelling group at the Alfred Wegener Institute (AWI). Dr Frank Kauker, who works at the AWI’s Sea-Ice Physics section and is a co-developer of the sea-ice ocean model NAOSIM, has been preparing sea-ice forecasts in the context of the ‘Sea Ice Outlook’ since 2008. As he explains, “The goal of the SIO is to forecast the summertime ice conditions, from the beginning of the melting season in late May. In late June and late July the forecasts are updated and released as the SIO for June, July and August. Roughly 30 international groups take part in the SIO, including ten that also produce regional forecasts.” Since there are still no reliable seasonal forecasts for the atmosphere in the Arctic, NAOSIM uses the summertime atmospheric conditions from the previous decade to create an ensemble consisting of ten individual simulations (“ensemble members”). The forecast is based on the mean value for ice conditions from the entire ensemble, and the degree of uncertainty can be calculated using the statistical spread of ice conditions in the ensemble.
The quality of the forecasts was significantly improved in 2015 with the addition of satellite-based observations in March and April of the respective year (https://www.the-cryosphere-discuss.net/tc-2015-171). These observations include sea-ice thickness measurements, which the AWI creates with the aid of the CryoSat-2 satellite, sea ice concentrations and sea-surface temperatures from OSI SAF (http://www.osi-saf.org/), as well as data on snow thickness from the University of Bremen (https://seaice.uni-bremen.de/sea-ice-concentration). Thanks to these observations, the margin of error for forecasting the pan-Arctic September sea-ice extent was roughly halved, and is currently ca. 0.3 million km².
The forecasting method also allows the creation of regional forecasts, though it should be kept in mind that they are more experimental in nature than the overall sea-ice-extent forecast. There are a number of reasons for this: the quality of the sea-ice ocean model, which only has a resolution of ca. 50 km in this application and also involves processes that aren’t yet fully understood (e.g. sea-ice ridging); the quality of the atmospheric drives, which cannot be accurately assessed due to the very small number of in-situ observations above the sea ice (though there are major research efforts to improve this situation, coordinated in the ‘Year of Polar Predictions’ (YoPP)); and the quality of the satellite-assisted observations, which currently have a resolution of ca. 25 km and which similarly cannot be accurately assessed due to the small number of in-situ observations (here, too, observation programmes are underway, esp. the Multidisciplinary drifting Observatory for the Study of Arctic Climate (MOSAiC, http://www.mosaicobservatory.org/)).
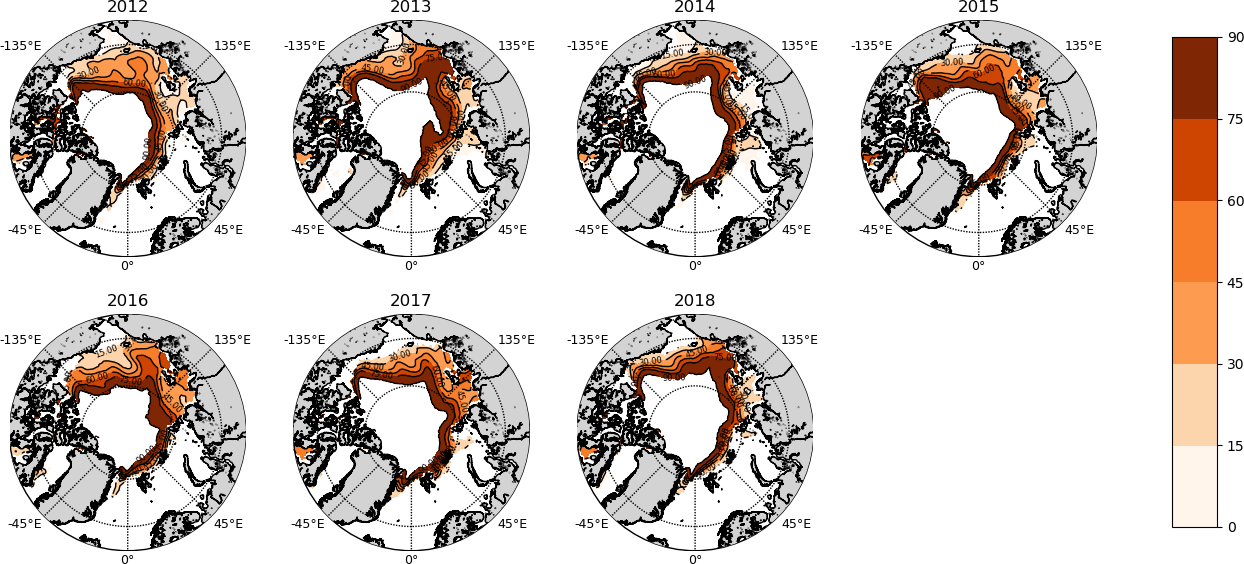
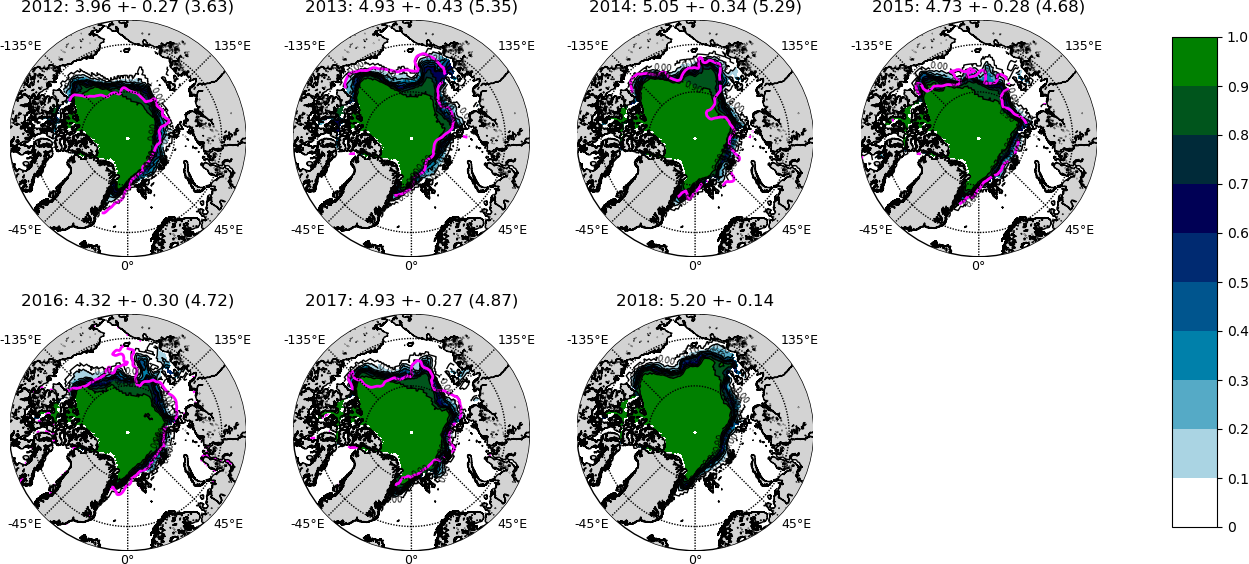
Nevertheless, for the past several years, regional forecasts have also been submitted to the SIO. In this regard, it has become clear that the AWI forecasts fared well in international comparison (see e.g. Figures 11 to 13 in the SIO Annual Report 2017). The maps in Figure 3 show the probability of the mean September ice concentration surpassing 15 % for the years 2012 to 2018. All forecasts were started in early July (July SIO). They also show the position of the 15 % sea-ice concentration contour line, derived from the satellite-based observations, for the years 2012 to 2017. However, the regional forecasts for 2012 to 2014 are not completely independent of the summertime conditions, since the forecasting system employs what are referred to as a bias correction, which is calculated with the aid of the September sea-ice conditions for 2012 to 2014. The bias correction does not change with time. A perfect forecast would theoretically have a probability of 1 within the observed 15 % contour line. It can be seen that, generally speaking, the regional forecast is of good quality. If we accepted the limitation of the bias correction, the system would even be capable of accurately describing the all-time minimum in 2012. It can also be clearly seen that, in 2012, the Northeast Passage was predicted to be readily navigable; the same is true of the northern part of the Northwest Passage. In this regard it should be kept in mind that making forecasts for the narrow straits of the Canadian Arctic Archipelago is especially difficult and should not be considered. Good navigability was also forecast for the years 2014, 2015 and 2017, whereas much higher likelihoods of sea ice in the Northwest Passage north of the East Siberian Sea were predicted for the years 2013 and 2017. The current forecast for September 2018 shows the highest probability of sea ice in this area in the past several years. A further measure of how ice-free the passages will be is the first day of the year characterised by ice-free conditions (sea-ice concentrations of less than 15 %). This day, too, varies widely from year to year, and is shown in Figure 4. While for 2012 the majority of areas that would be ice-free by September are predicted as being ice-free starting in July or August at the latest, the start of ice-free conditions is projected as coming much later for 2013 and 2014. According to the current forecast for 2018, in many areas ice-free conditions will only begin much later.
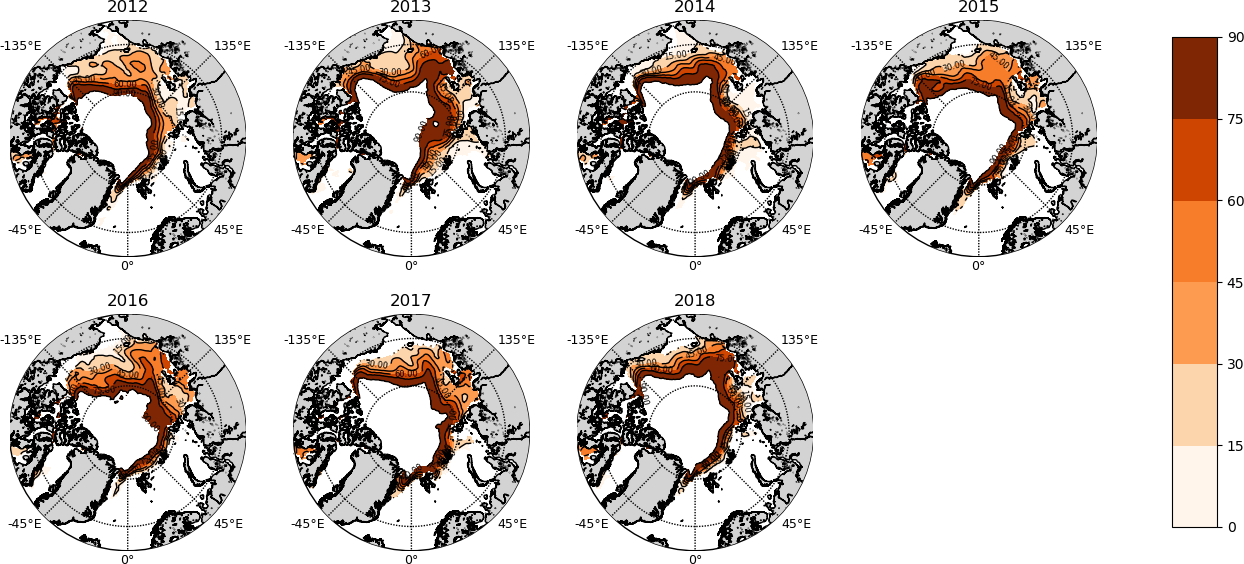
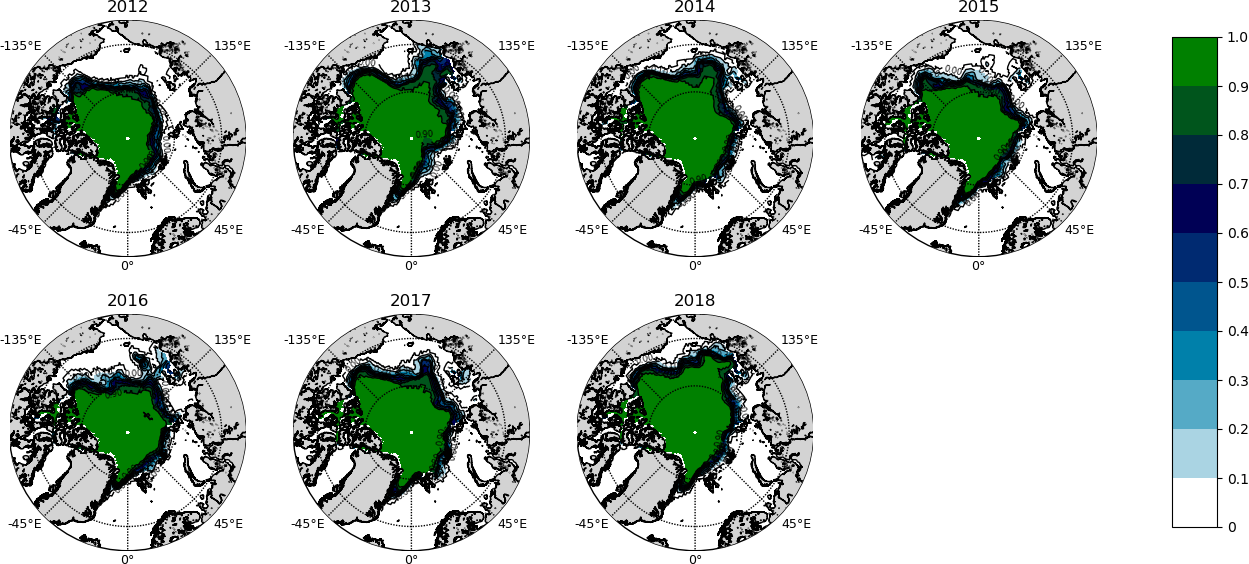
Although the probability of a sea-ice concentration below 15 % is used in the SIO, it’s actually poorly suited as an indicator of navigability in the region. A far more important aspect is the presence of thick ice, since it can trap ships or, in the worst-case scenario, even sink them. Figure 5 shows the probability of ice thicknesses surpassing 0.5 m. The value 0.5 m was selected because even ships with the lowest ice class are considered to be capable of breaking through this thickness. Generally speaking, the probabilities are very similar to those shown in Figure 3. However, north of the East Siberian Sea, they are often significantly higher.
The latest forecast for 2018 also advises caution in this passage. Unfortunately, it’s not possible to compare the forecast with the actually observed sea-ice thicknesses, since there are no consistent sea-ice thickness observations for the month of September. Analogous to the first ice-free day in Figure 4, Figure 6 depicts the first ‘navigable’ day (mean ice thickness of less than 0.5 m). Though there are many similarities to the illustration for the first ice-free day, upon closer examination it becomes apparent that the first navigable day often comes later in the year. Despite all of the remaining uncertainties, today’s seasonal ice conditions forecasts can contribute to the safe transport of goods and passengers. Planning voyages by ship often takes months, and forecasts for the mean ice thickness and first navigable day could offer valuable support. For example, this year safety is a much greater concern with regard to the Northeast Passage than it was e.g. in 2012. Needless to say, seasonal forecasts are no substitute for topical, high-resolution sea-ice forecasts based on special-purpose remote satellite sensing like Synthetic Aperture Radar (see e.g.http://driftnoise.com/data-portal/and the ESA project PRIIMA). The latter can depict the current sea-ice conditions and generate forecasts covering a handful of days with a resolution of ca. 100 m. “However, within the next few years seasonal forecasts could substantially support better planning for Arctic shipping passages, and by doing so contribute to safer transport through the Arctic,” says Frank Kauker, summarising the value of long-term forecasting products.
Addiotional literature
Kauker, F., Kaminski, T., Ricker, R., Toudal-Pedersen, L., Dybkjaer, G., Melsheimer, C., Eastwood, S., Sumata, H., Karcher, M., and Gerdes, R.: Seasonal sea ice predictions for the Arctic based on assimilation of remotely sensed observations, The Cryosphere Discuss., 9, 5521-5554, doi.org/10.5194/tcd-9-5521-2015, 2015.
Contacts
Questions?
Contact us via E-Mail or our contact form.
Graphics


