Sea ice is one of the most important components in the Arctic climate system. It is in a state of constant interchange with the atmosphere and the ocean, and its physical characteristics, especially its bright surface and resultant high albedo, have a major influence on the energy balance at the ocean’s surface. In order to monitor, understand and even predict changes in Arctic sea-ice cover and especially its thickness, sea-ice thickness time series are indispensable.
Although satellite-based observation provides impressive spatial resolution with regard to the ice cover, when it comes to measuring ice thickness, it offers comparatively low chronological resolution (weekly and monthly means) and is prone to certain inaccuracies. As such, further improving the analysis and interpretation of satellite data calls for direct and local ice-thickness measurements, gathered over periods that are as long as possible.
Long-term ice-thickness monitoring on site
Sensors installed on moorings and facing upward, referred to as Upward-Looking Sonars (ULSs), are capable of providing extremely precise long-term observations of the ice thickness. How it works: the ULS emits a brief acoustic signal upward, which is reflected back by the underside of the ice. The ULS records how long it takes for the reflected signal to get back to it and, by combining this with information on the water’s characteristics and the depth at which the ULS is installed, can determine how much of the ice is below the water’s surface, also known as its ‘draft’ (Figure 1, left).
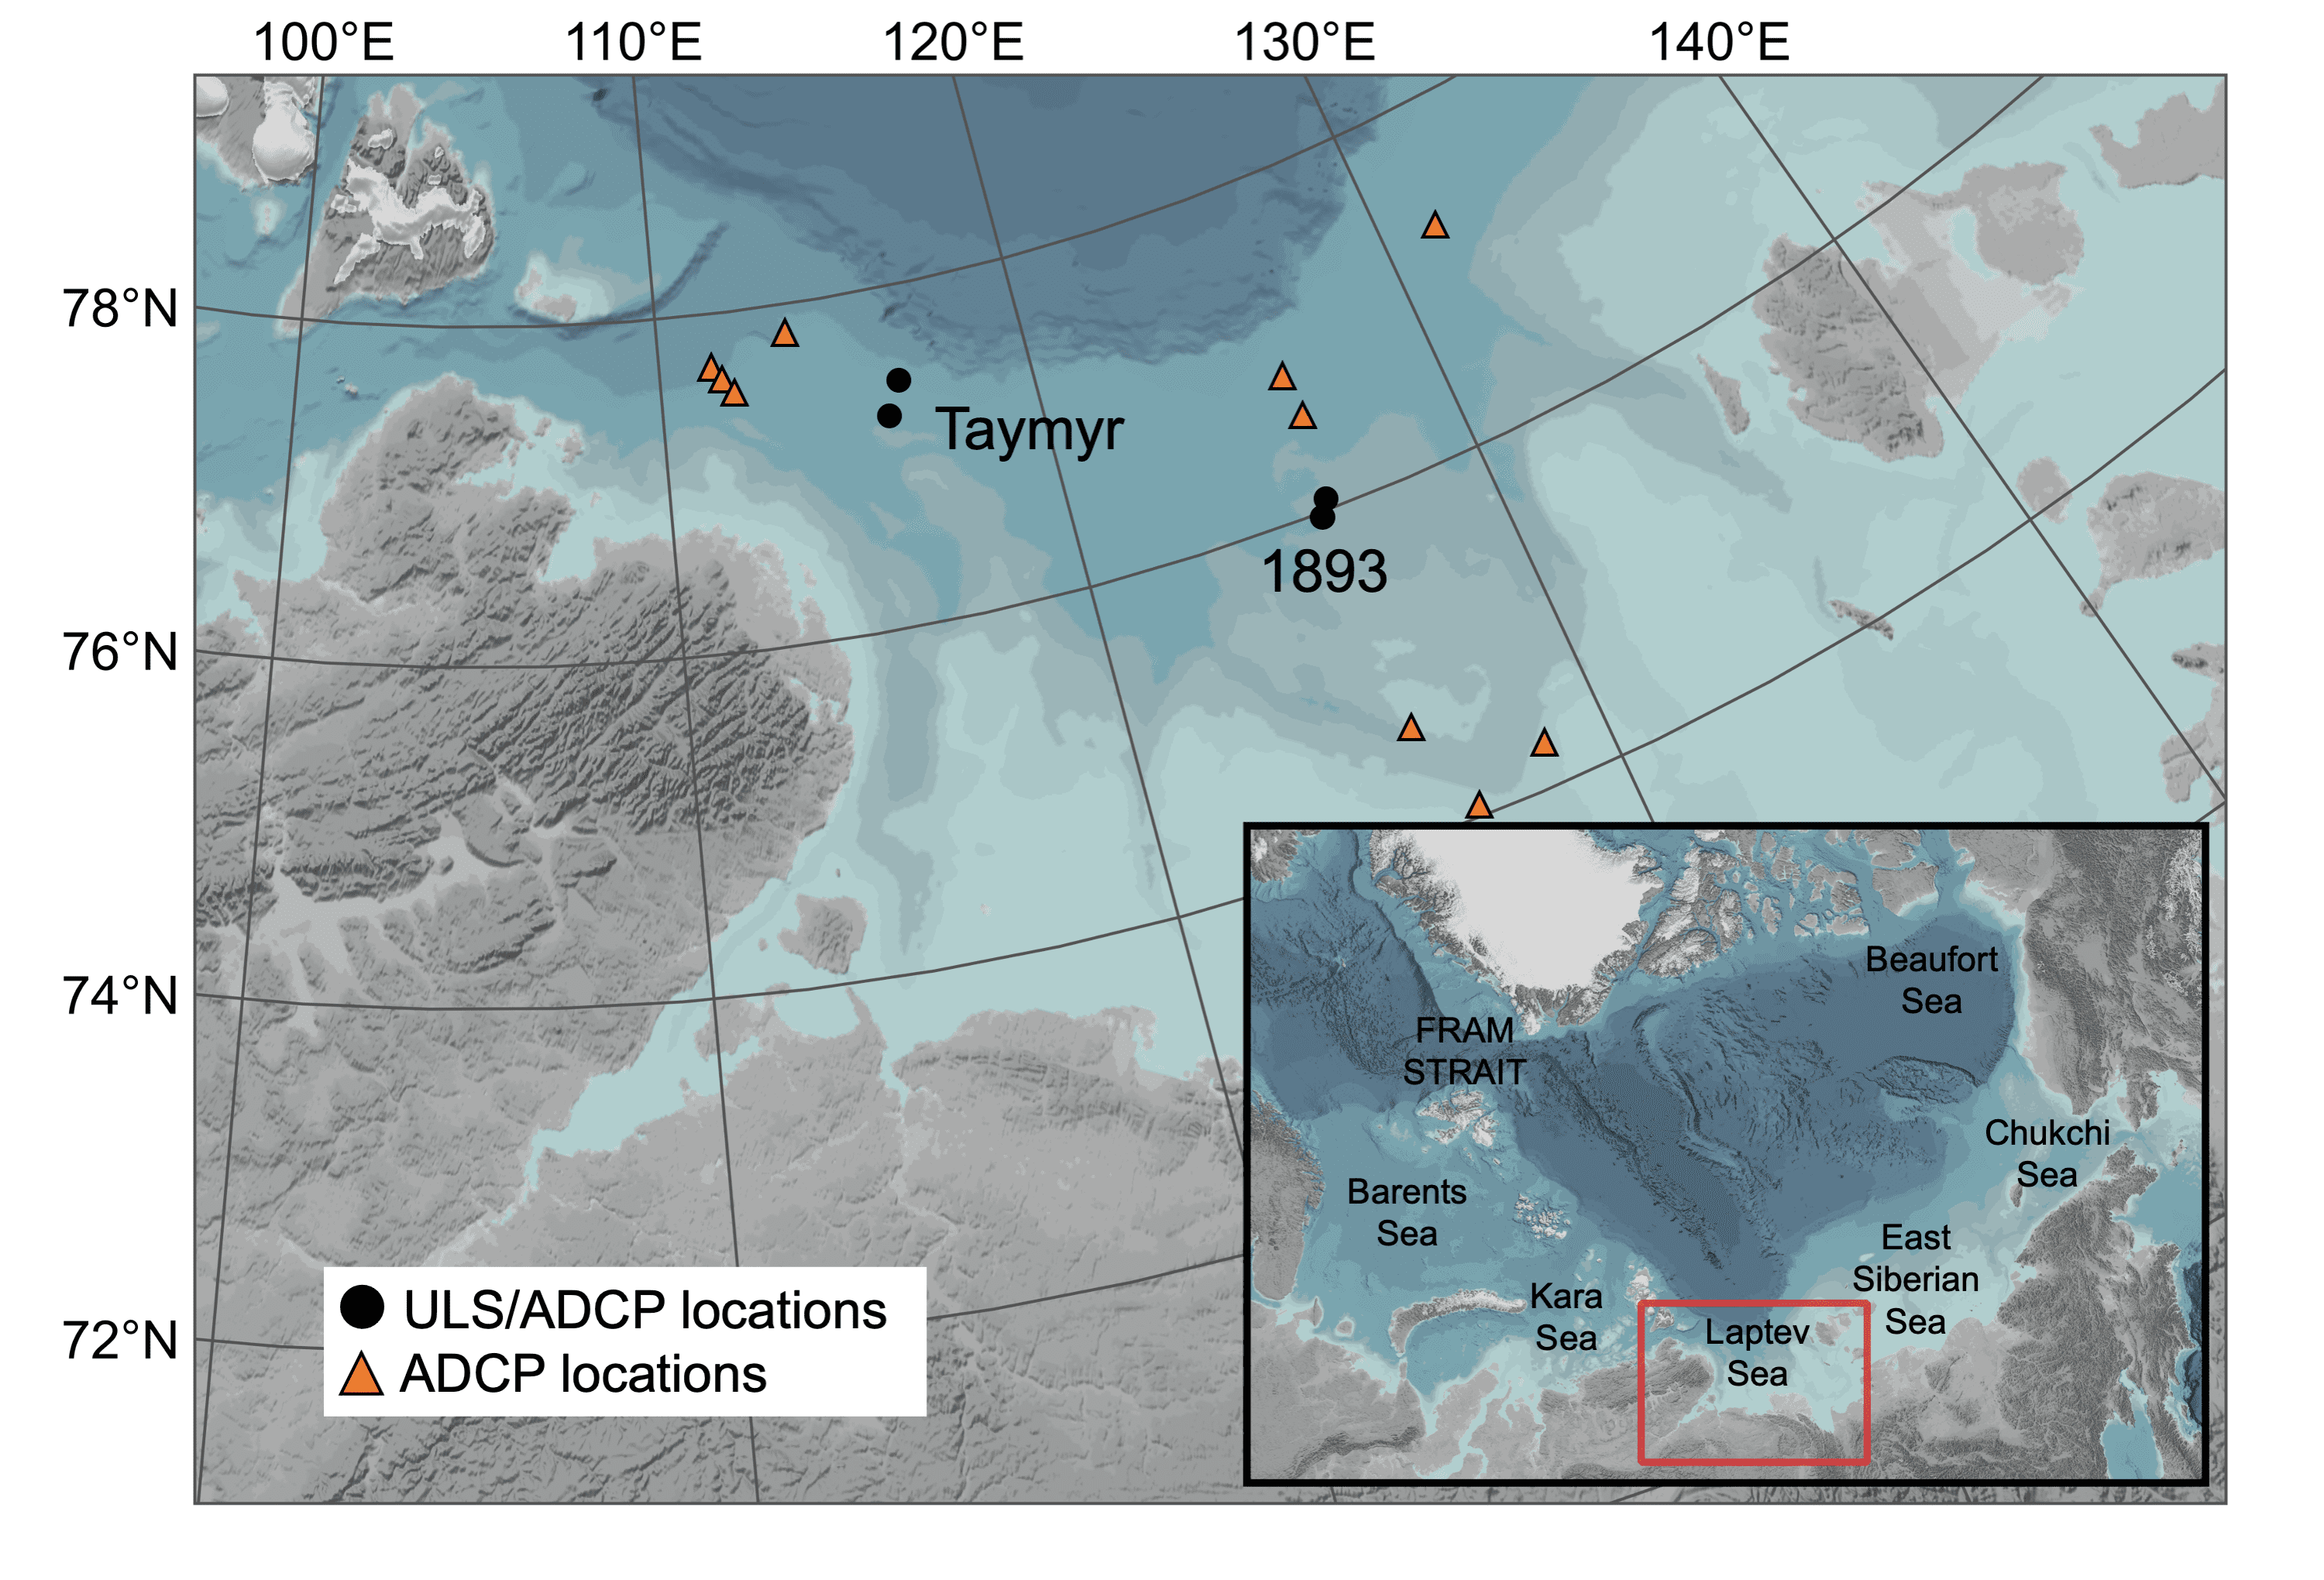
Over the past few decades, many of these moorings have been deployed, particularly in the fairly accessible regions of the Arctic, and have provided a steady supply of valuable data for comparison with various satellite-based ice-thickness products ever since. These ‘fairly accessible’ places particularly include those regions in which the ice is the oldest and therefore most often the thickest (north of Canada and in Fram Strait, to the northeast of Greenland, see small map in Figure 2).
There have never been any comparable ice-thickness time series e.g. for regions like the Laptev Sea, where the majority of Arctic ice is formed. Due to the region’s remoteness and the limited resources for research projects in the Laptev Sea, to date experts from the Alfred Wegener Institute, Helmholtz Centre for Polar and Marine Research (AWI) have only been able to deploy ULS moorings between 2013 and 2015. And although the data these moorings provide is extremely valuable, they alone are insufficient to produce the long time series needed for model-based studies and comparisons with satellite data.
Pooling expertise
In order to overcome this shortcoming and the huge chronological gaps in the ice-thickness time series for this region – one that is essential for ice formation – researchers from the AWI’s Sea Ice Physics and Physical Oceanography sections joined forces with anchored-sonar developers.
Their focus was especially on developing new methods that would allow ice information from existing datasets and past expeditions to not only be extracted, but also be ‘recycled’ for use in future projects. “We didn’t just want to find out what certain oceanographic monitoring devices were built for, but also and especially, what else they were capable of doing,” explains Dr Jakob Belter, one of the participating experts and first author of the two corresponding studies released by the Alfred Wegener Institute (Belter et al., 2020; Belter et al., 2021).
In the past, the oceanographic readings taken in the Laptev Sea chiefly concerned temperature, salinity, density and ocean currents. The acoustic current monitors, or Acoustic Doppler Current Profilers (ADCPs), in particular were designed for creating vertical current-speed profiles but use the same concept as ULSs in order to do so (Figure 1, right).
The fact that ADCPs and ULSs were both installed in the Laptev Sea from 2013 to 2015 allowed the researchers to develop a method that could not only gauge the ice thickness using ADCP data but could also directly compare that data to the readings from devices specifically designed for measuring ice draft, for purposes of validation (publication: Belter et al., 2021). Thanks to their innovative method, the researchers were able to analyse ‘old’ datasets from ADCPs moored in the Laptev Sea from a completely new standpoint. The resulting time series (2002 to 2017) offers not only new insights into ice-thickness variability in the Laptev Sea but also an unprecedented basis of data for improving and refining satellite-based ice-thickness products (publication: Belter et al., 2020).
Summary
Beyond the two studies’ scientific findings, the experts’ approach clearly shows two things: first, that exchanges and collaborations between monitoring device manufacturers and individual disciplines of climate and polar research are essential for research and can ideally yield unexpected but valuable new insights. And second, especially in an era in which sustainability continues to grow in importance for public debates, the scientific community is called upon more than ever before to devise new and sustainable methods, and to gather the information we need in order to better understand and preserve our climate system. In this regard, the newly developed ice-thickness monitoring method represents an important contribution, as it not only allows ‘old’ sonar data from the Laptev Sea to be reused, but also offers an opportunity to close similar data gaps in the Arctic and Antarctic. According to Belter: “It also shows the potential of using ADCPs to monitor ice thickness in the future and tells us that our devices aren’t suitable for just one specific job; they can often do much more. We have to re-examine the devices’ intended uses from another perspective and recycle the data they produce.”
Publications
- Belter, H. J., T. Krumpen, S. Hendricks, J. Hoelemann, M. A. Janout, R. Ricker, C. Haas, 2020: Satellite-based sea ice thickness changes in the Laptev Sea from 2002 to 2017: comparison to mooring observations. The Cryosphere 14, 7, 2189-2203, doi.org/10.5194/tc-14-2189-2020
- Belter, H. J., T. Krumpen, M. A. Janout, E. Ross, C. Haas, 2021: An Adaptive Approach to Derive Sea Ice Draft from Upward-Looking Acoustic Doppler Current Profilers (ADCPs), Validated by Upward-Looking Sonar (ULS) Data. Remote Sensing, 13 (21), 4335, doi.org/10.3390/rs13214335
Contact
Graphics


