Ever since, atmospheric researchers Dr Dörthe Handorf and Dr Annette Rinke at the AWI in Potsdam have been searching for concrete evidence of the interrelations between the sea ice, polar air currents, and our weather in Central Europe. To do so, the physicists not only need to gain a better grasp of the interplay between the ice, ocean and atmosphere; they also have to integrate every new detail into their climate models. Thanks to the wealth of data gathered during MOSAiC, their work is now gaining momentum, as the two experts report in the following interview.
meereisportal.de: Ms Handorf, Ms Rinke, in 2012 polar researchers first publicly discussed whether climate change in the Arctic could influence meteorological processes in the middle latitudes. Back then, a record-setting loss of ice in the summer was followed by extremely cold winters across the Northern Hemisphere, and it was surmised that the ice retreat had produced atmospheric changes, allowing polar air masses to penetrate far to the south. Has the scientific community since managed to confirm this hypothesis?
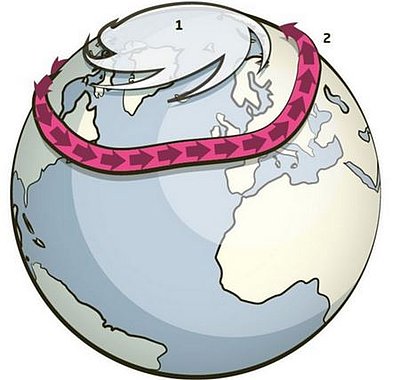
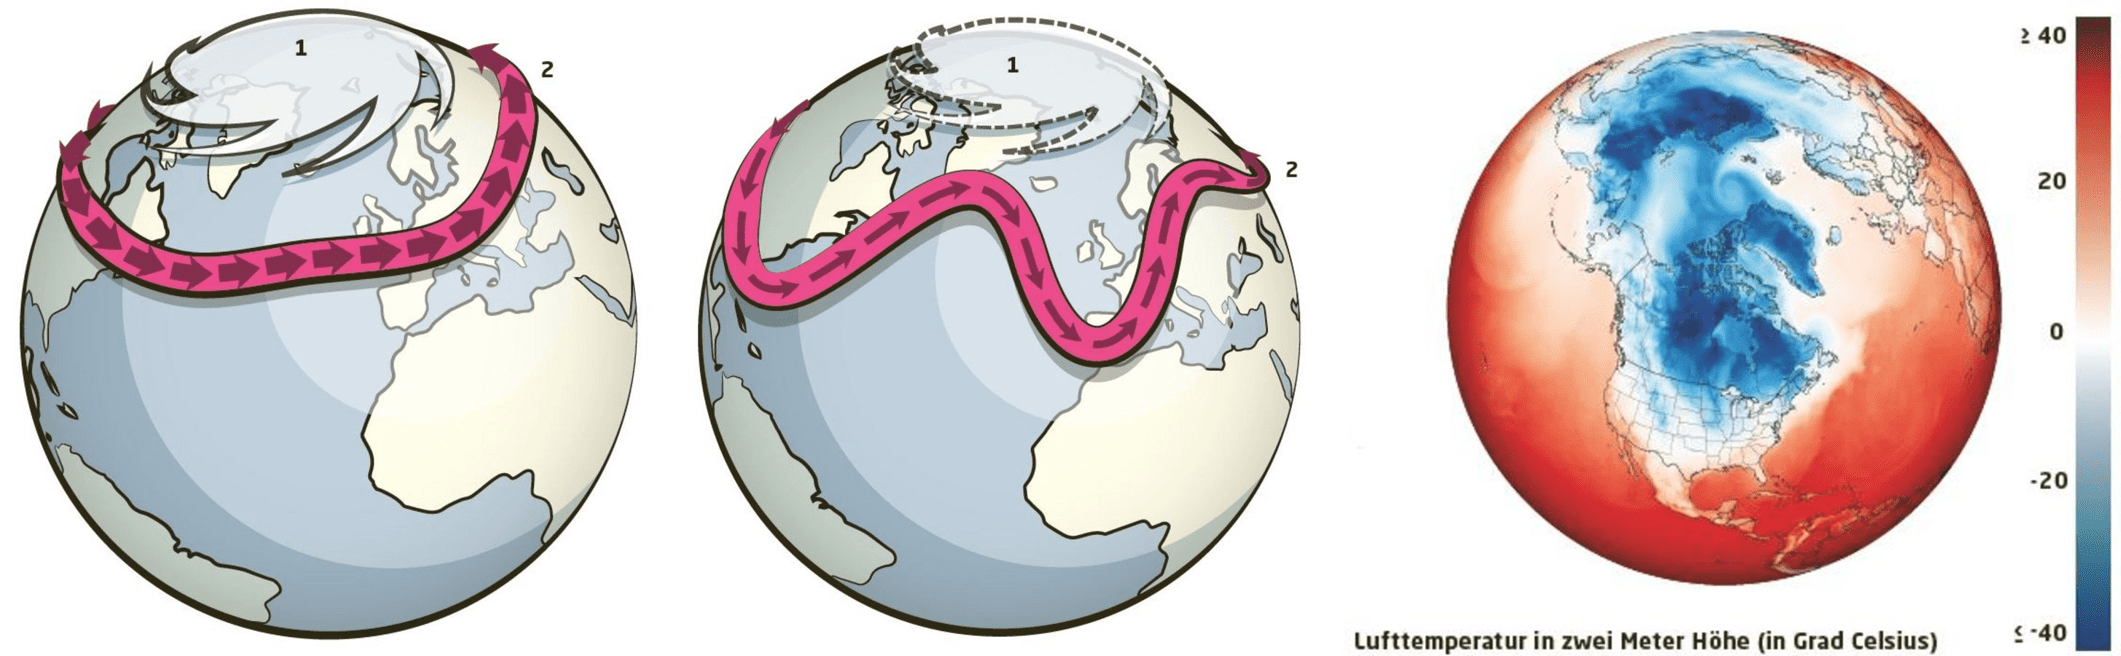
Dörthe Handorf: There is a general consensus that the warming of the Arctic affects the position and intensity of the jet stream. This belt of powerful winds, which whips across the Northern Hemisphere parallel to the Equator at speeds of up to 500 kilometres per hour and separates cold polar air from warm air masses from the south, draws its energy from the substantial temperature difference between the North Pole region and the middle latitudes. But as climate change progresses, the Arctic is warming more intensively than the rest of the planet. As a result, the temperature difference between the high and middle latitudes is decreasing, especially in winter. In other words, the more the Arctic warms, the more the westerly winds that make up the jet stream weaken. Consequently, the jet stream loses momentum and more frequently meanders across the Northern Hemisphere.
… which has direct effects on the weather, right?
Dörthe Handorf: Precisely. When the jet stream loops and curls, it opens the door for two opposing northerly or southerly air-mass movements. Depending on where the ‘peaks’ and ‘valleys’ are located, warm and moist air from the south can make its way over the North Atlantic and western North America, while over Siberia and the rest of North America, cold polar air from the Arctic can reach the middle latitudes, producing snowstorms and frigid temperatures in winter.
Is sea-ice retreat an important factor here?
Annette Rinke: Thanks to the research we’re conducting at the AWI in Potsdam, we’ve known for several years now that such weak phases in the jet stream are produced by a long chain reaction, and that the sea ice is part of it. For example, the jet stream’s intensity and resilience also depend on the stability of the polar vortex, which forms in the Arctic stratosphere (a layer of the atmosphere at ca. 18 to 50 kilometres) in winter. When the polar vortex rotates at full power, the jet stream one ‘storey’ below it also reaches top speed. But when the vortex is disrupted by rising planetary waves, it can also cause the jet stream to falter soon after. These planetary waves are especially pronounced when blocking high-pressure systems form over specific regions. Our studies show: the later in the year the Barents and Kara Seas refreeze, the more frequently blocking high-pressure systems form over Scandinavia and the Urals, leading in turn to an increased spread of planetary waves reaching up to the stratosphere.
Dörthe Handorf: When this chain reaction progresses from beginning to end, we can see a significant influence from the Arctic on the weather in the middle latitudes. But we also now know that this process chain doesn’t always kick in. Three years ago, Norwegian atmospheric researchers used statistical methods to investigate how frequently a late freezing of the Barents and Kara Seas leads to a collapse of the polar vortex in the early winter, and in turn to a weaker jet stream. According to their study, this was only the case in 16 percent of the observations analysed. The probability was higher for individual links in the chain. For instance, if blocking high-pressure systems form over the Urals or Scandinavia in early winter, there’s an 85-percent chance that planetary waves will disrupt the polar vortex in January. As such, there really does seem to be a connection here.
But there are also researchers who claim that the signals for an atmospheric chain reaction between the Arctic and the middle latitudes are nothing more than the product of natural climate variations.
Dörthe Handorf: We’re familiar with this criticism. In fact, how clearly visible the signal for the chain reaction is largely depends on the method used to analyse the observational data. For instance, if you average the observational data on the distribution of high- and low-pressure systems, and on the jet stream, for the entire winter, which is frequently done, our signal from the early winter can easily be overlooked, because very different circulation changes manifest in the late winter. Moreover, the individual components of the climate system influence one another in very chaotic ways. This natural ‘climate noise’ also explains why it’s so difficult to detect process chains like those for the relation between sea-ice retreat in the Barents and Kara Seas on the one hand, and colder winters in Europe and parts of Asia on the other, in observational data and climate model-based studies.
As climate modelling experts, what do you need to concentrate on in your research to gain a better understanding of the weather connection between the Arctic and the middle latitudes?
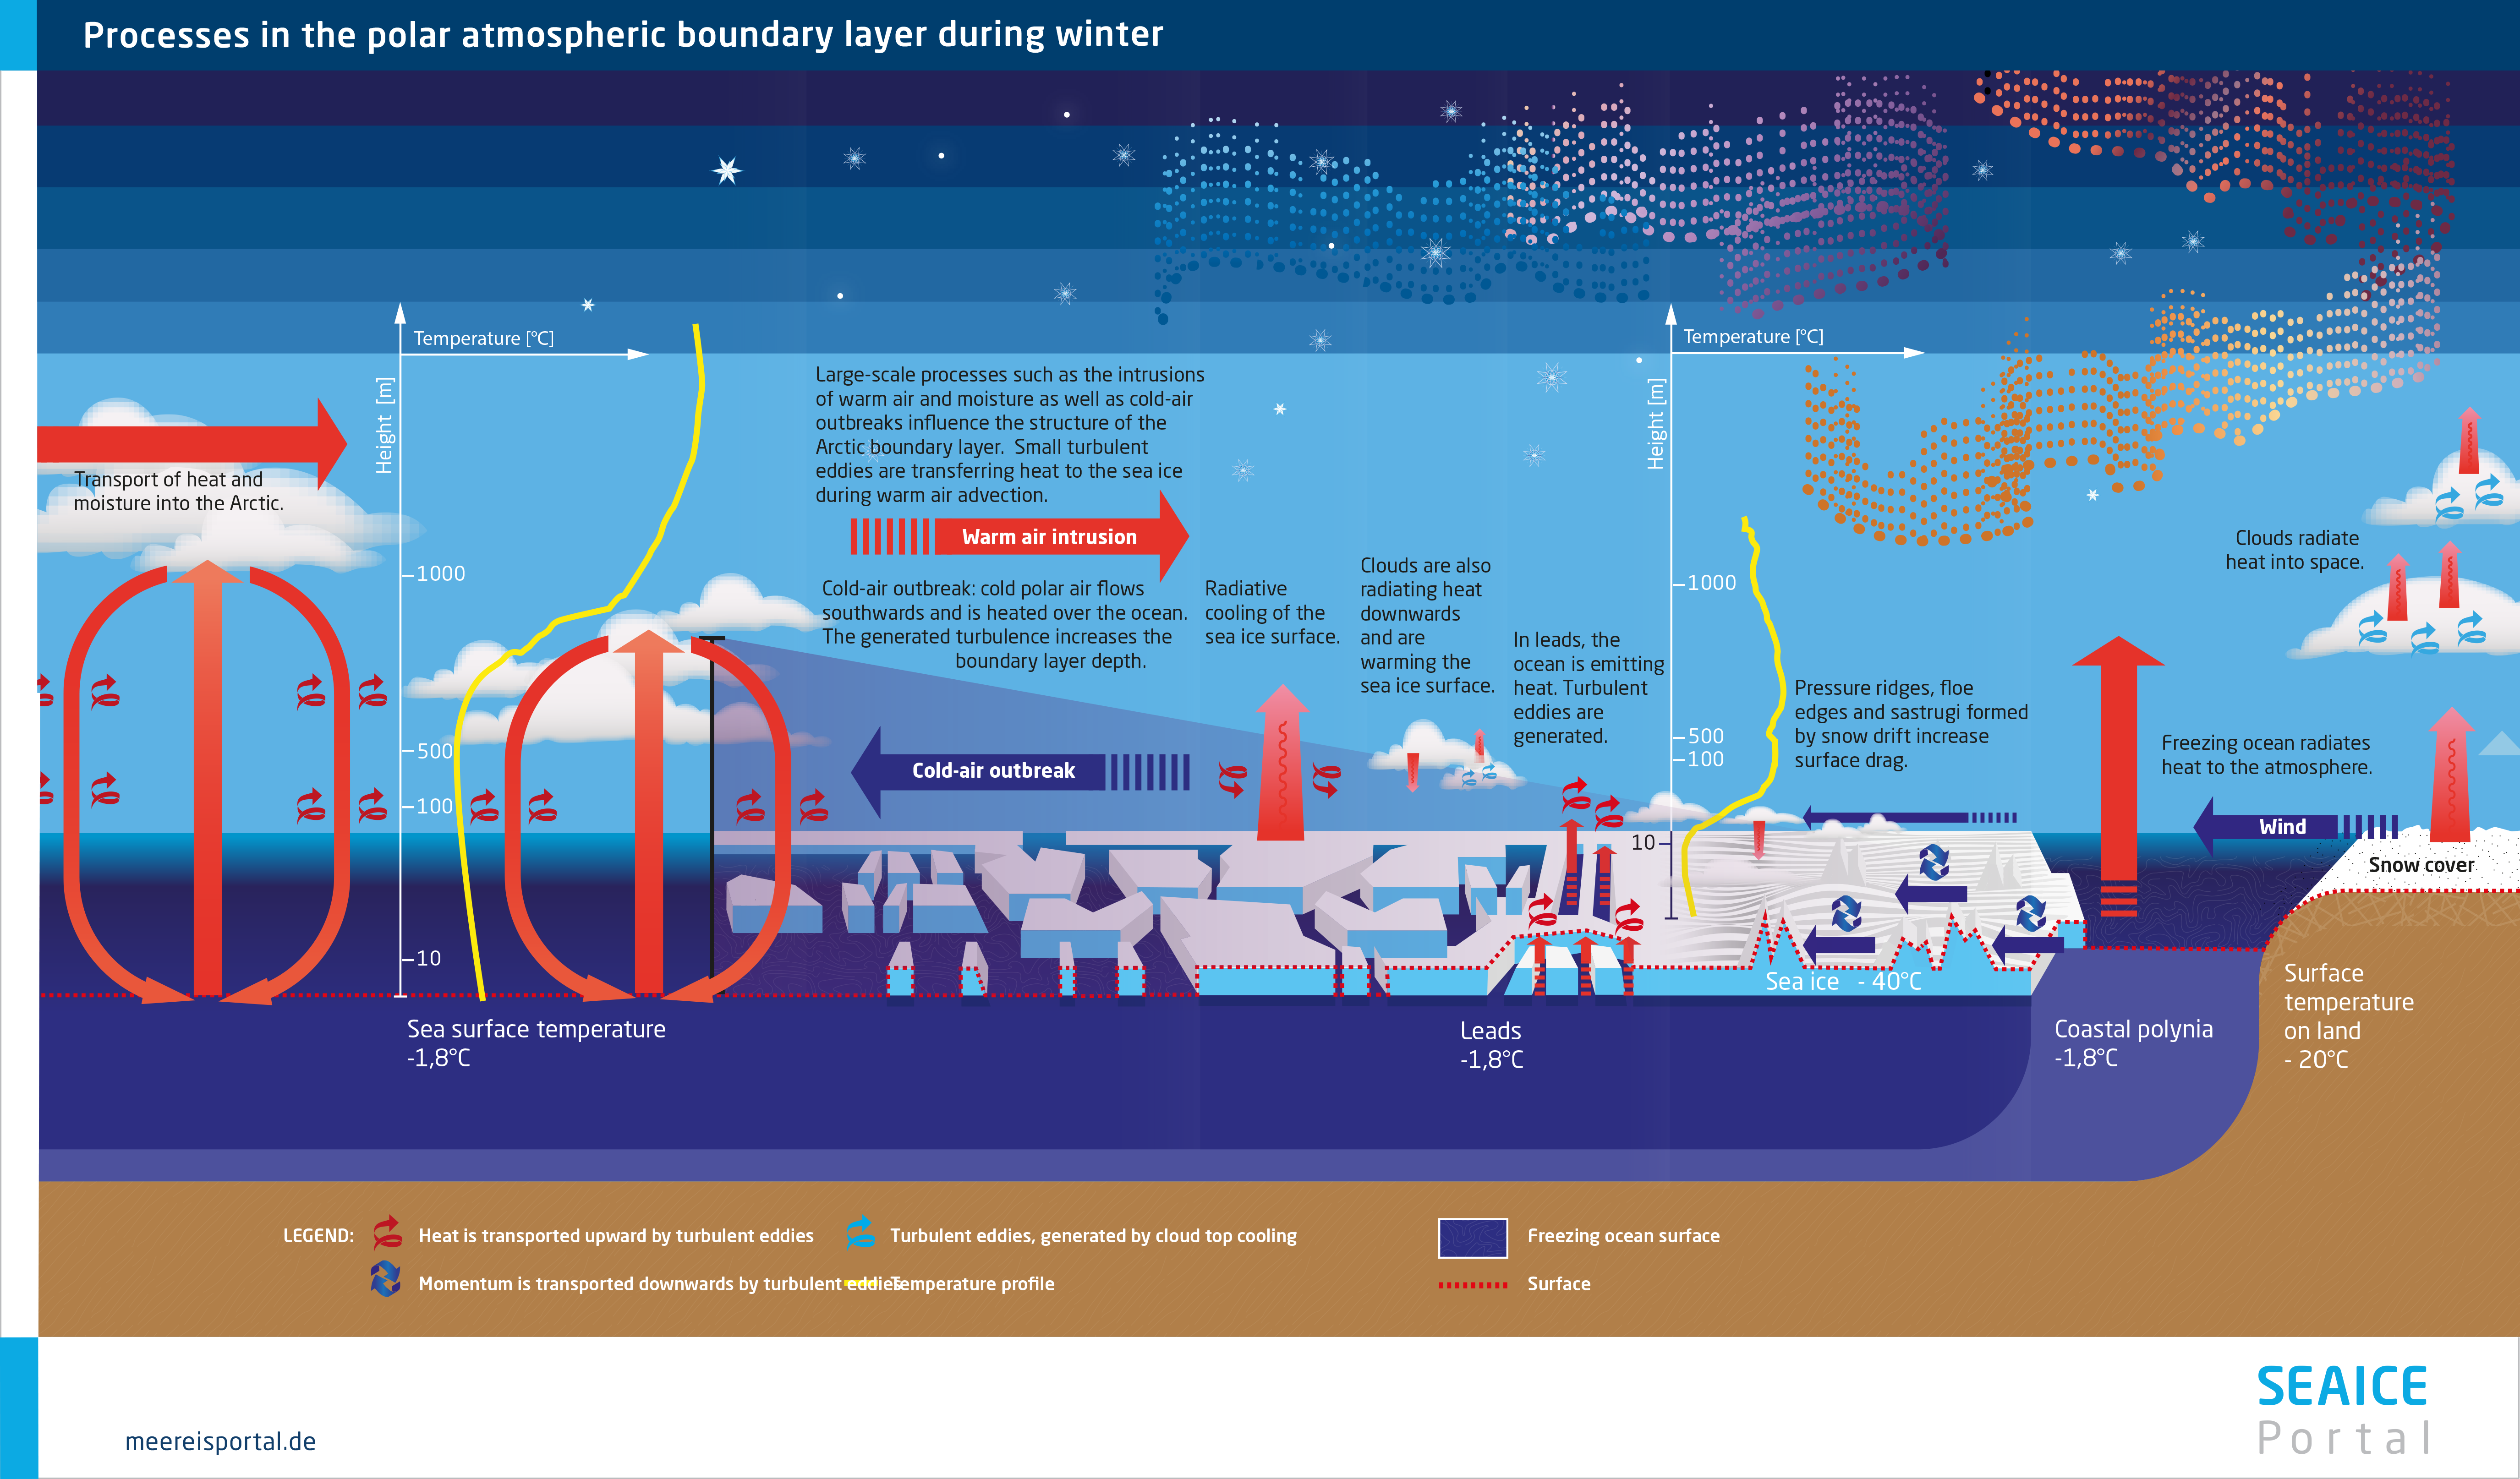
Annette Rinke: In our analyses, from the very beginning we’ve asked ourselves which processes are intensified or occur more frequently because of climate changes in the Arctic. In this regard, we realised that, for one thing, the changed surface conditions in the Arctic were an important factor. When the sea ice dwindles, or more snow falls on the ice, it changes the ice’s surface drag, affecting the transfer of heat, momentum and moisture between the ice, ocean and atmosphere. Our climate models weren’t capable of accurately depicting these processes in the lower atmospheric layers, which is why we made it our goal to develop improved modelling equations for these ‘atmospheric boundary-layer processes’.
Dörthe Handorf: The next point was: We now knew that all of these processes had an intermittent character, in other words, that they didn’t constantly occur, and that they sometimes disappeared in the signal-to-noise ratio when we looked at our models. This raised the question: How could we improve our model analyses so as to actually link the atmospheric signals to the sea-ice changes? In this regard, we weren’t just concerned with the jet stream’s weak phases, but also with another question: Does sea-ice retreat make extreme weather events like polar cold snaps in the middle latitudes occur more frequently? Thanks to improved statistical techniques, we hope to find answers to these questions soon.
Annette Rinke: In addition, we’re working together with partners from 18 leading polar research institutes in the new EU project PolarRES. One of the project’s goals is to determine how regional climate models can help improve our understanding of the various processes and how they interact. We’re also working to improve how global models reflect all the processes that are important to simulating the effects of Arctic climate change on the middle latitudes. In this regard, on a global scale our approach is to use atmospheric models that are capable of representing the polar regions in higher resolution. In other words, while our models use a standard grid resolution of roughly 80 kilometres for the middle and lower latitudes, for the polar regions we use a resolution of ca. 10 kilometres, which more accurately reflects polar climate processes. In the project, we also plan to run simulations using specially designed process models that offer a resolution of just one kilometre, since this is the only way to reflect small-scale processes like momentum and heat flows across leads and pressure ridges, which are ultimately essential to whether or not the chain reaction begins. But the boundary-layer processes are just one of three major focus areas in the project.
What are the other two areas?
Dörthe Handorf: The second focus area involves clouds, their water content and all processes that are influenced by clouds, since we still haven’t succeeded in accurately depicting these aspects in climate models. We’ll also take a closer look at the role and influence of snow and ice on energy flows in PolarRES. This focus area was chosen because we know that even a minor change in the snow cover can affect sea-ice growth and melting, which also makes snow important for feedbacks with atmospheric processes. Accordingly, it’s of tremendous importance that we include the snow cover in our coupled atmosphere-ice-ocean models and are capable of showing how they change over time. Snow that has fallen can grow older, or new snow can fall on an older layer. This new snow not only has a different albedo than the old snow; its thermal conductivity is also different. In such situations, it then comes down to how the model presents the snow cover: for example, if warm air masses are transported to the Arctic, whether or not it produces realistic melting of the snow cover and ice.
In your own work, do you use the extensive snow data gathered on the MOSAiC drift expedition?
Annette Rinke: As modellers, we can only improve the parameterization of the snow by using real-world observational data as the point of departure. Consequently, we work closely together with international peers and our AWI colleagues who were involved in the MOSAiC snow programme and collected the relevant data. But for the planned model improvements, we’ll also use data from other Arctic expeditions and from snow buoys, so that we’ll have as many sources as possible. With regard to the radiation and atmospheric data from the MOSAiC winter, we’re one step further; we’ve already compared them to the conditions that our coupled regional Arctic model simulates for the same time period. In this regard, our colleague and model designer Wolfgang Dorn has already improved our coupled model so that we can now use several different classes of ice thickness for calculating the energy budget at the surface of the ice, can describe leads in the ice, and can simulate how they freeze back over. But comparing our simulations with the MOSAiC data also showed us the weaknesses of our regional Arctic model.
What are its weaknesses?
Annette Rinke: Our model still has difficulties simulating extremely cold winter conditions characterised by an intense cooling of the lower atmospheric layers and by a stable boundary layer. In these situations, it underestimates the stability of the lower layers, which leads it to calculate air temperatures over the ice that are too high. When the observational data shows an influx of warm air masses, you can clearly see how the temperature rises, matching the temperature data in the model. But when the temperature in the observational data drops and stable layers form, the actual temperatures on the surface of the ice plummet to minus 35 degrees Celsius, while those in our model-based simulation only reach minus 25 degrees Celsius.
How are you addressing these weaknesses?
Dörthe Handorf: We’re using a clearly defined plan consisting of four steps. In the first step, observational data will be gathered on those parameters that we want to reflect more accurately in our model. This will be done on expeditions, and at polar research stations. This data will then be used to derive physical equations, a task we refer to as parameterization. The equations will then be compared to the field data and, once they’ve passed quality control, be integrated into our regional Arctic climate model.
Annette Rinke: We’ll then use the model to simulate the conditions at the time of the original observations and compare the outputs of our model with the field data. If we see a marked improvement in how processes are reflected in our regional model, we’ll also add the equations to our global climate model and then compare the simulation results with the observed reality once again. Ideally, we should immediately see better outcomes in the global simulations, too. But in reality, we often have to go back a step and, for example, revise the equations after a test run in the regional model, before testing them in the same model for the second, third or fourth time – and even then, our efforts don’t always produce clear successes, as our experiences with the new parameterizations for processes in a stable boundary layer show.
Why don’t they yield clear improvements?
Annette Rinke: Because the equations are only relevant when there is very stable layering in our climate simulation. But since the temperature at the surface of the ice is often too high in our Arctic model, it doesn’t show stable layering as often as it should. In other words, the new parameterizations aren’t applied and therefore have no effect. This example shows quite vividly that we can’t make major strides by considering the boundary-layer processes alone. Atmospheric dynamics constitute a complex process with various interactions. Consequently, the snow cover and clouds would seem to be just as important. For instance, when we compared our simulations with the radiation data from MOSAiC, we realised that the long-wave reflected radiation in our model was too high.
…what do you mean by reflected radiation?
Annette Rinke: The Earth gives off heat to the space around it in the form of long-wave radiation. But on its way through the atmosphere, this radiation collides with water vapour or clouds, which reflect part of it back toward the surface as long-wave reflected radiation. That’s the fundamental process involved in the greenhouse effect! And this reflected radiation is still overestimated in our model, producing warmer temperatures at the surface. We still don’t know exactly why; most likely, we’re still not describing the clouds well enough. That’s why we’re now taking a closer look at the MOSAiC data on cloud water content, in order to determine whether the model is simulating ice clouds, water clouds or mixed-phase clouds. As you can see, right now we’re working intensively with the MOSAiC data in all three focus areas, in order to assess and gradually improve our models.
Thank you for your time, and best of luck!
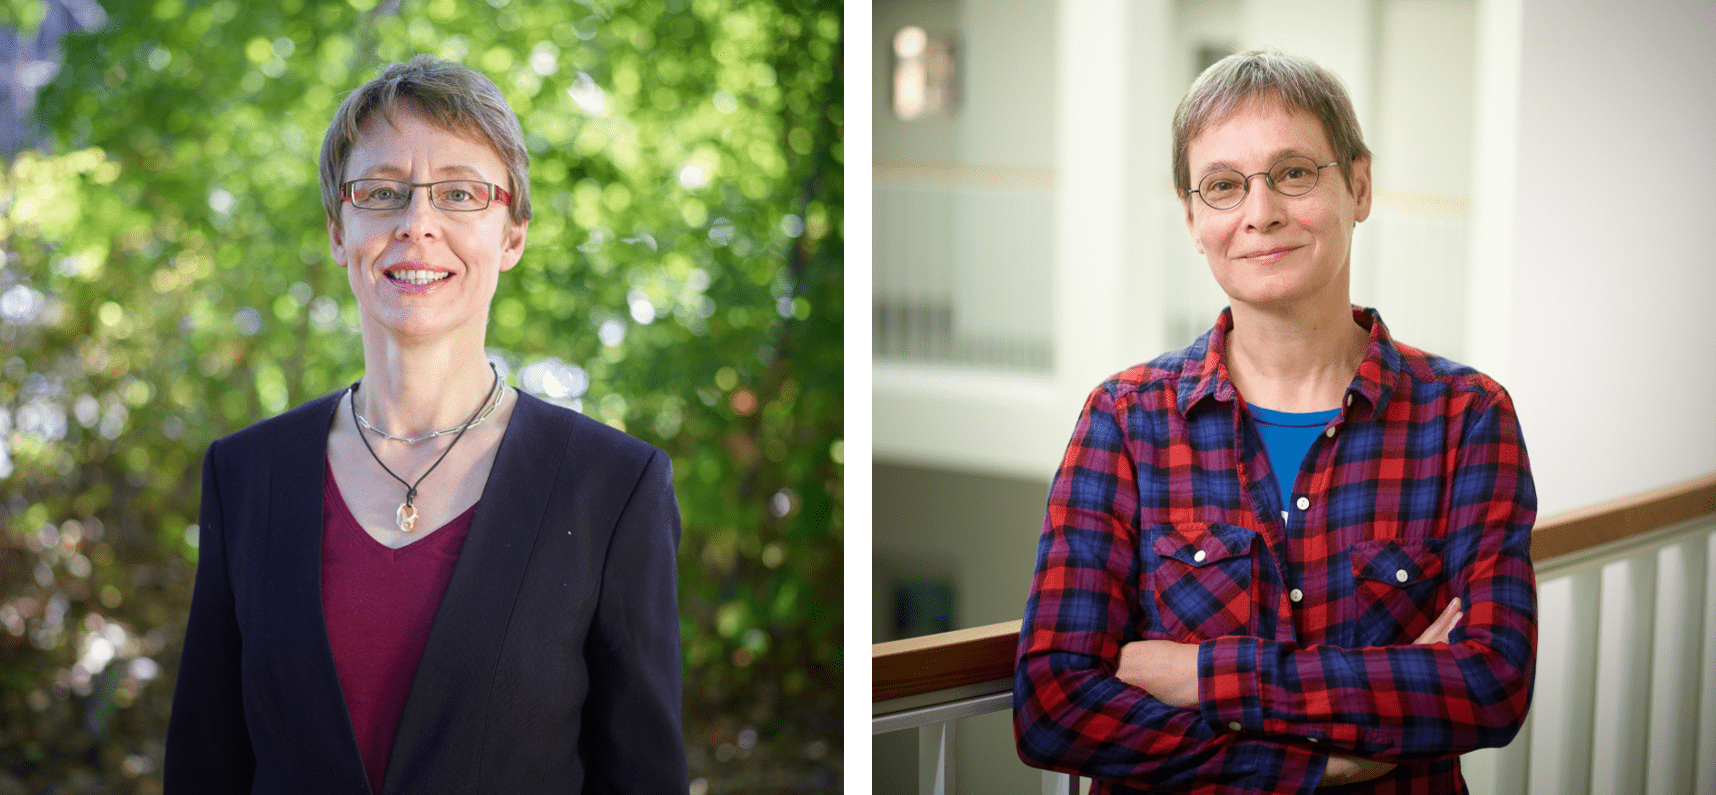
Dr. Dörthe Handorf is an atmospheric physicist and climate modeller at the Alfred Wegener Institute in Potsdam. Her current focus is on the AWI’s regional Arctic climate model, which she is using in various projects to determine how changes in the Arctic are impacting the weather and climate in the middle latitudes.
Dr. Annette Rinke is also an atmospheric physicist and climate modeller at the Alfred Wegener Institute in Potsdam. Concentrating on the Arctic, she is currently investigating e.g. how climate simulations using the AWI’s regional Arctic model can help to understand interrelations between the ice, ocean and atmosphere.
Graphics


