One and a half years ago the unique Multidisciplinary drifting Observatory for the Study of Arctic Climate (MOSAiC) expedition, together with its year-round drift through the Central Arctic, came to an end. With a wealth of data, enthusiasm and new findings, the scientists returned to their home research institutes to analyse the data and prepare their first summarising conclusions. Three papers on ice, atmosphere and ocean research have now been published and offer insights into a changing world, one that is both fascinating and alarming.
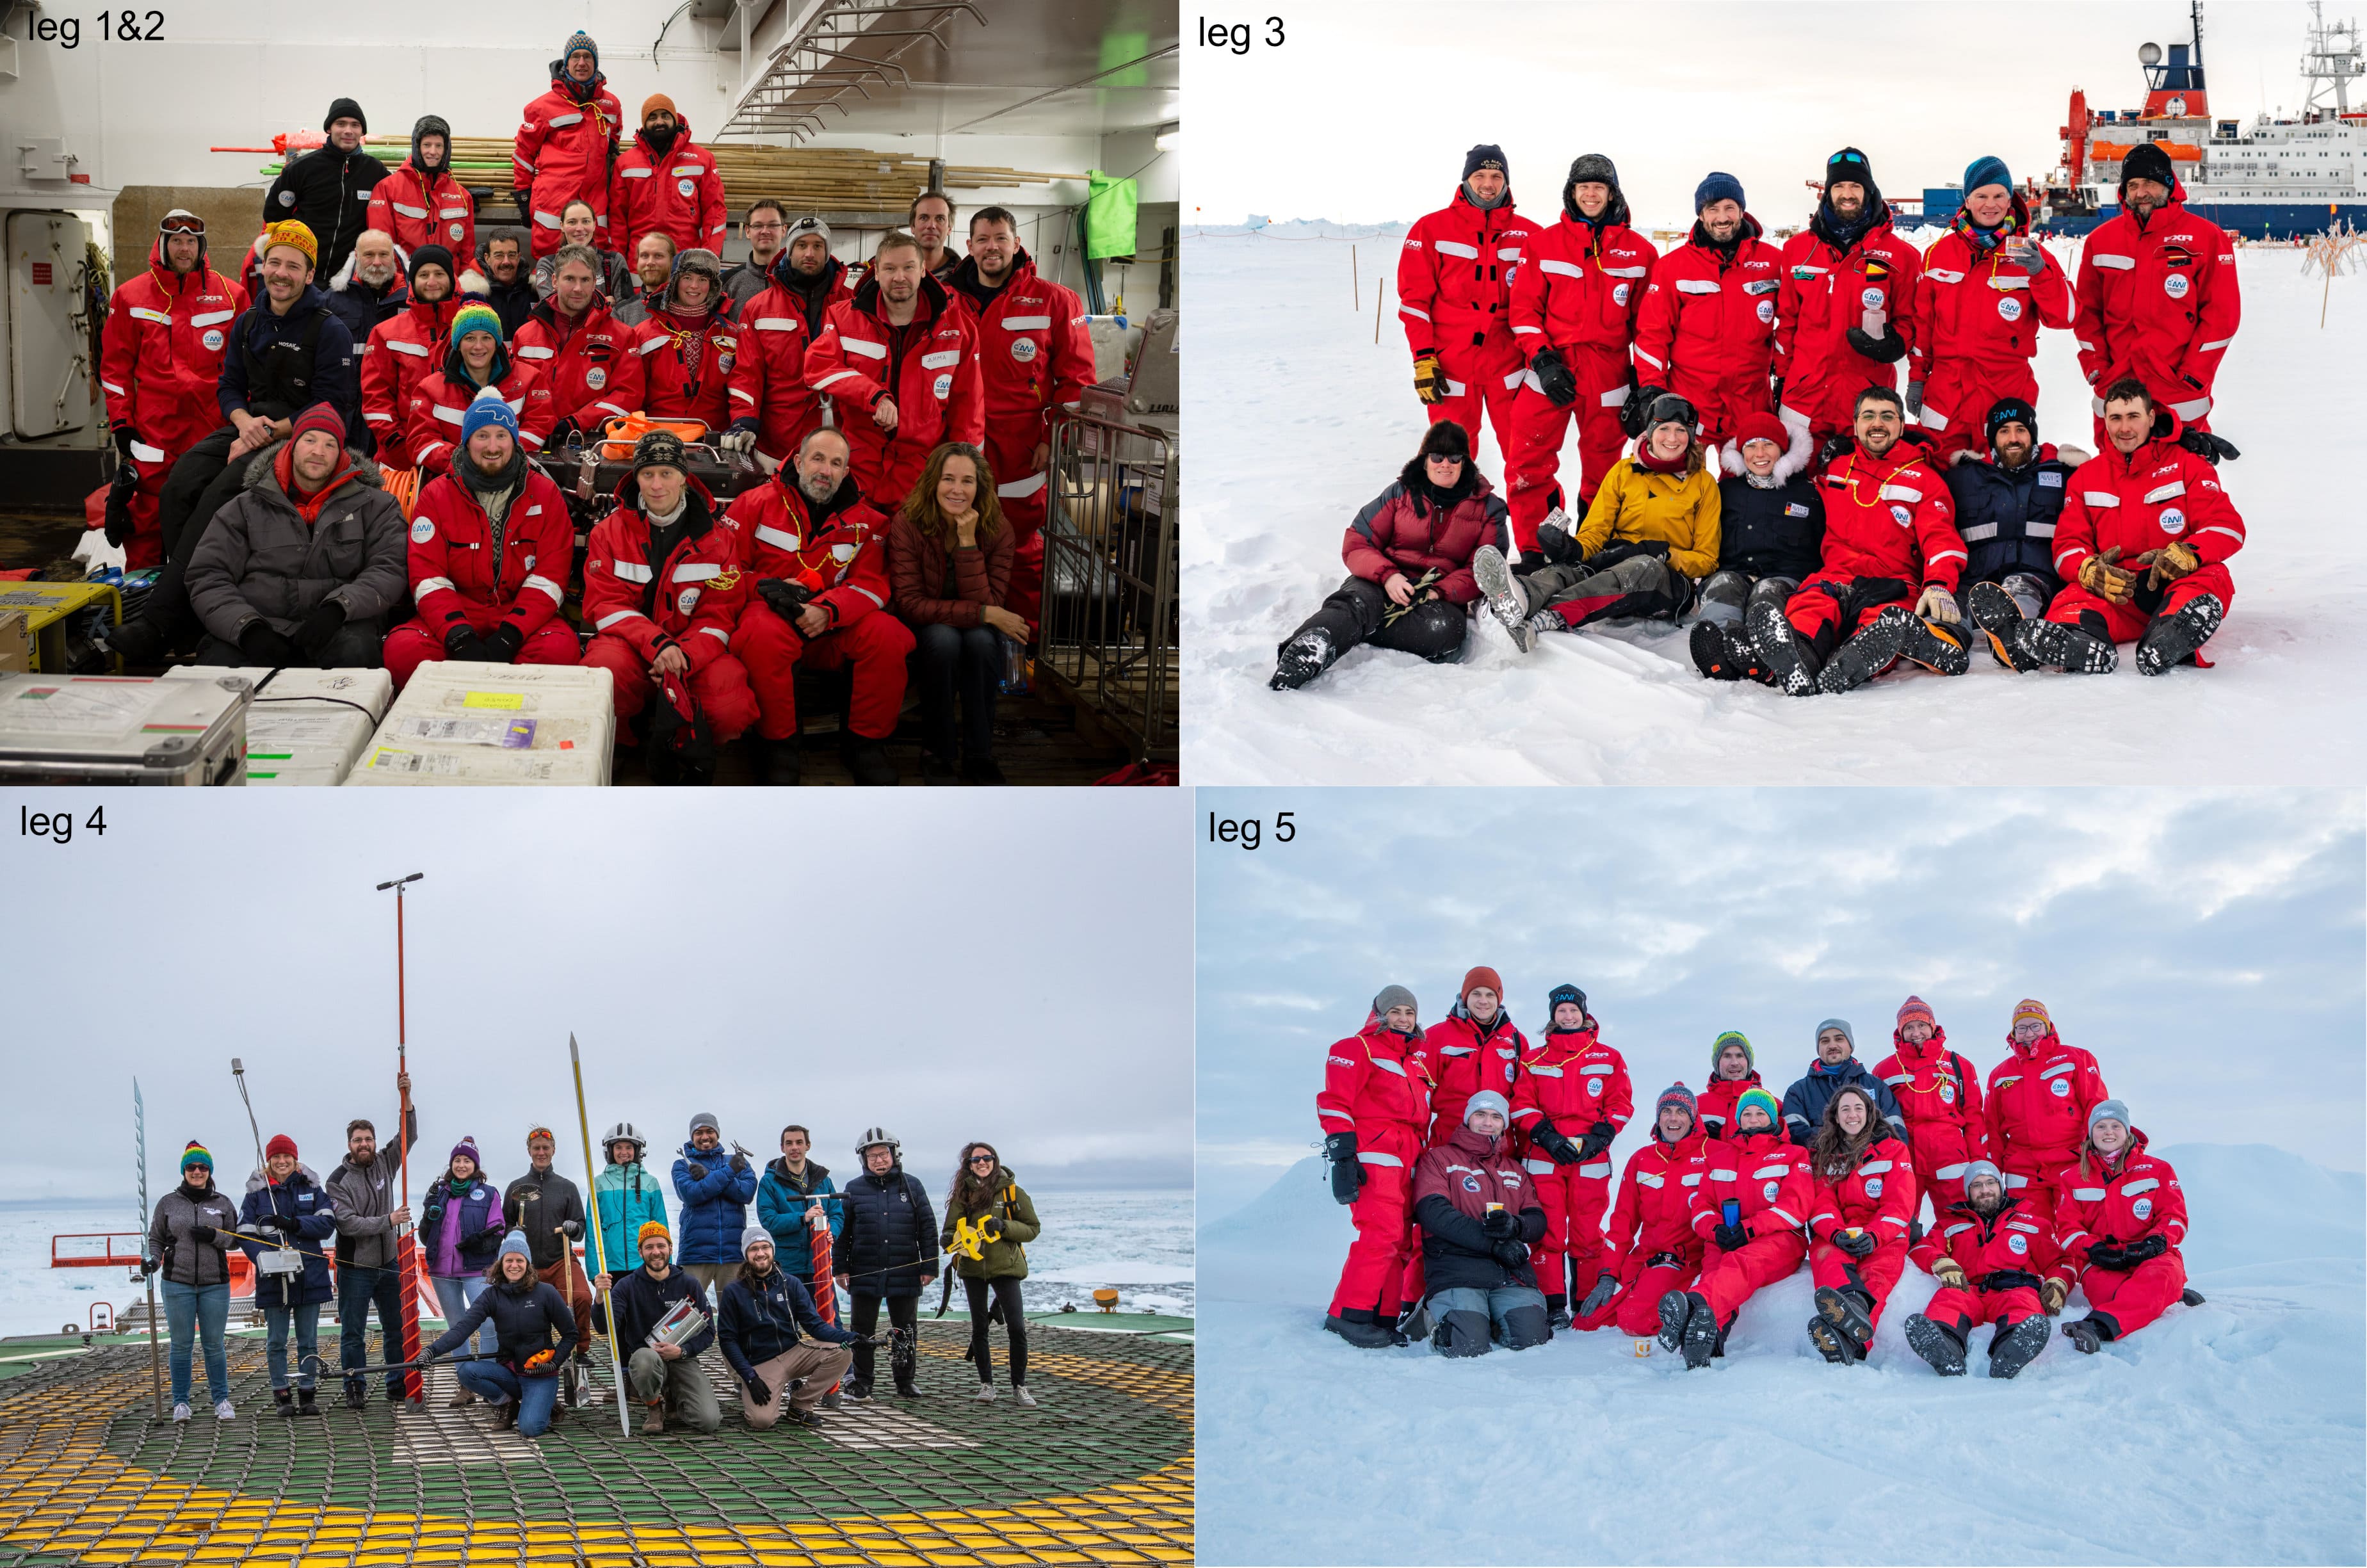
The MOSAiC snow and sea-ice team conducted year-round observations of the physical snow and ice properties and the processes that govern the development of pack ice and its interactions with the atmosphere and the ocean. The ICE team consisted of more than 150 scientists from all over the world, including 66 who joined the expedition on board (photo ICE team). Now, 15 months after the research vessel Polarstern’s expedition to the Arctic Ocean ended in September 2020 (see map in Figure 1), the team has published the most comprehensive overview of the work, together with representative results. The work was part of MOSAiC’s interdisciplinary design, i.e., studying the atmosphere, the ocean, the ecosystem, and biogeochemical processes. “It’s fantastic to see how the team of 101 authors from 46 institutions has compiled this first overview and how the project sparked intensive and interdisciplinary collaboration, even beyond the original MOSAiC participants. This publication will be the basis for interpreting snow and sea-ice properties as the central component of the Arctic climate system,” says Dr Marcel Nicolaus, a sea-ice physicist at the Alfred Wegener Institute, Helmholtz Centre for Polar and Marine Research (AWI). A brief overview of the various observational tools, scales and results can be found in the following paragraphs. The full story can be found in Nicolaus et al. (2022).
For a clearer view from space
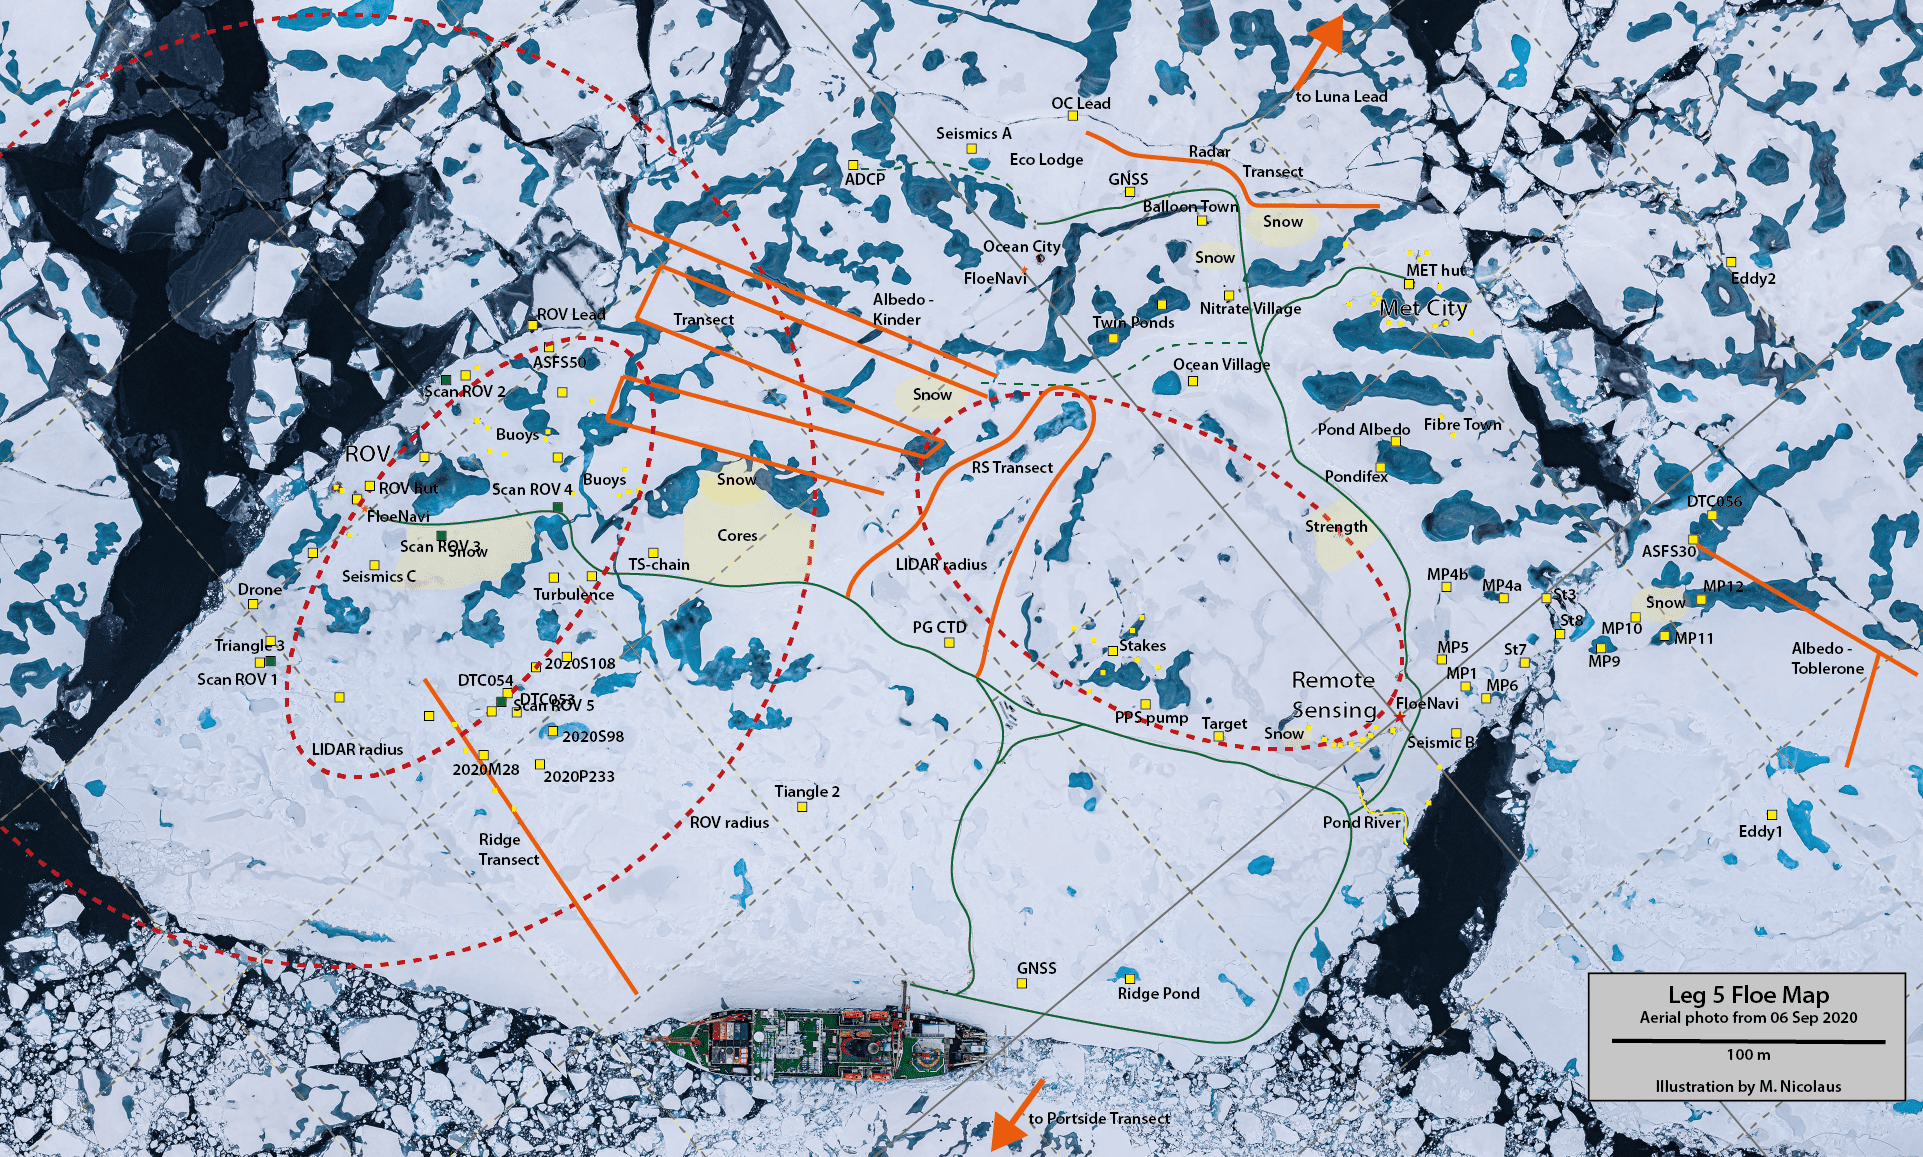
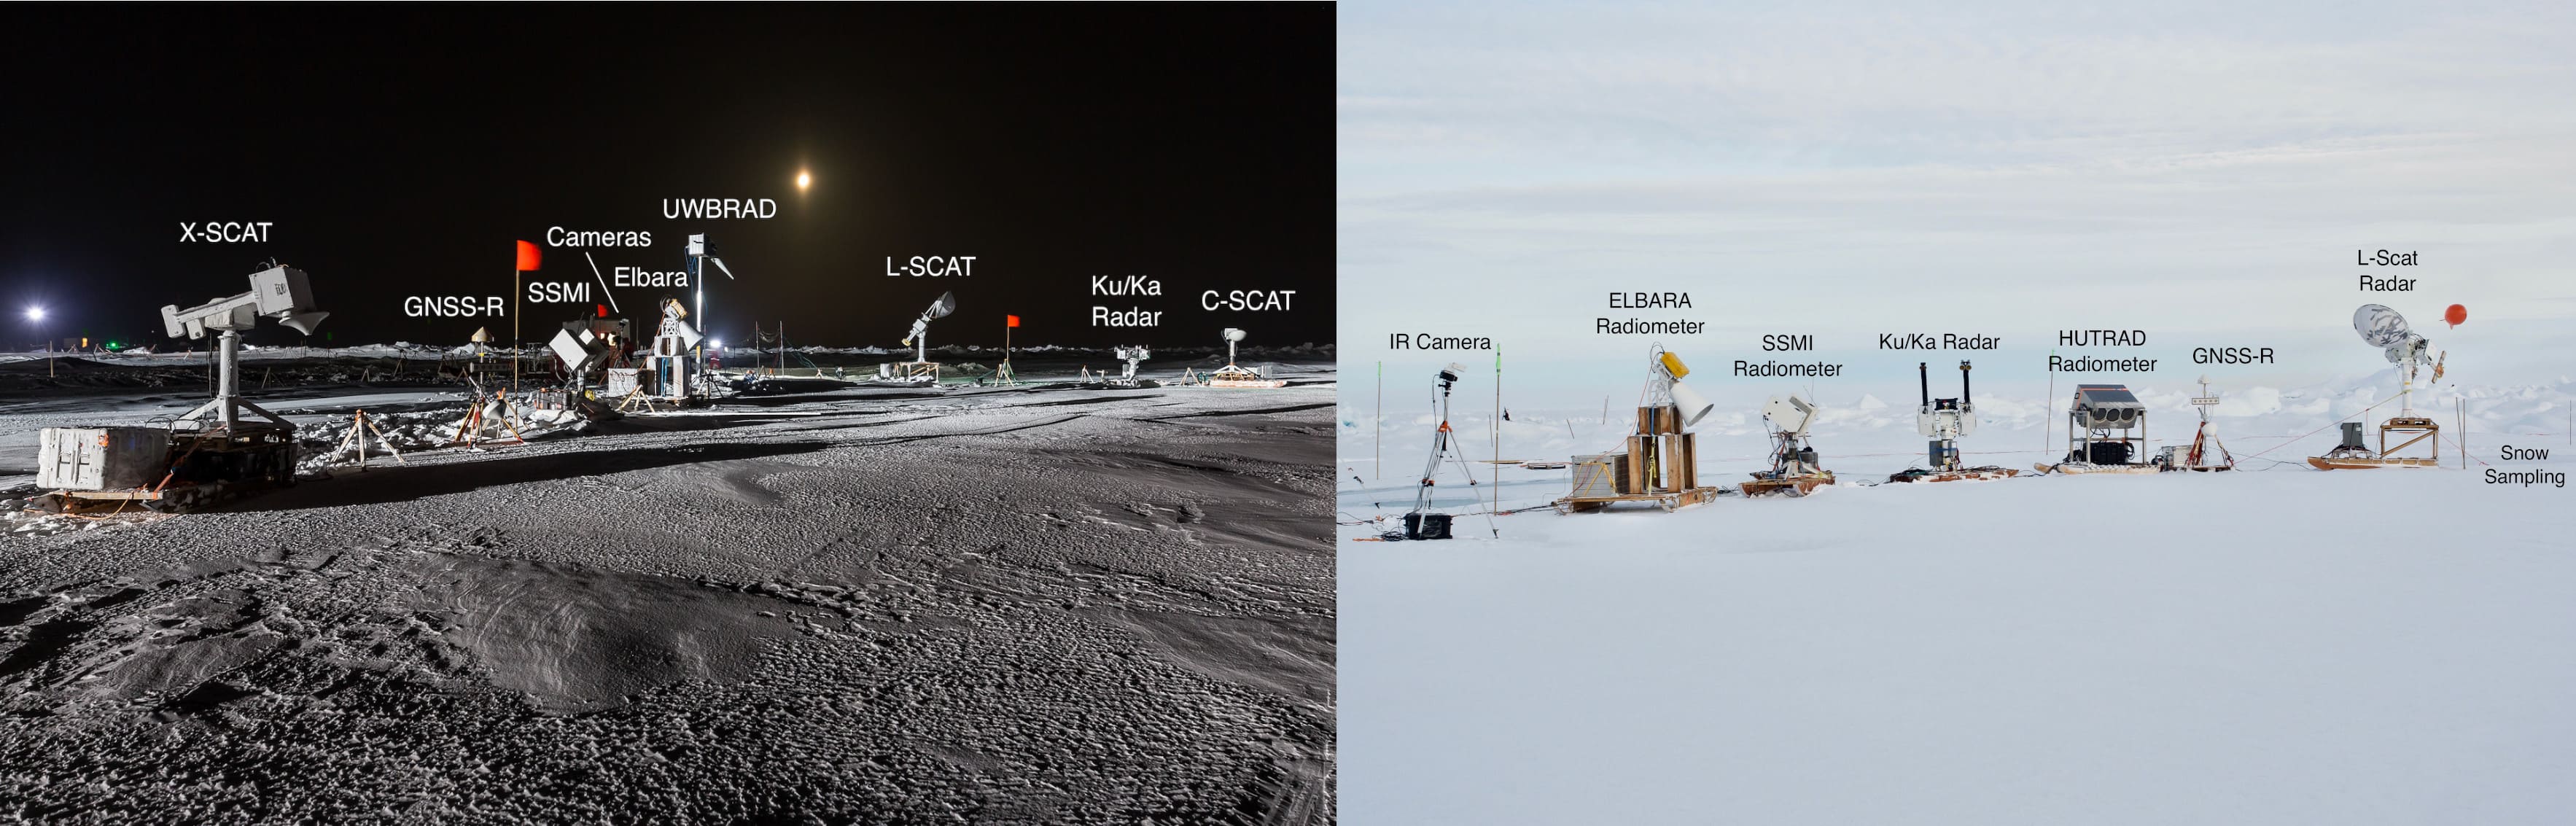
The group was able to perform observations over scales from centimetres to tens of kilometres and in all seasons. This will improve our understanding of the properties and processes of the coupled Arctic system (Figure 2). Most of the observations were made in the Central Observatory (CO), the area around RV Polarstern. Figure 3 shows the CO in Leg 5 (autumn 2020), indicating the sampling sites used by the snow and sea-ice team. As one component of the ice camp, a unique collection of remote-sensing instruments was installed. “We put the largest collection to date of 14 remote-sensing instruments on the ice (Figure 4) to observe the same area of snow and sea ice at the same time. They are similar to their counterparts on satellites in space. Together with detailed snow and ice observations, they pave the way for new sea-ice observations from upcoming satellite missions. This will also allow better uncertainty assessments of existing satellite time series and help to improve climate models,” explains Dr Gunnar Spreen, a senior scientist and group leader at the University of Bremen. Initial results already show that a combination of radar observations at different frequencies can provide information on the snow depth on sea ice. But also that current satellite methods can fail to produce reliable data when events like warm air intrusions or rain on snow change the microwave properties of the surface. Such algorithmic shortcomings can now be improved with the help of the MOSAiC measurements.
The sea-ice clock – a full annual cycle of measurements
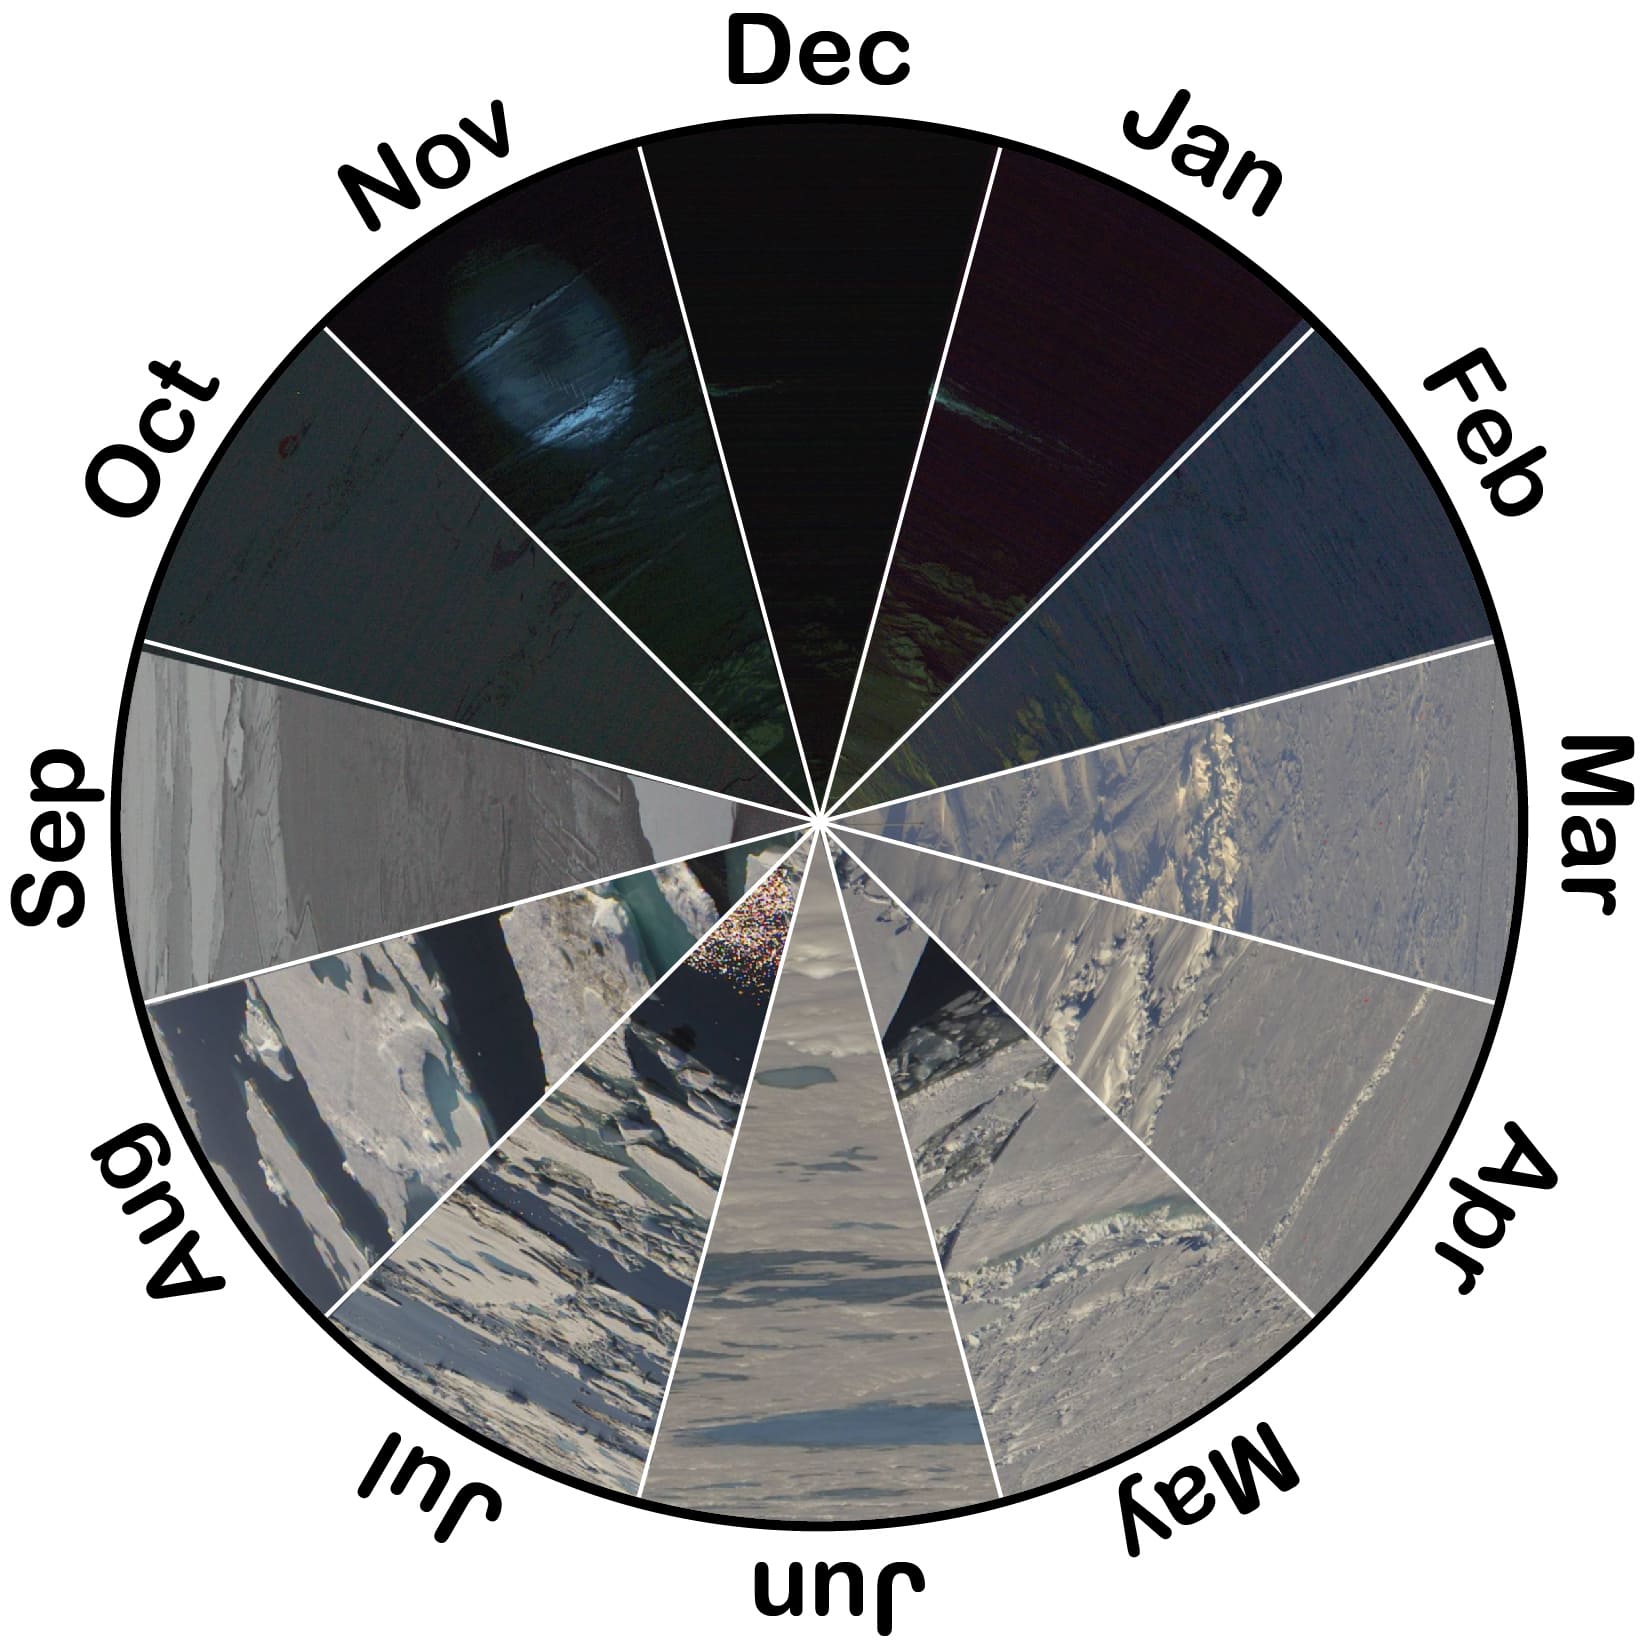
We were able to observe the full annual cycle: starting from thin and new ice in September/October, to further ice growth with snow accumulation through the dark season until February, into the dense and cold spring pack ice until April, and then melting snow and meltwater pond formation, and the decay of the pack ice in summer. This is illustrated in Figure 5, which we call the “ice clock”. From the entire dataset, we found larger spatial variabilities in the snow cover than expected, due to atmospheric processes and the structure of the underlying sea ice. This extreme variability means that we have to consider the snow in much more detail for future model simulations and the interpretation of satellite data. In addition, the pack ice was more dynamic and faster-drifting than expected. This was not only a challenge for the teams in the field in their daily work, but in particular resulted in changing sea-ice properties and thickness distributions. These dynamic events were observed using a unique combination of local, high-resolution ship’s radar imagery, buoys and satellites.
Short-term events with lasting influences
Another scientific highlight, but also a particular challenge in the observations, were short-term atmospheric events, e.g. storms in winter, warm spells in spring, meltwater fluxes in summer, or rainfall in autumn. “These events were a particular focus of our work. The team in the field had to adapt their routine measurement plans to capture these events and intensify their observations to describe the resulting changes in snow and ice properties. The results show that these events have considerable effects on the snow and sea-ice properties over the coming months, far beyond the event itself,” reports Marcel Nicolaus.
Snow thickness and optical properties during the different seasons
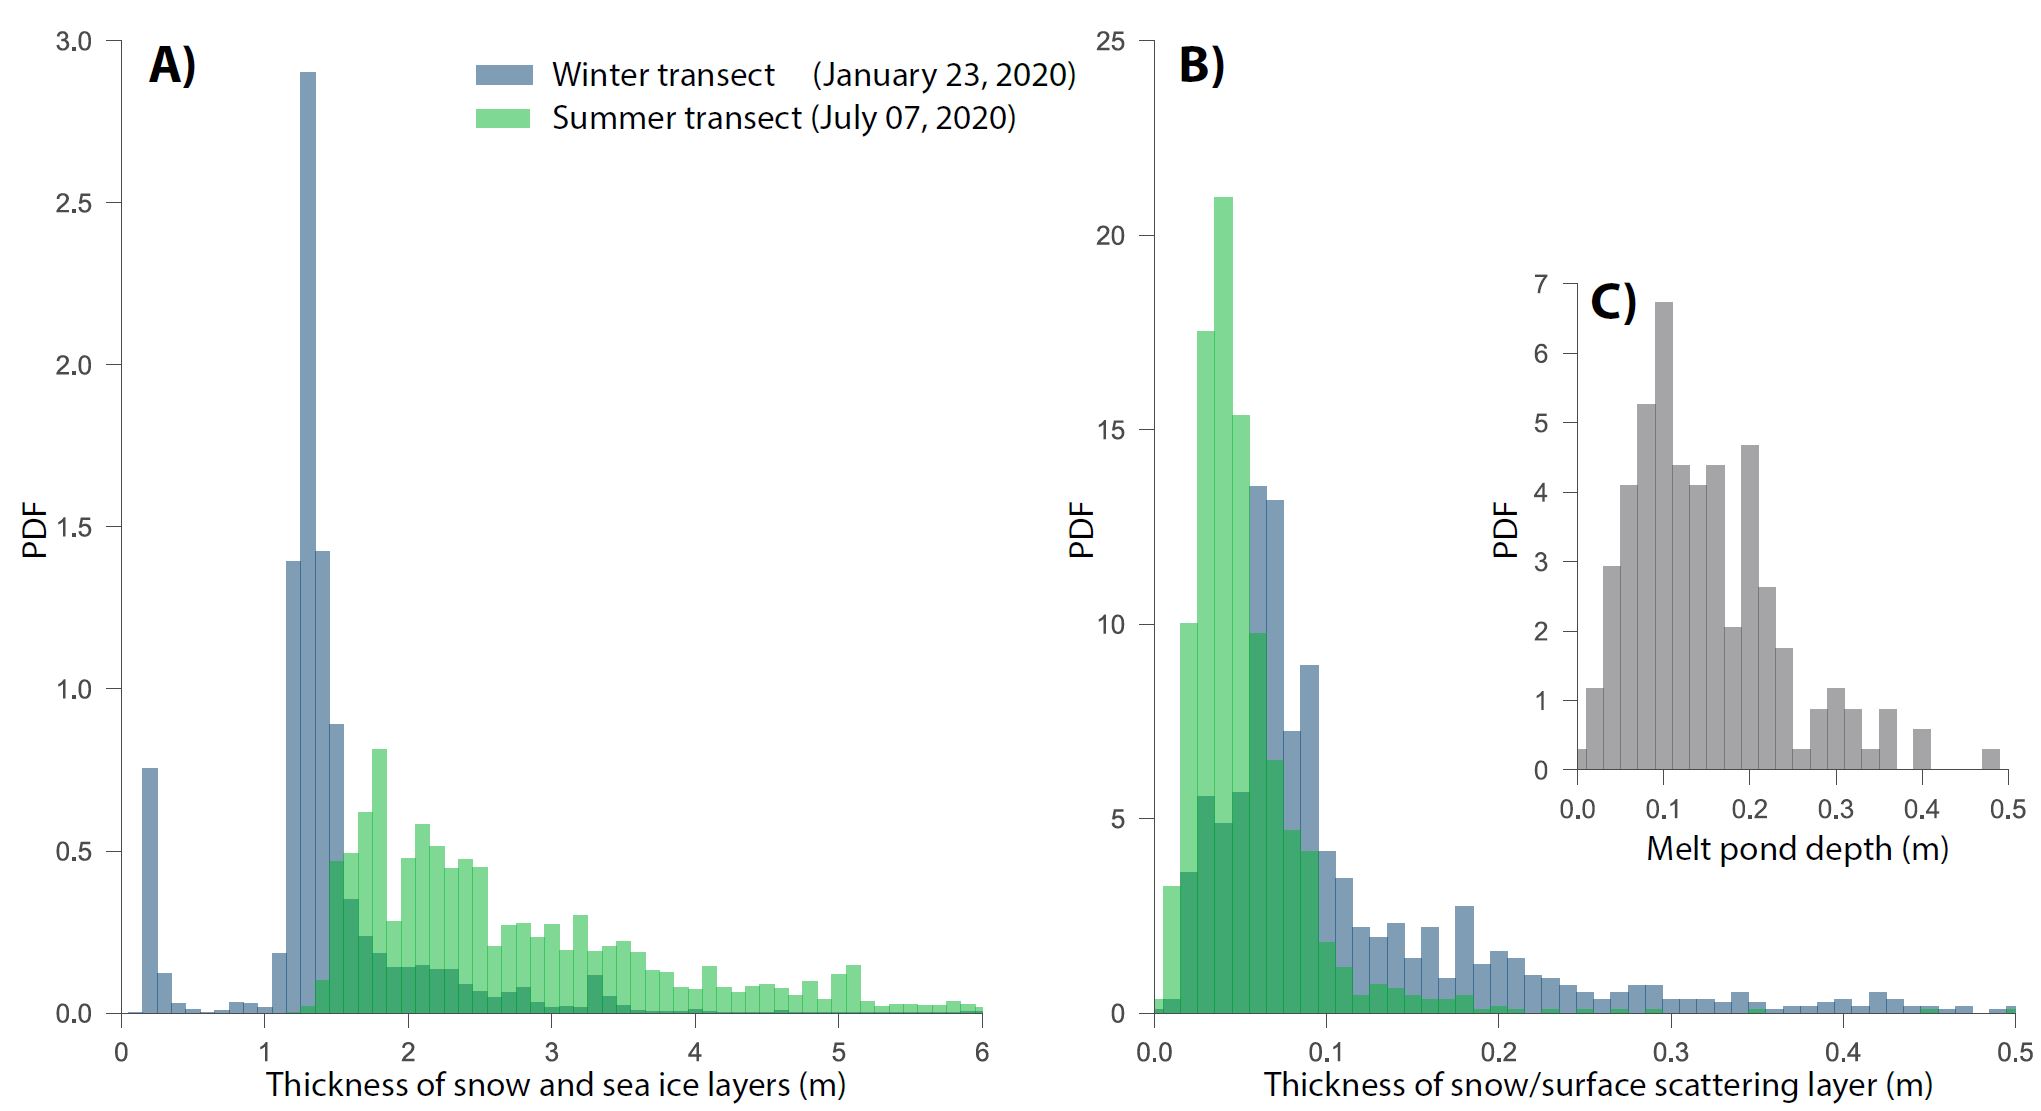
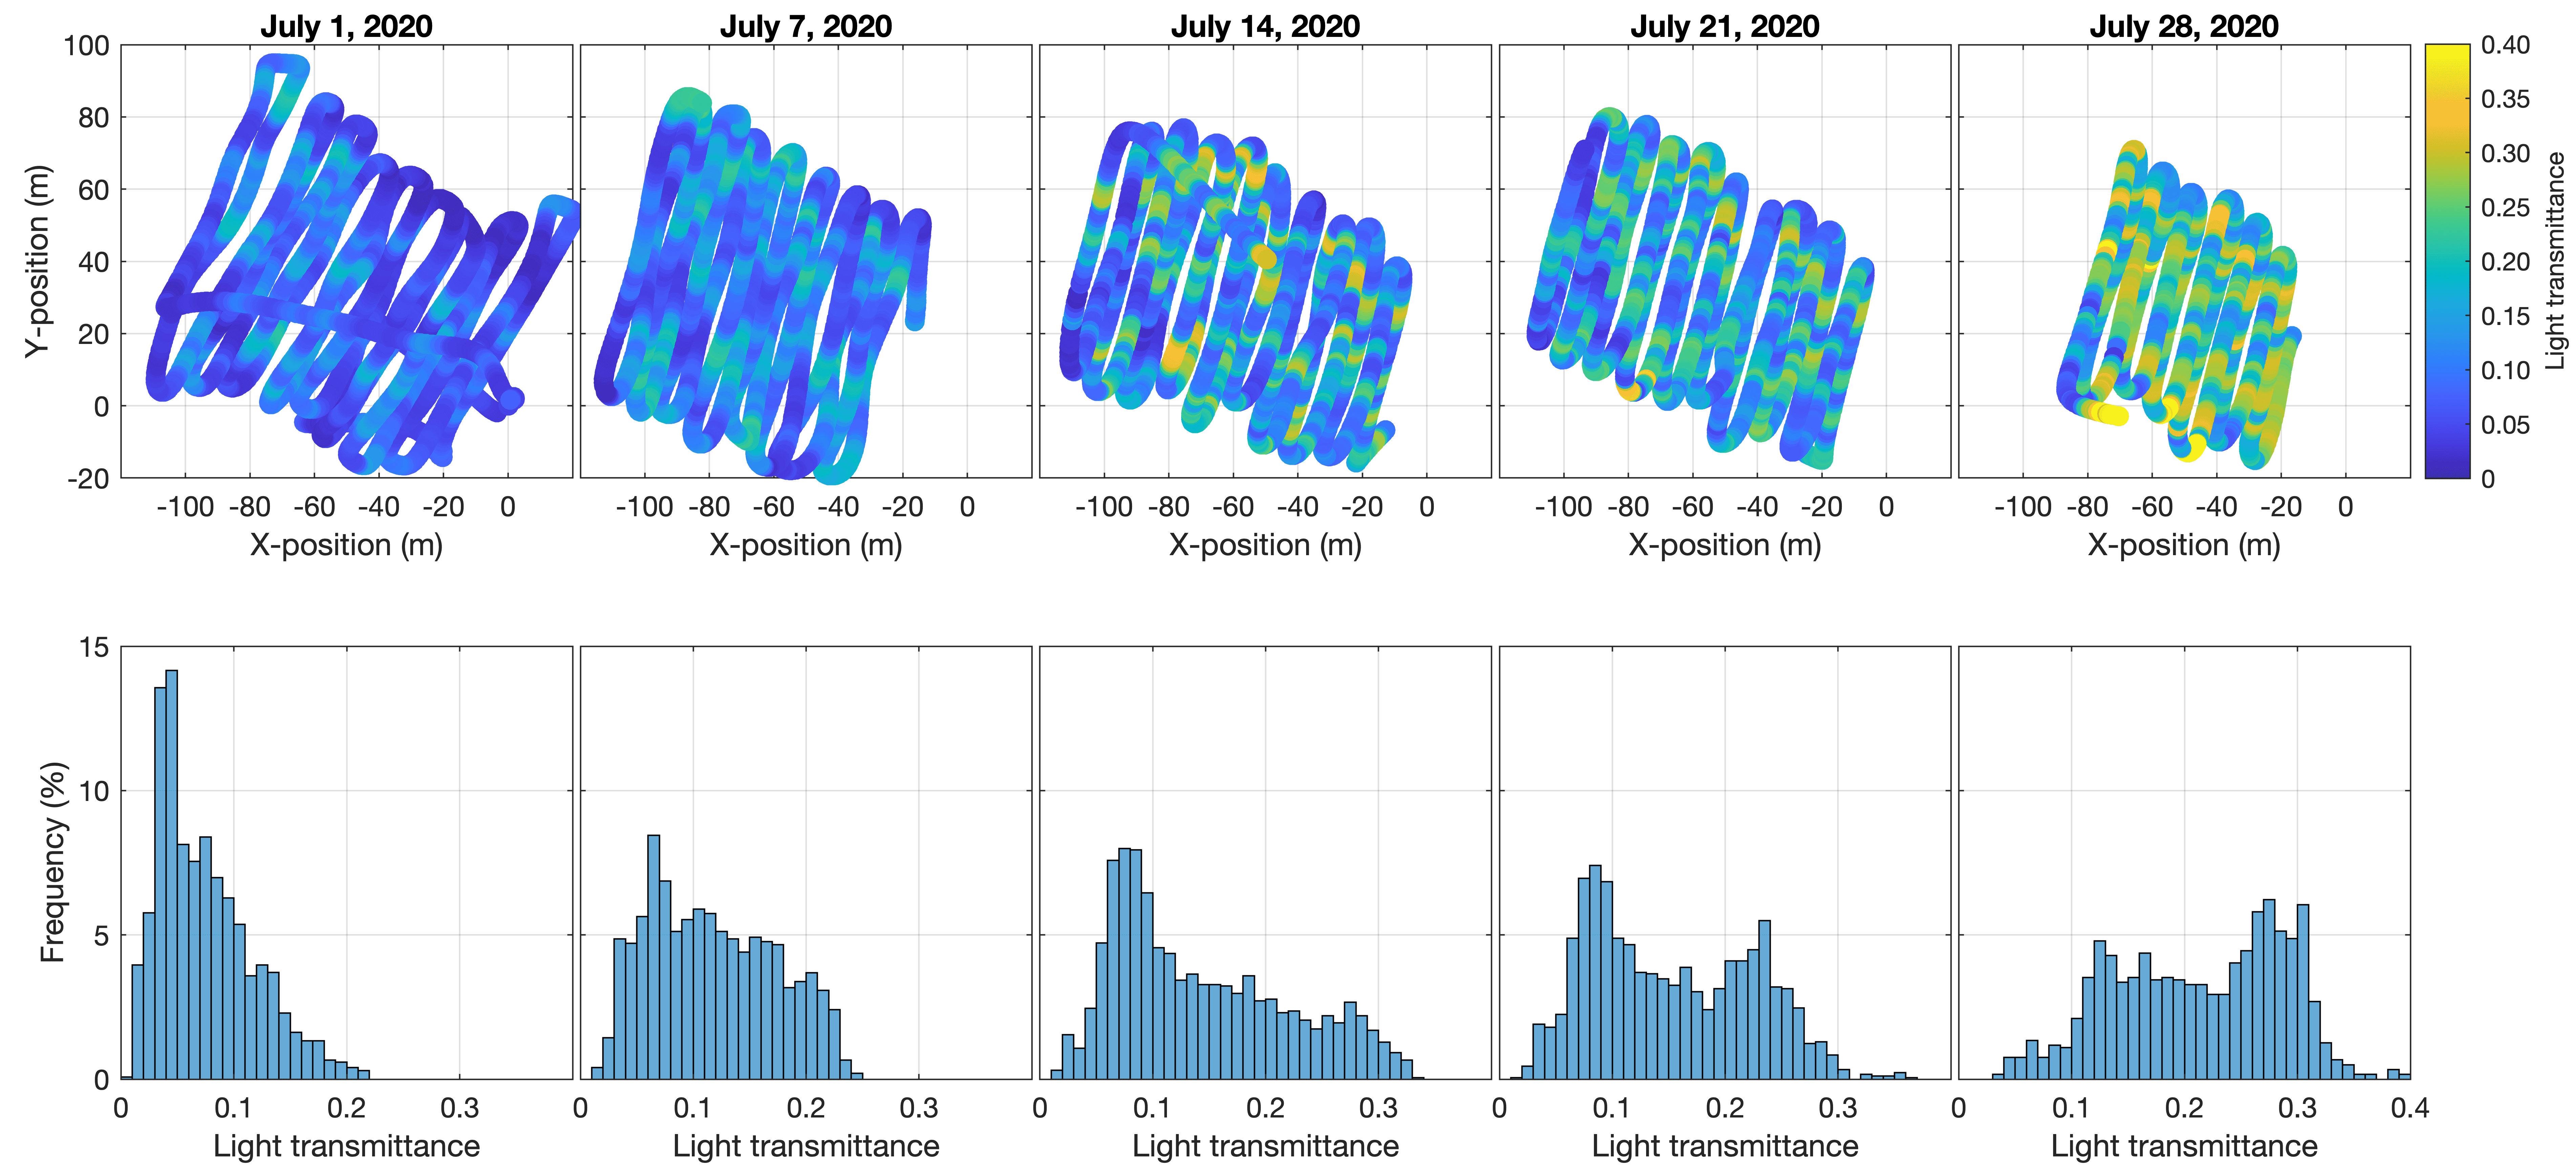
Our key time series observations included snow and sea-ice thickness measurements made with manual, airborne and autonomous instruments across different scales. We made regular transects across the Central Observatory (Figure 6): following designated tracks over the floe, along which the sea-ice and snow mass balance and surface properties were measured. We found an increase in the modal (snow plus sea ice) ice thickness from 1.3 m to 1.8 m (mean 2.7 m ) along with changing distribution functions from autumn to spring. This dataset makes it possible to discuss the contributions of thermodynamic and dynamic ice-thickness changes. As expected, snow thickness was substantially lower in summer compared to winter/spring, which is obvious from the reduction in modal snow thickness from 0.06 to 0.03 m. In July, the modal meltwater pond depth was 0.1 m, with a maximum depth of 0.5 m. Measuring the optical properties of snow and sea ice was a key activity during the sunlit part of the year. The observational programme focused on surface albedo observations with in-situ and drone-based observations as well as measurements of transmitted light under the sea ice, mostly based on measurements from a remotely operated vehicle (ROV). We were able to characterise the seasonal progression from spring to summer as well as from summer to autumn, as shown e.g. in Figure 7. The datasets show how the seasonal progression not only impacts the absolute amount of light being reflected, absorbed or transmitted, but also how the spatial variability changes over the year.
From local to regional scale
Regular helicopter survey flights allowed us to connect the local and regional scales. The surface topography and freeboard were measured using laser scanners, the ice thickness by electromagnetic induction sounding (EM-Bird). First results show that ice dynamics changed the ice surface topography and contributed significantly to the ice-thickness distribution. In winter, temperature maps of the MOSAiC floe and its surroundings were obtained from infrared helicopter observations (Figure 8). They show when cracks in the ice, called leads, opened and closed. According to Gunnar Spreen: “This has a major influence on the local energy budget. In winter, the heat flux from the ocean to the atmosphere in leads with open water or thin ice is up to several orders of magnitude higher than in solid ice cover.” Visual helicopter images taken in summer show e.g. the different stages of development of meltwater ponds and that they more frequently form in regions where the sea ice was slightly warmer in winter (Figure 8).
MOSAiC data analyses continue
The initial results summarised in this overview publication are already exciting. And even today, we are collecting data from the last remaining buoys that are still drifting in the northern Atlantic Ocean, but outside the ice-covered region. We are currently publishing on a weekly basis more and more datasets from the huge data repository. The aim is to make all data publicly available before the end of the embargo period in January 2023. For many datasets, the initial processing and analysis have now been completed. The next step is to combine them within the snow and sea ice domain but also and even more importantly with atmospheric, ocean, biogeochemical and ecological observations. This work will increasingly include numerical studies. By doing so, we will improve our holistic understanding of the Arctic climate system. Key elements include several workshops, scientific exchanges and joint publications in the coming years. We expect that this will include more and more people from outside the initial MOSAiC consortium. Stay tuned; more exciting MOSAiC stories are coming soon!
Reference and link to the original publication
Nicolaus, M, Perovich, DK, Spreen, G, Granskog, MA et al., 2022. Overview of the MOSAiC expedition: Snow and sea ice. Elementa: Science of the Anthropocene 10(1). DOI: doi.org/10.1525/elementa.2021.000046
Contact
More stories from the MOSAiC snow and sea-ice team
Graphics
 in 2019–2020.")


 in 2019–2020.")


