According to the Copernicus Climate Change Service (climate change service of the European Commission and European Space Agency), in Europe the summer months June to August were the hottest since the beginning of record-keeping and were 0.4° Celsius higher than the previous record highs in 2018 and 2021. The summer was characterised by multiple heat waves and prolonged dry periods / droughts, which led to numerous, extensive forest fires in many parts of Europe, including Germany. According to a study released by Finnish researchers at the Meteorological Institute in Helsinki, Arctic warming is more intense than previously assumed, and the Arctic has warmed at nearly four times the global average over the past 43 years. All of this is indicative of worsening climate warming.
However, if we view the sea-ice extent as an indicator of Arctic warming, 2022 wasn’t an unusually warm year in the Arctic, and the melting wasn’t unusually high compared to the past 15 years. The mean ice extent was in the top third for the past 15 years but continued to be below the extents recorded before 2006. How, then, should this year’s development be assessed?
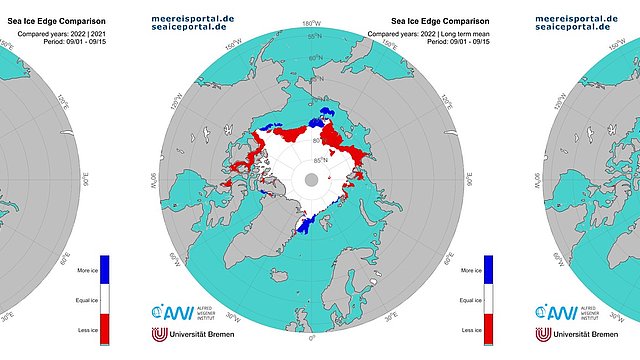
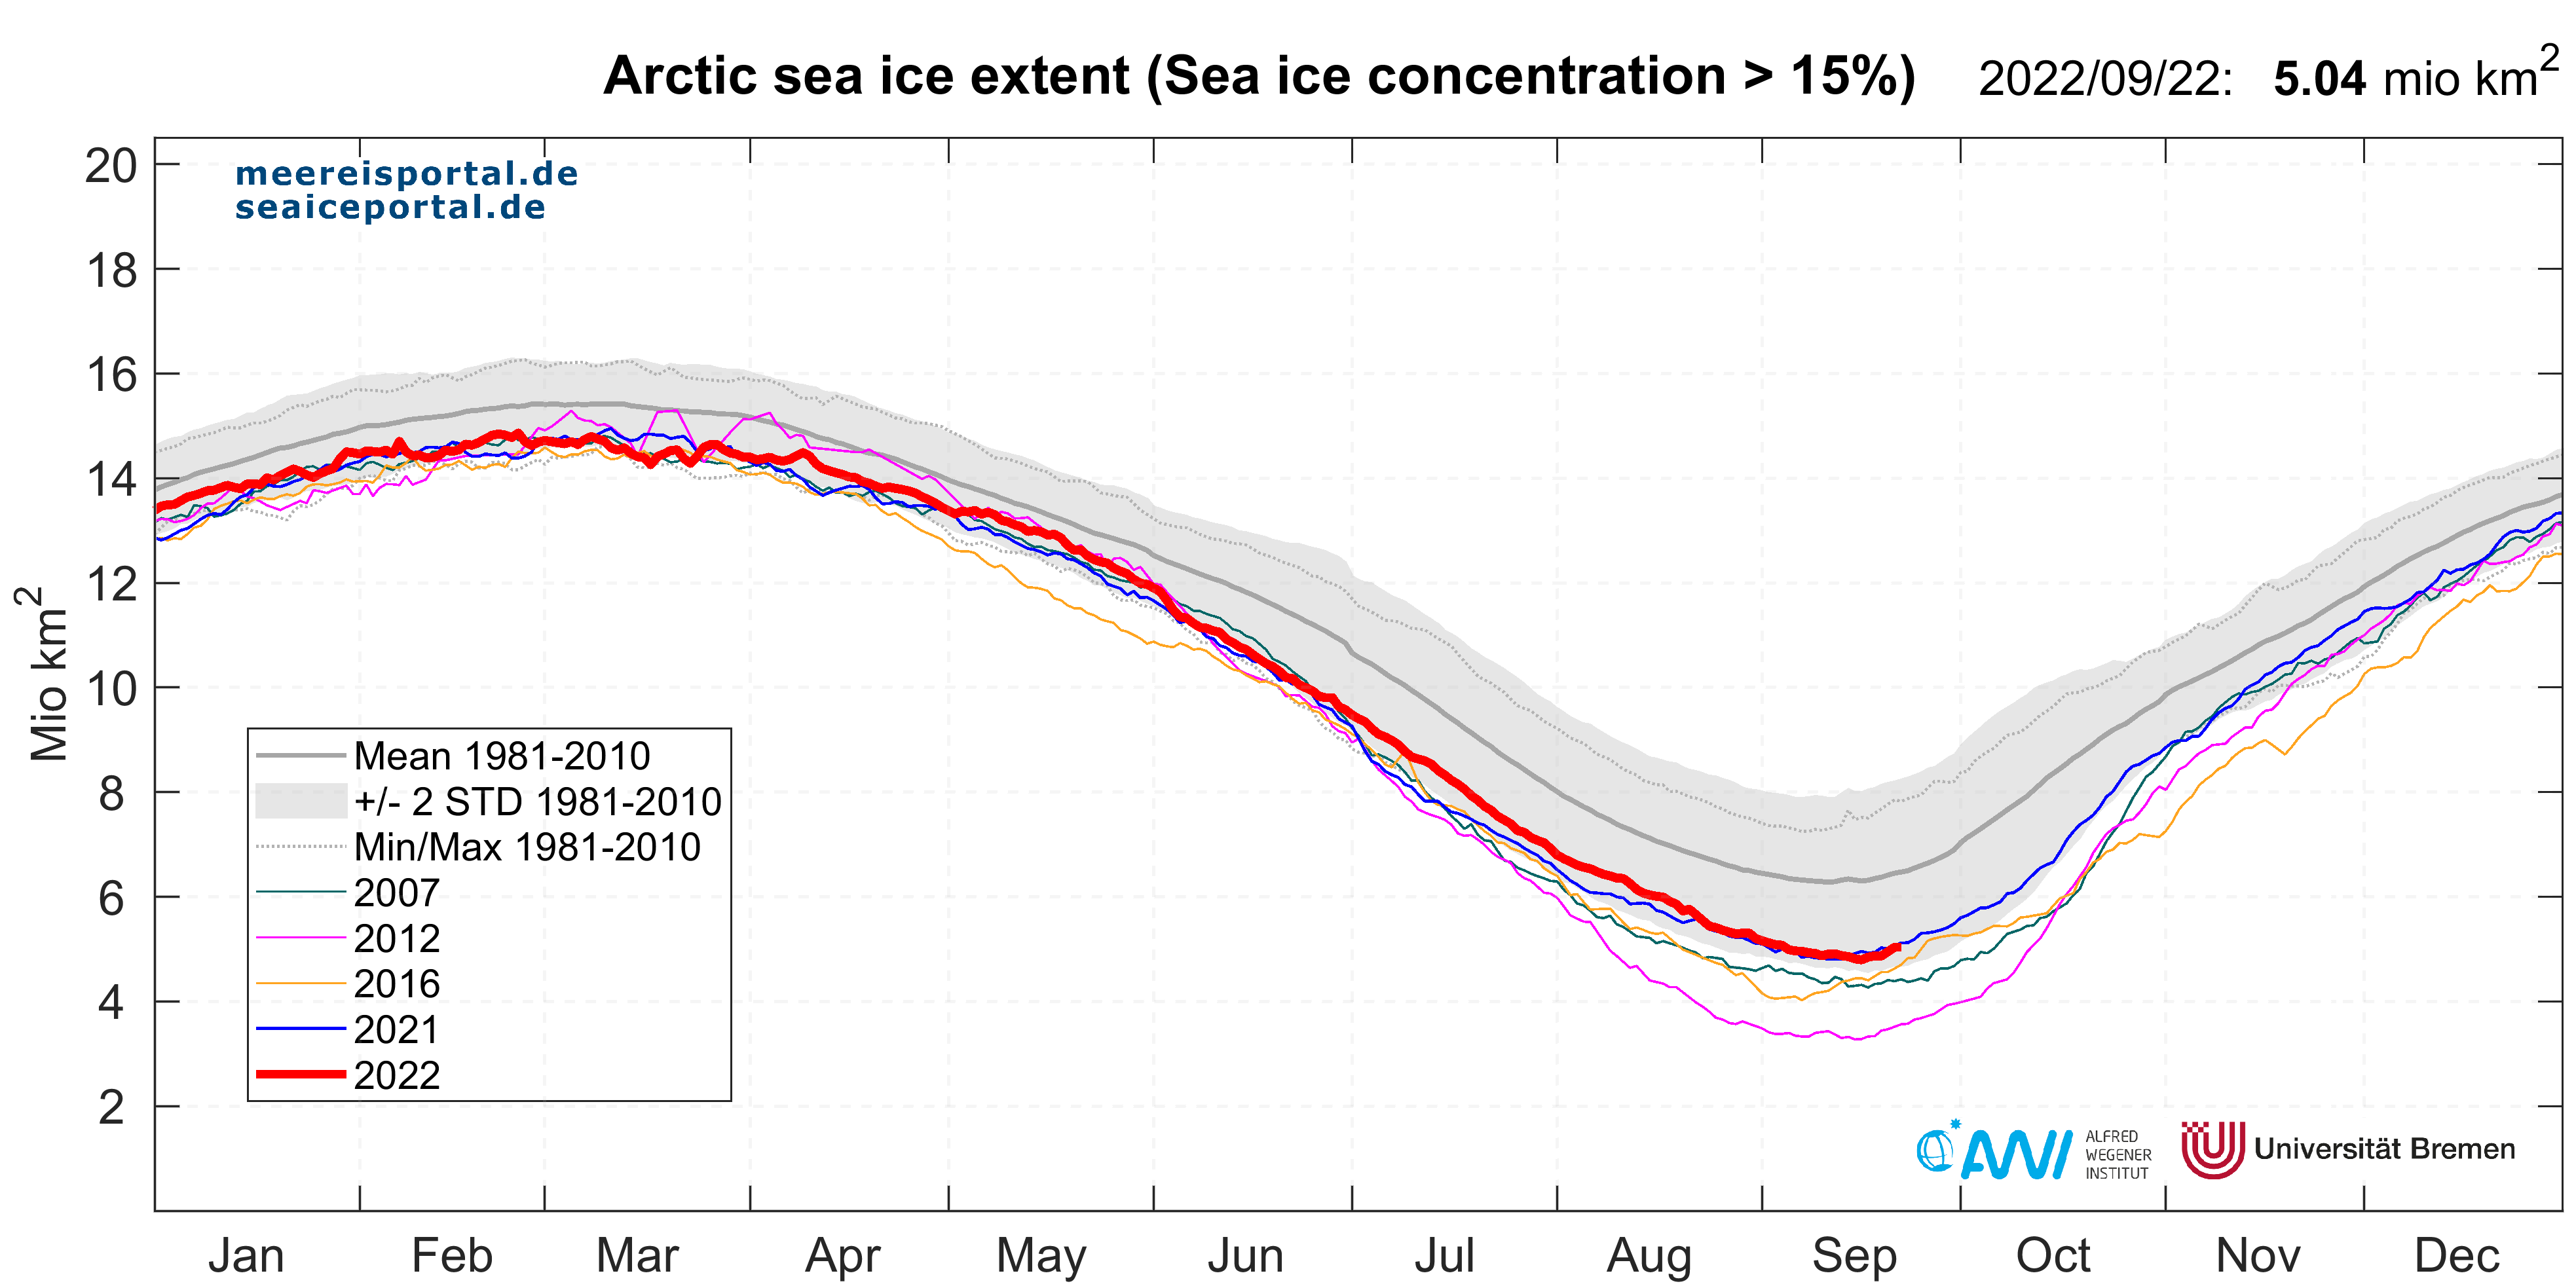
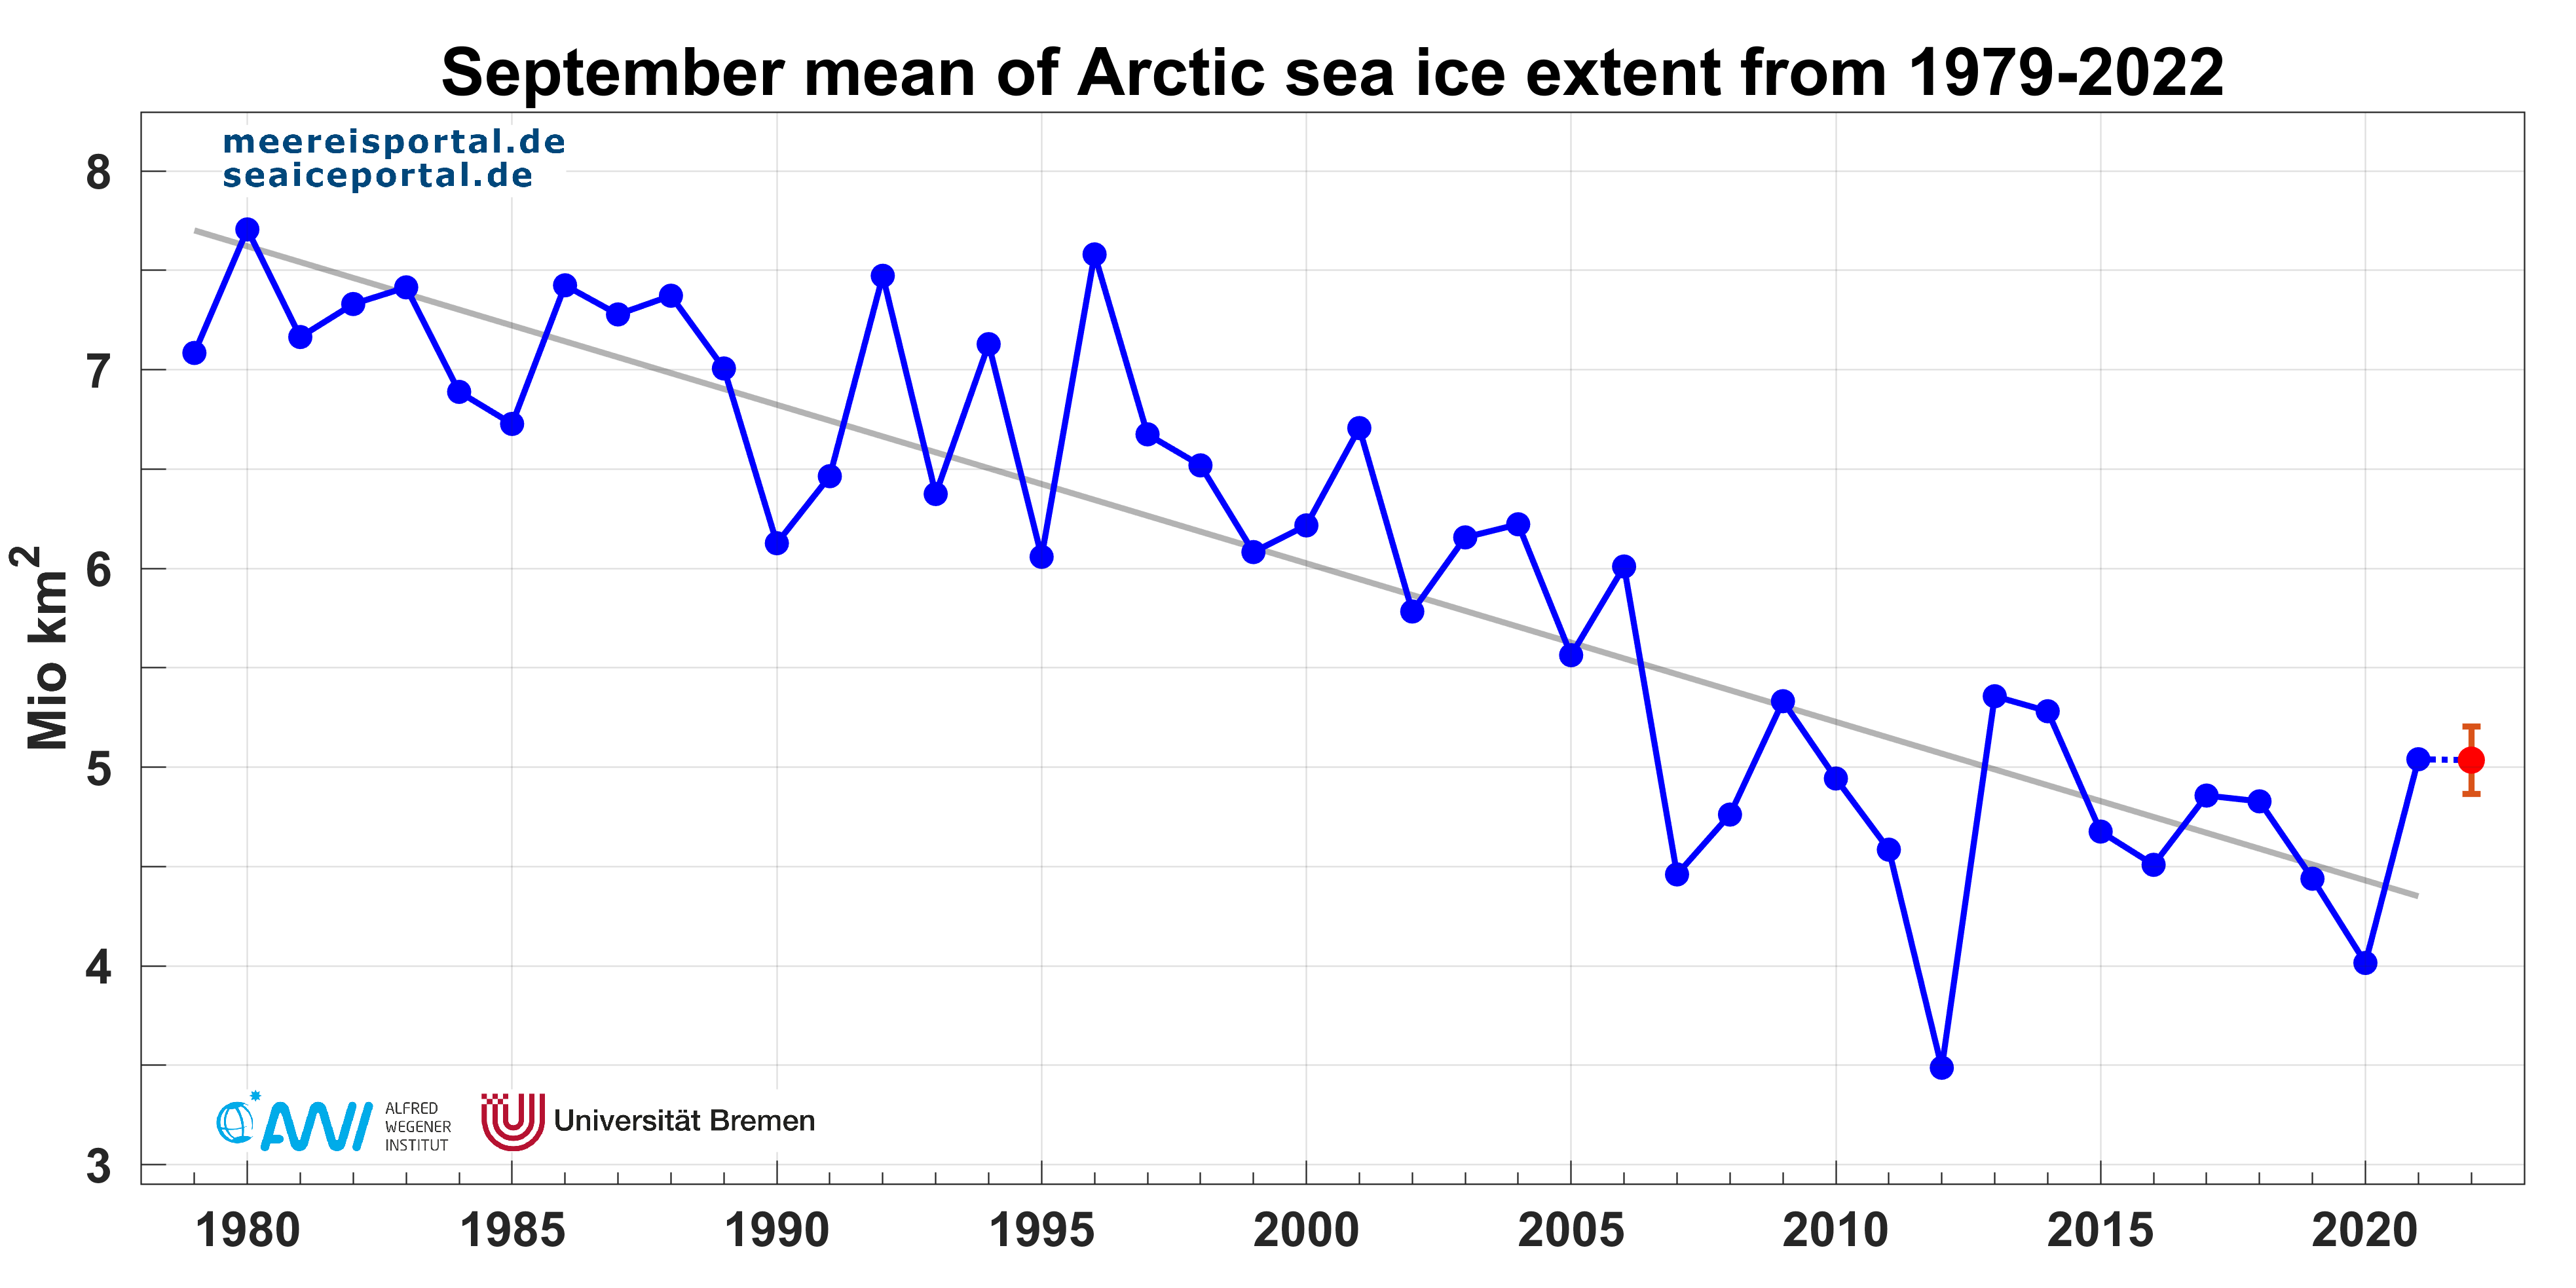
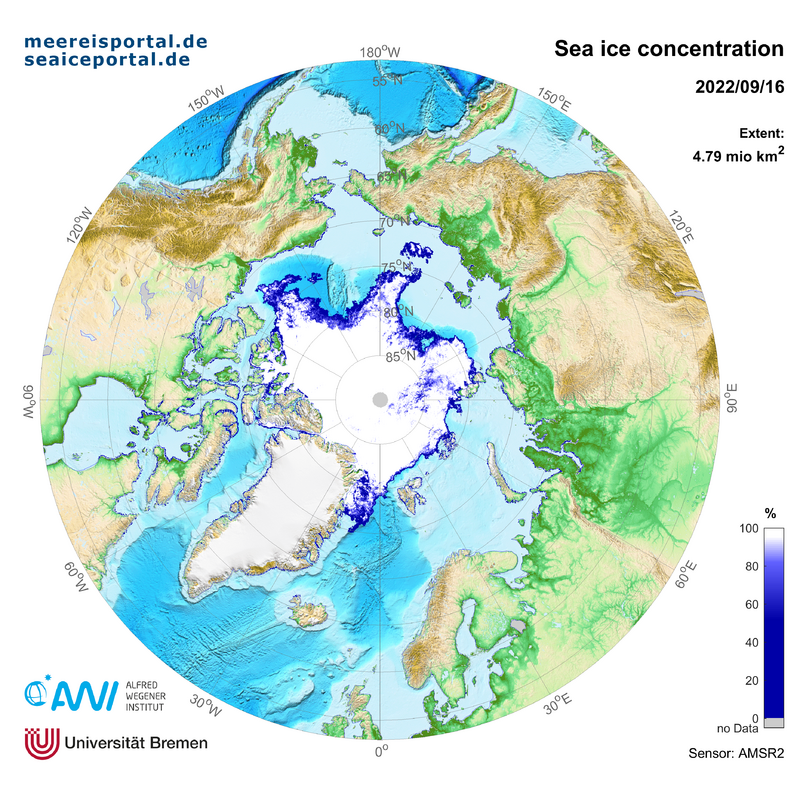
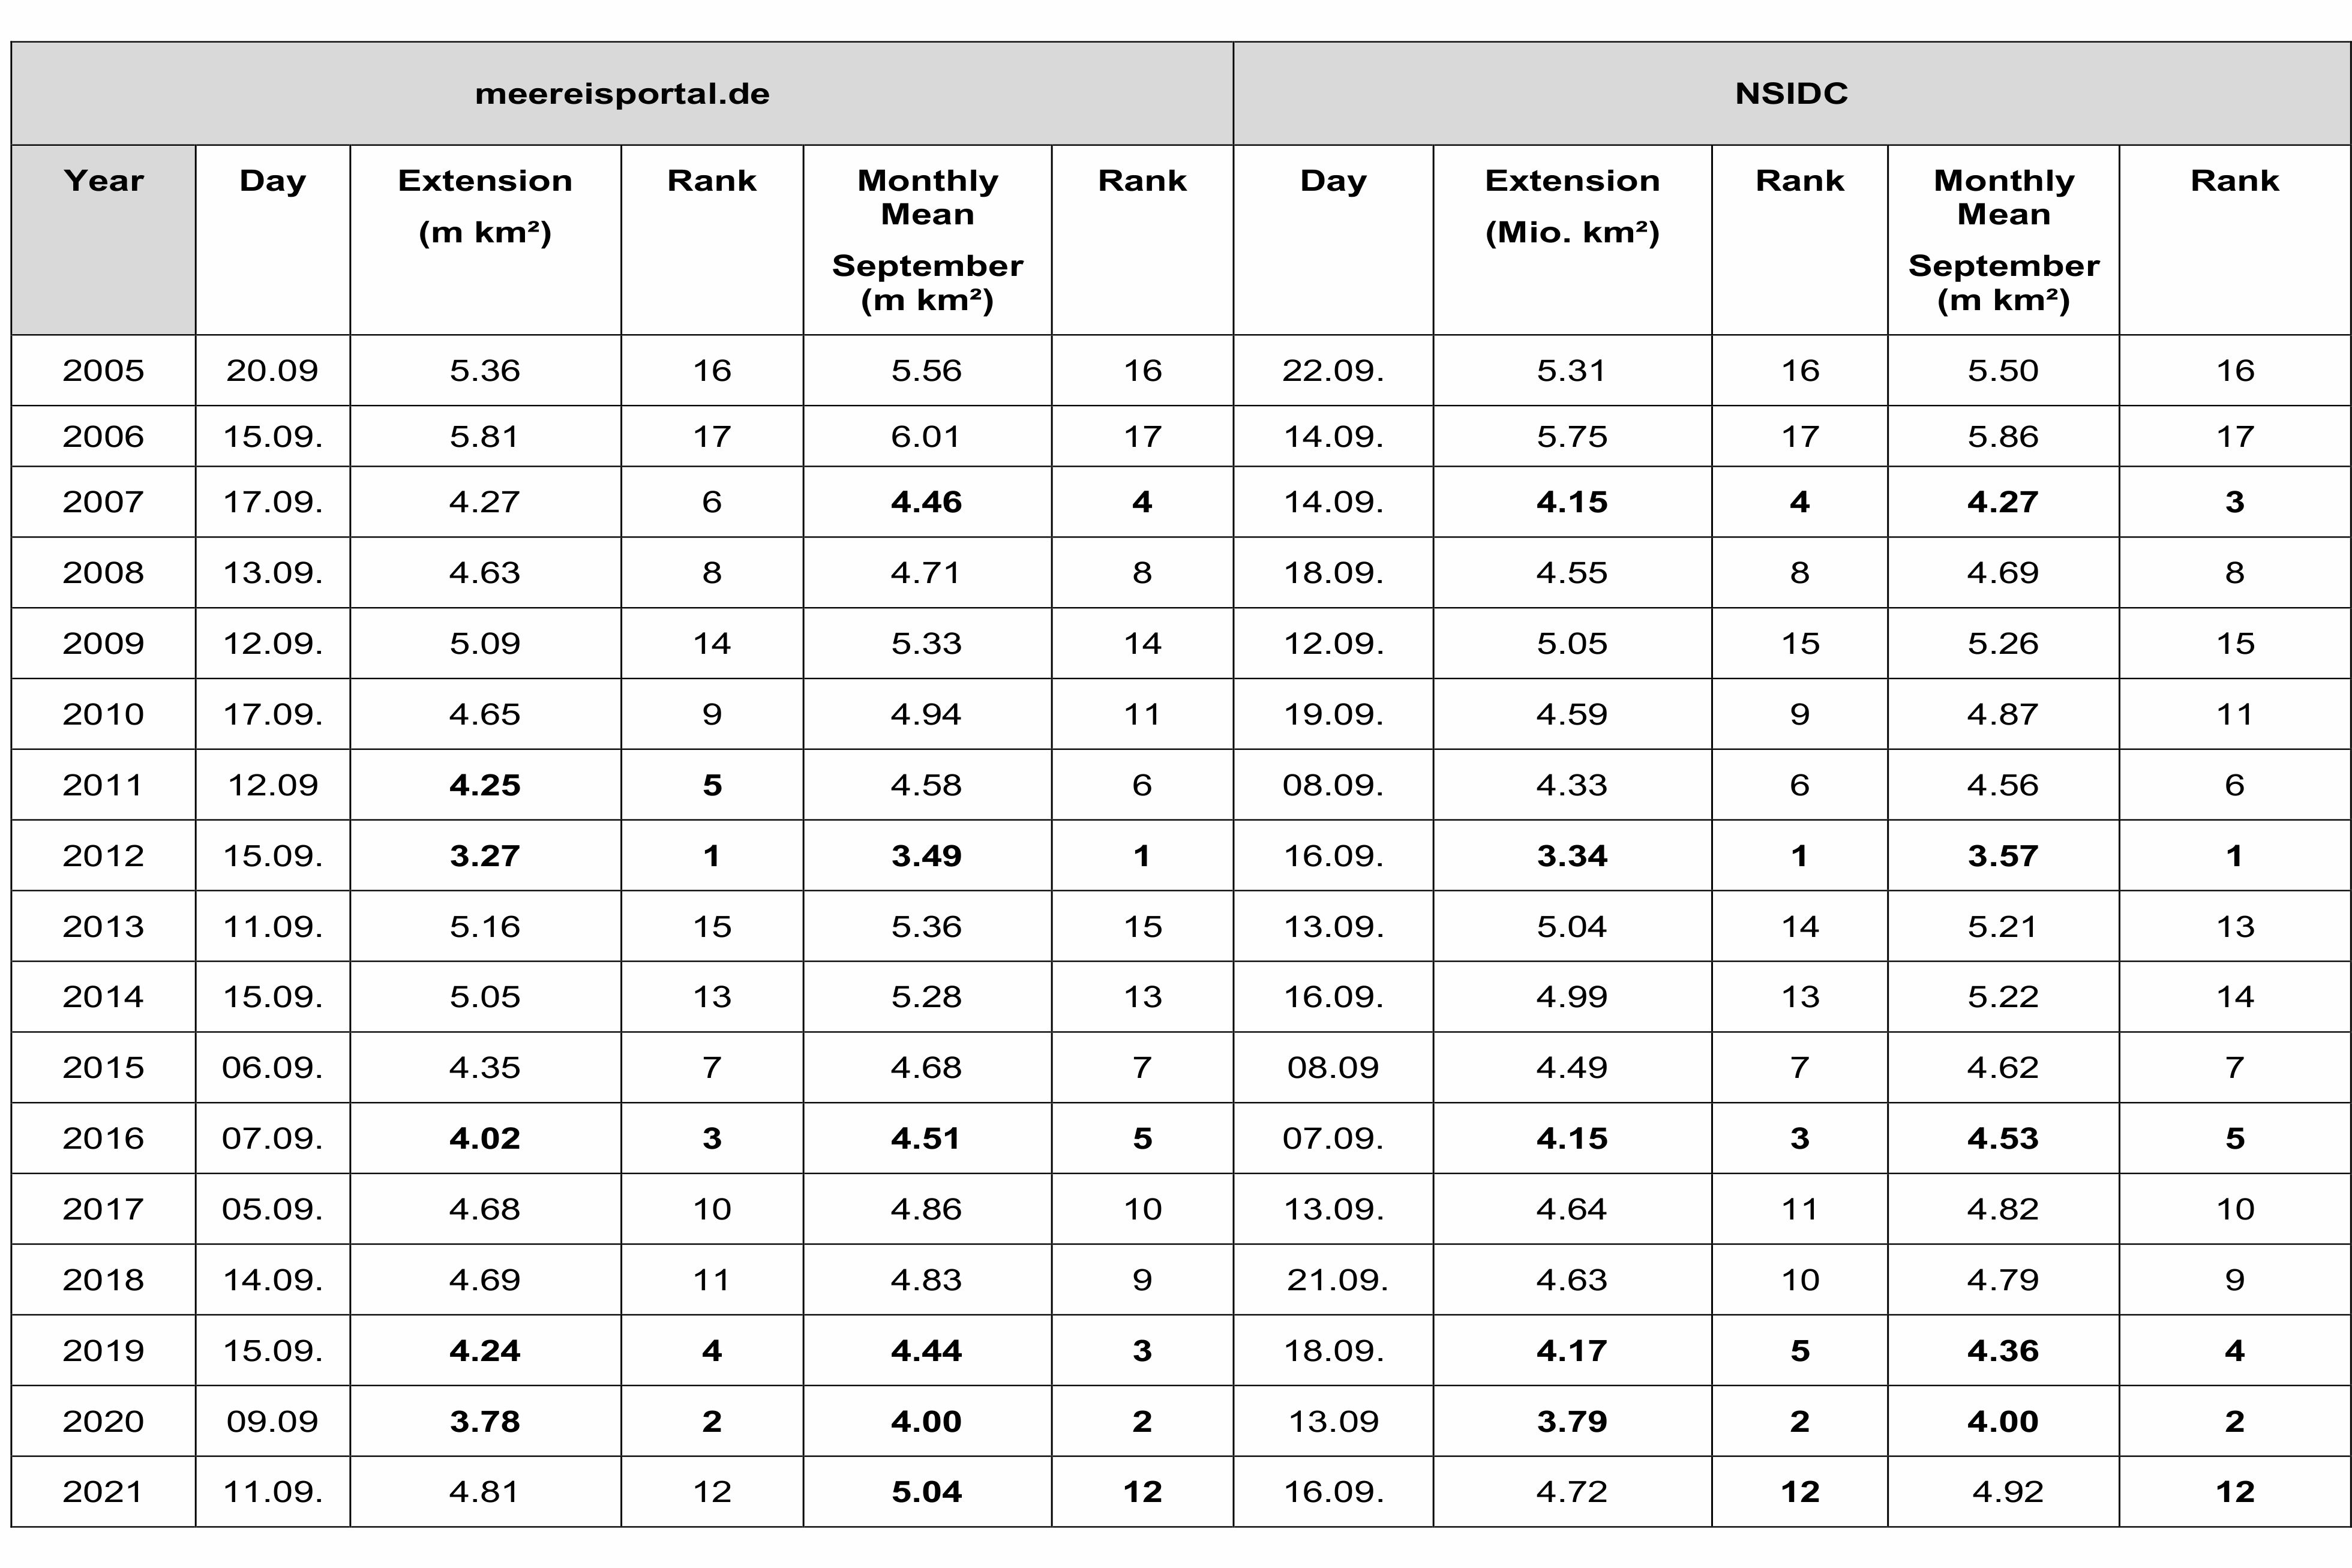
The mean ice extent for each month reflects the annual cycle of freezing and melting that the sea-ice cover undergoes. It is an expression of the atmospheric circulation, but also oceanic influences on the sea ice, and is the outcome of various factors. These include the atmospheric temperature, but also cloud cover and wind conditions, all of which affect the sea ice, e.g. in terms of its melting and drifting. Due to oceanic heat transport, warm water masses come into contact with the underside of the ice, producing basal melting. At the end of August, the daily ice extent was still 5.2 million km², while the monthly mean, at ca. 6 million km², came in at 13th place in the list of ice extents since 1979. This year's sea ice minimum was reached on 16.09.2022 and amounted to 4.79 million km² (s. Figure 4). On 25 September 2022, the ice extent was already 5.18 million km² and therefore comparable to the previous year (Figures 1, 4 and 5). As in the previous year, this summer didn’t have an unusually pronounced effect on the ice cover; nevertheless, the downward trend since 1979 continued and amounts to ca. 12% per decade (Figure 2). For this year, we expect to see a monthly mean of 5.0 +/- 0.2 million km², which would be 12th place on the list of lowest mean sea-ice extents (Table 1).
But if we take a closer look at the sea-ice extent and concentration, this year is characterised by a number of unique aspects:
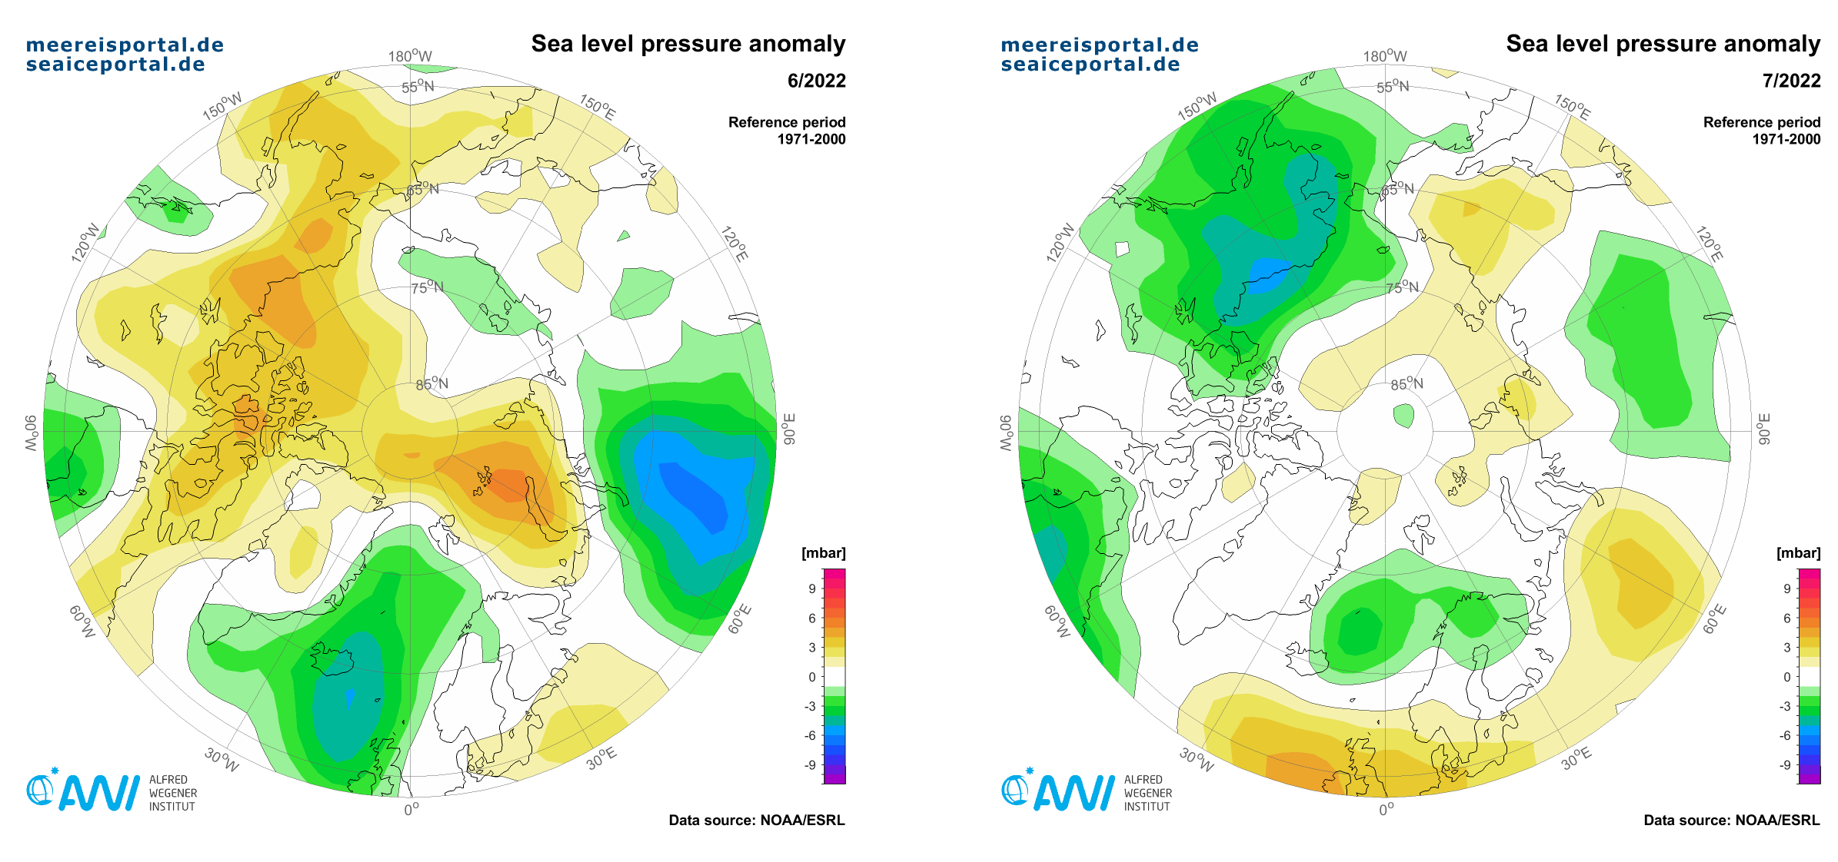
- After the winter ice extent in the Arctic – despite a warm snap in February and March of more than 6° C above the long-term trend in the Central Arctic – was fairly average, the spring and summer were marked by average temperatures on the whole (on average, 1 to 3 °C above the long-term trend). From April to August, the ice extent was consistently above the long-term declining trend, though it was always below the long-term average (s. Figure 2 for the month of September). Extensive pressure cells (high- and low-pressure areas) tended to form south of the Arctic Circle, blocking a direct exchange of air masses between the Central Arctic and middle latitudes. As a result, there were no inflows of warm air in the Central Arctic. These warm air masses meant dry weather and heat for the middle latitudes in Europe.
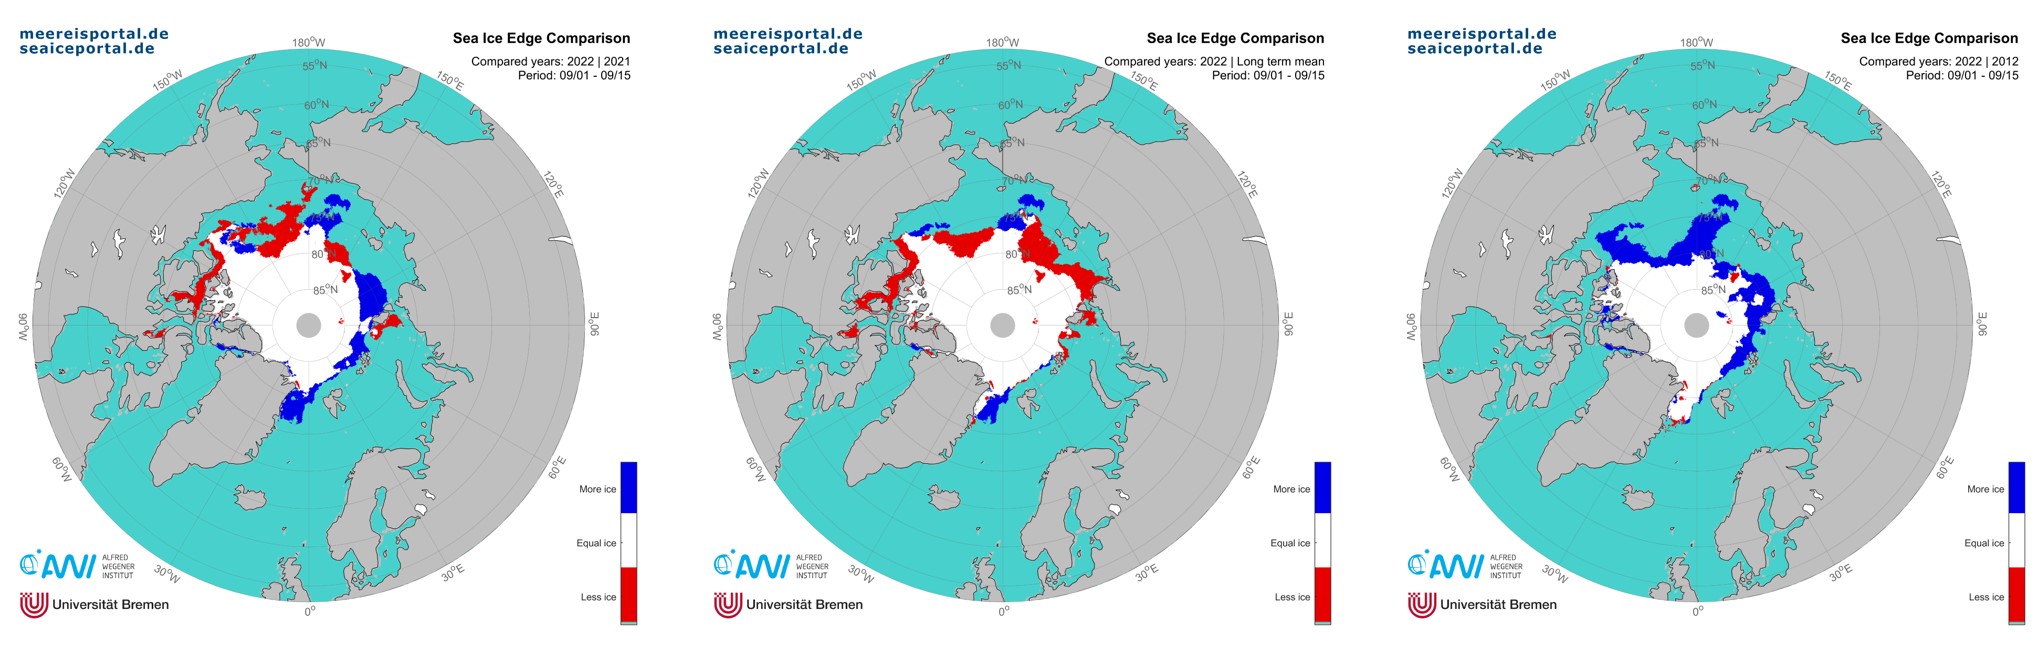
- On a regional scale, the East Siberian Sea and Laptev Sea have more ice than in the previous years (Fig. 3). This is due to the prevailing weather patterns in June and July (s. Figure 6), which limited the transport of sea ice from the Russian marginal seas to the Central Arctic, counteracting a rapid northward shift of the ice edge. There is also considerably more ice cover in Fram Strait and the East Greenland Sea, primarily due to a pronounced pressure gradient between Greenland and Svalbard in August.
- One fairly unusual development: the formation of large patches of open water in the Central Arctic in early June (Figure 7). The widespread breakup of the solid pack ice in the region was the result of a divergent ice drift produced by a large low-pressure system over the northern Laptev Sea in late June. Consequently, ice in more southerly regions was pushed back toward the Russian coast, while the ice farther north drifted toward Fram Strait. In the course of the summer, the anomaly drifted farther to the west and remained visible into September. Somewhat below-average ice cover for the end of winter in the Laptev Sea and East Siberian Sea may have been conducive to this development.
- Both the Northwest and Northeast Passage opened in late August (read more here).
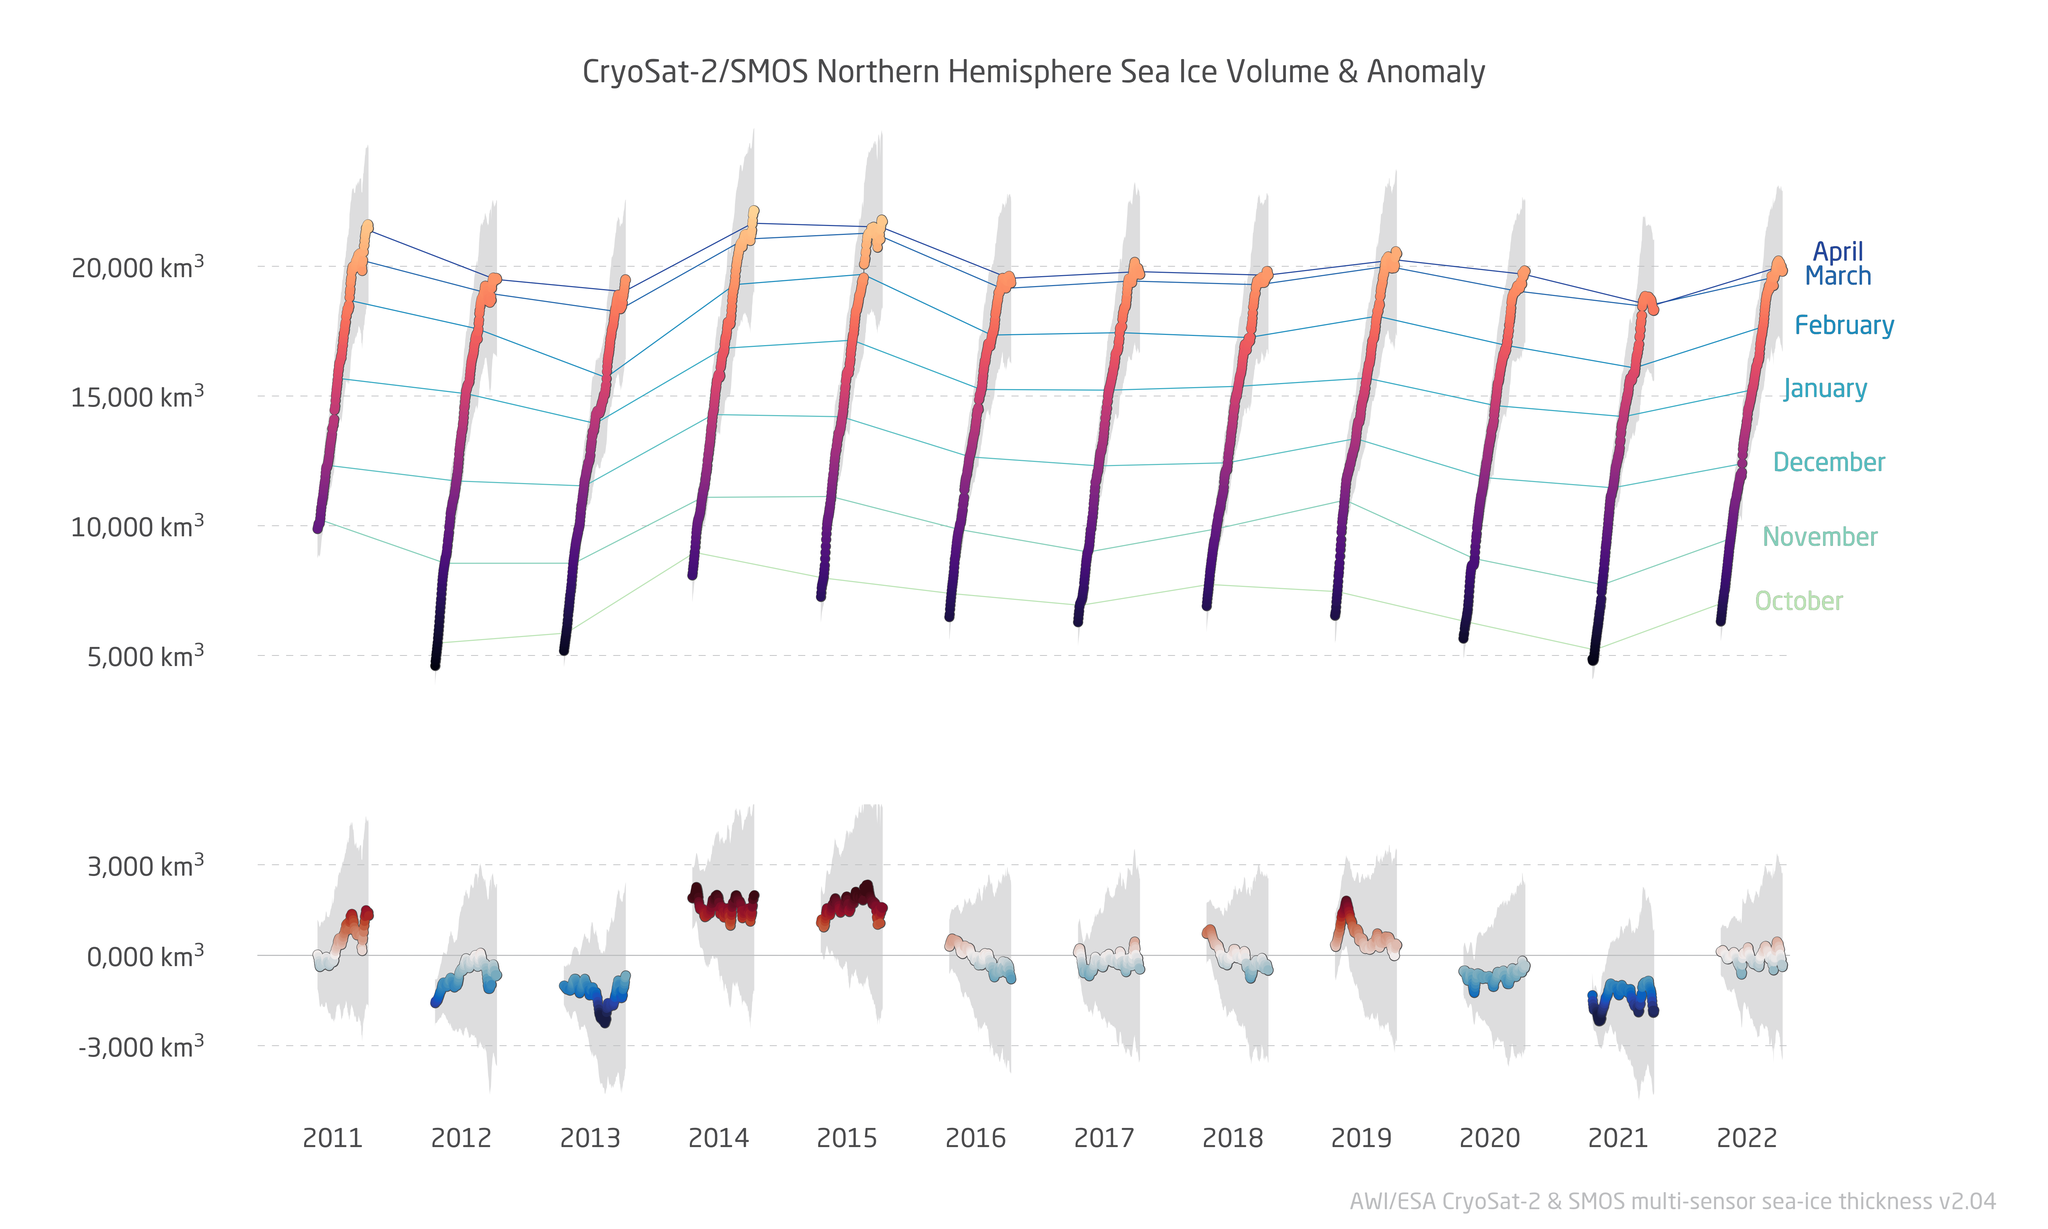
A further important factor influencing the speed of ice retreat in the summer months is, beside air temperatures and oceanic heat transport, the ice’s thickness at the end of winter. Here, too, data from the ESA satellites CryoSat-2 and SMOS paint a fairly moderate picture: from October to April, the ice volume in the Arctic in winter 2021/2022 (Fig. 8) was consistently similar to the long-term average (2011 – 2021). The lack of large expanses with particularly thin ice at the end of winter, together with reduced transport speed toward Fram Strait (Fig. 9), must have had a positive effect on the summer ice extent.
Ice-thickness measurements gathered in the Arctic with the polar aeroplane Polar 6 at the end of summer provided data on the variability of and changes in the sea-ice thickness and surface characteristics in Fram Strait and the vicinity. In comparison to past measurements in the region, which were taken over the past two decades, the observed ice thicknesses roughly match the average for the past 11 years (2010 – 2021). That being said, the trend toward steadily declining ice thickness continued in 2022. The Meereisportal previously reported on the outcomes of the IceBird campaign in a separate article.
“Even if this summer didn’t break any records in the Arctic, in the long-term comparison the ice cover is still very low, and we believe the long-term sea-ice retreat will continue. This summer showed once again that the sea-ice cover is determined by both long-term trends and short-term, substantial year-on-year variations caused by the weather and ocean currents,” says Prof Christian Haas, Head of the Sea Ice Physics Section at the AWI, summarising the 2022 melting season. “These variations remain difficult to predict and call for more comprehensive, systematic and continuous observation, as well as improved climate models,” adds his colleague Dr Gunnar Spreen from the University of Bremen.
Literature
- climate.copernicus.eu/copernicus-summer-2022-europes-hottest-record
- Rantanen, M., Karpechko, A.Y., Lipponen, A. et al. The Arctic has warmed nearly four times faster than the globe since 1979. Commun Earth Environ 3, 168 (2022). https://doi.org/10.1038/s43247-022-00498-3; https://www.nature.com/articles/s43247-022-00498-3
- Lavergne, T.: Validation and Monitoring of the OSI SAF Low Resolution Sea Ice Drift Product (v5), Technical Report, The EUMETSAT Network of Satellite Application Facilities, July 2016.
Contact
- Dr. Klaus Grosfeld (AWI)
- Prof. Dr. Christian Haas (AWI)
- Dr. Stefan Hendricks (AWI)
- Dr. Monica Ionita (AWI)
- Dr. Lars Kaleschke (AWI)
- Dr. Thomas Krumpen (AWI)
- Dr. Christian Melsheimer (IUP Bremen)
- Dr. Marcel Nicolaus (AWI)
- Dr. Gunnar Spreen (IUP Bremen)
- Dr. Renate Treffeisen (AWI)
Questions?
infoprotect me ?!meereisportalprotect me ?!.de
Graphics


 and monthly means in the Arctic from 2005 to 2021.")


 and monthly means in the Arctic from 2005 to 2021.")