In the Antarctic, the month of February is considered to be high summer in terms of the seasonal decline in sea-ice extent. The extent reaches its lowest point in the year, while in the course of the month, the melting ends and the freezing season begins, usually in the second half of the month. After dropping below the prior record low from 2022 on 8 February 2023, a new all-time low of 2.0 million km² – ca. 260,000 km² below the old record – was reached on 19 February (Figures 1 and 2). The additional area melted compared to last year was somewhat larger than the United Kingdom (243,000 km²) and impressively demonstrates how much more ice disappeared during this year’s Southern Summer.
Together with the absolute minimum sea-ice extent, the monthly mean also reached a new low, as the extent was lower than last year’s minimum on 23 of 28 days. At 2.15 million km² (monthly mean), there had never been so little sea ice hemming the Antarctic mainland (Figures 3 and 7). This equates to ca. 30% less sea ice than the long-term mean for the years 1981 – 2010 (3.1 million km²). As such, the sea-ice extent trend for the month of February changed from a slightly positive to a slightly negative figure of -0.4% +/- 2.4% per decade, though the value is not statistically significant. With values below the long-term mean, the intensified summer melting in the Antarctic continued for the eighth consecutive year, a trend for February never before seen in the 44 years since the beginning of continuous ice observations in the Antarctic.
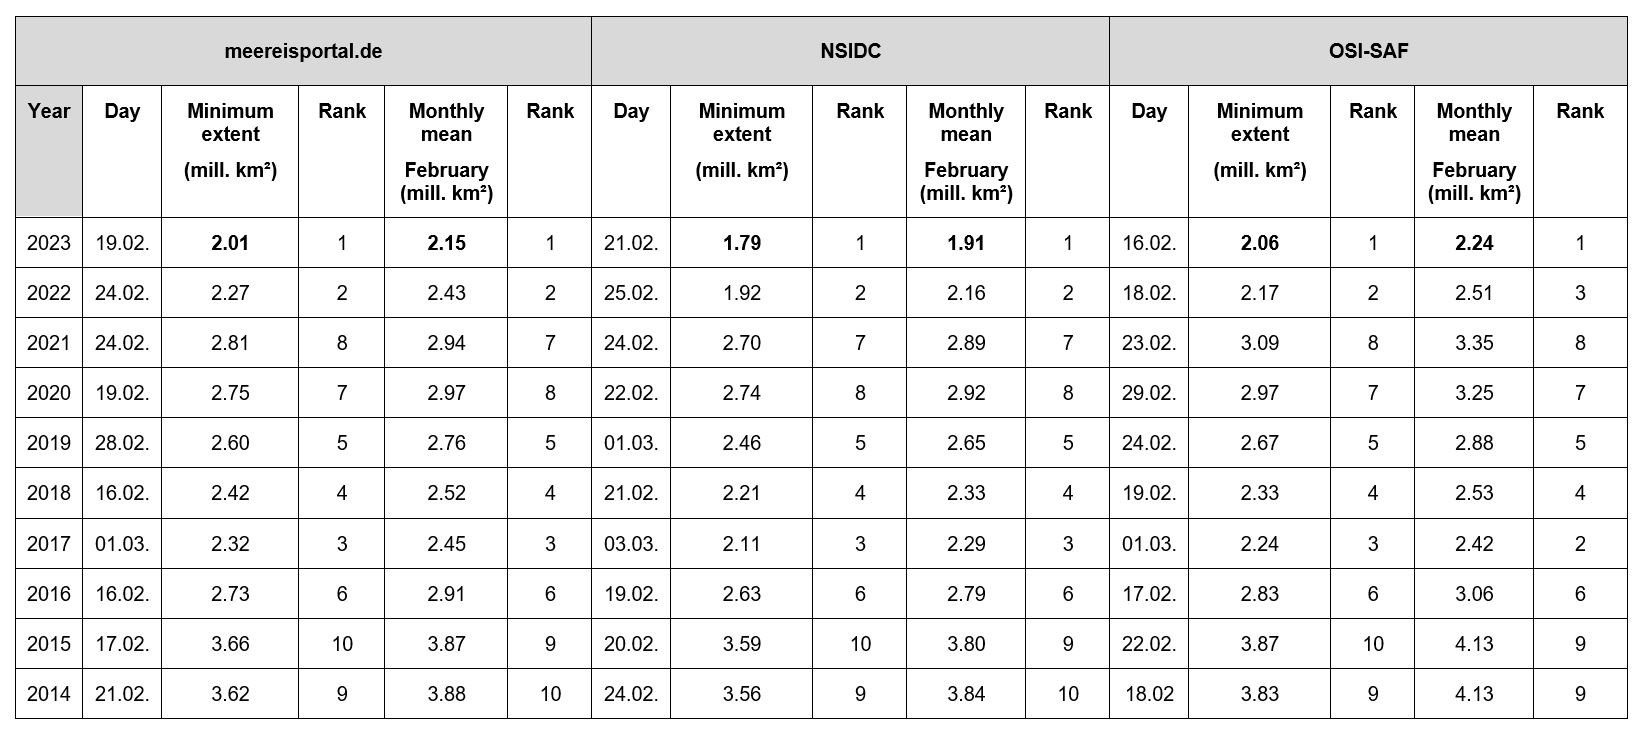
For anyone interested in the sea-ice development, one important aspect is how scientific institutes around the globe derive the sea-ice extent and which values they calculate. All calculations are based on satellite readings of the microwave radiation emitted by the ice and the ocean’s surface. However, in some cases different satellites, channels and therefore frequency ranges are used. Passive microwave sensors (radiometers) mounted on satellites (e.g. ESMR, SMMR, SSM/I, and AMSR-E/AMSR2) have been regularly supplying the requisite data for roughly 50 years. Accordingly, satellite-based microwave radiometers are without a doubt the “beasts of burden” in this regard.
The data currently used by the SEA ICE PORTAL is based on readings from the AMSR2 instrument on board the satellite GCOM-W (Global Change Observation Mission – Water), operated by JAXA (the Japan Aerospace Exploration Agency). Similar data is analysed by e.g. the US National Snow and Ice Data Center (NSIDC) and Europe’s Ocean and Sea Ice Satellite Application Facilities (OSI-SAF). Each institute uses its own analytic algorithms, which are in turn based on different combinations of channels. The spatial resolution varies as well. For example, the sea-ice concentrations posted at the SEA ICE PORTAL, with a resolution of ca. 5 km, are “sharper” than those calculated by other institutes (15 / 25 km). Further, there are differences in the land-sea layers and how the data from different sensors has been aligned or “intercalibrated” over the 44-year time series. This leads to variances in the identification of ice-covered regions, which influence the calculation of overall ice cover. “Accordingly, there is no absolute reference value; instead, the analytic algorithms are successfully improved and refined as new findings come to light. As a result, they also produce calculations of the sea-ice extent that can differ by as much as 200,000 km². But when it comes to calculating trends, the differences are much less pronounced. The trends are very robust and differ only slightly between the different datasets,” explains Gunnar Spreen from the University of Bremen’s Institute of Environmental Physics. A comparison of the results for the 2023 minimum is provided in Table 1.
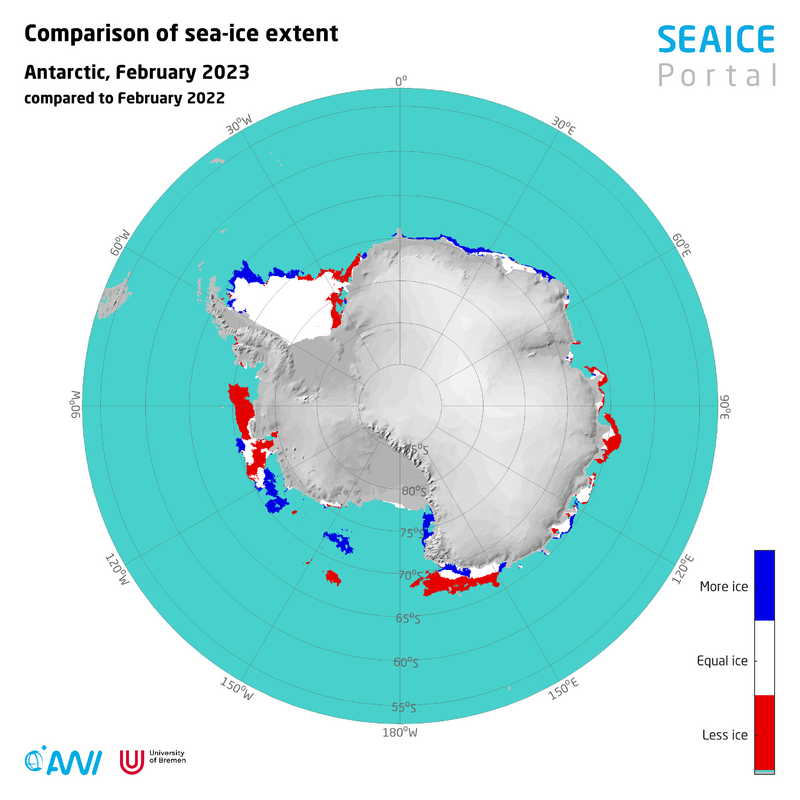
As reported in previous months, this year the melting particularly continued in the Bellingshausen and Amundsen Seas, both of which are virtually ice-free. In the eastern Ross Sea, in the Pacific sector, and in the eastern Weddell Sea, there is less sea ice than in the same month last year, while there is somewhat more ice cover than before in the Indian sector and the western Weddell Sea. Nevertheless, ice cover is below the mean in all regions (Figure 4).
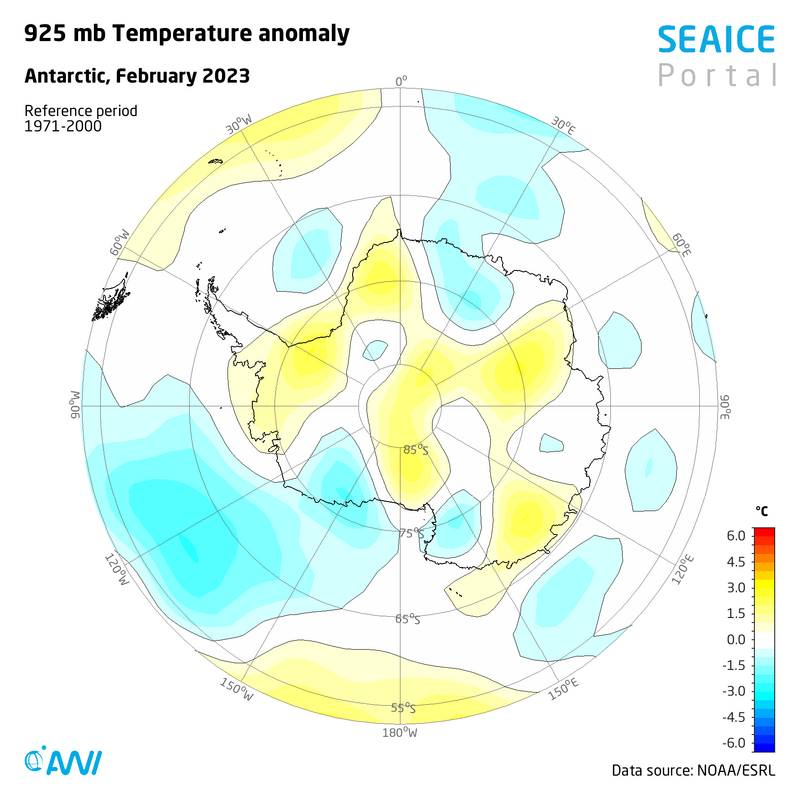
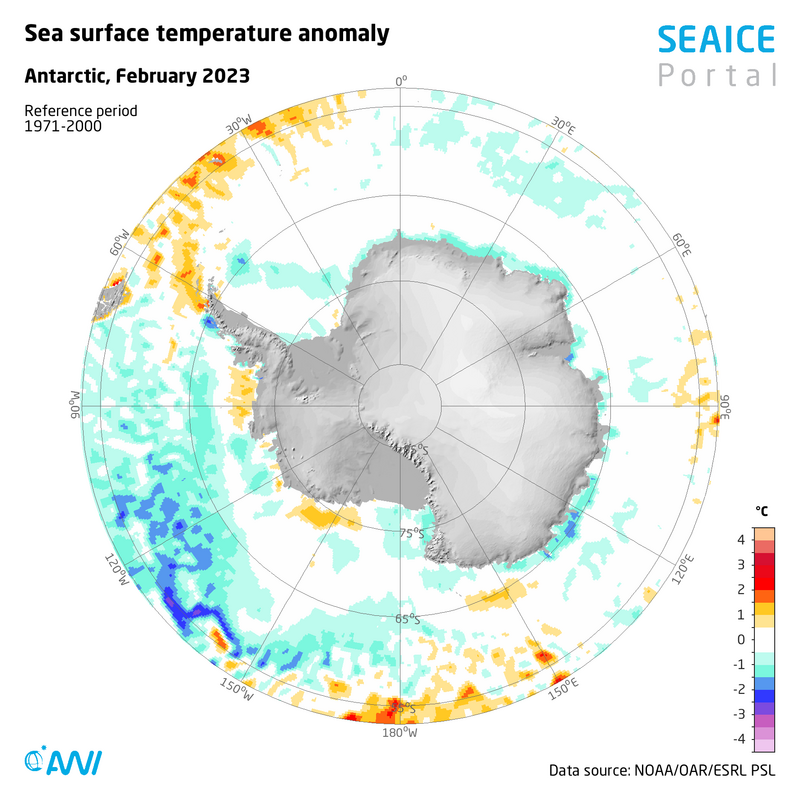
The cause of this more intensive melting could lie in a combination of unusually high air temperatures of up to 2 °C above the long-term mean for the years 1971 – 2000 in broad expanses of the Antarctic on the one hand, and warm ocean surface temperatures of up to 1.5 °C above the long-term mean on the other (Figures 5 and 6). In the Bellingshausen Sea and western Ross Sea, there are large, warmer water masses extending near the coastline / ice-shelf edge, which, when they penetrate ice-shelf cavities, can intensify ice-shelf melting and contribute to accelerated glacier melting. However, whether or not these warmer water masses actually penetrate the cavities can only be determined by in-situ observations from moorings or made with a rosette sampler (CTD sampler) in the respective region.
All analyses of the Antarctic as a whole have identified a new record low, continuing the trend seen in the past several years. This must now be assessed in terms of its cause and potential future developments. Consequently, Spreen summarises the Southern Summer as follows: “Eight straight years of extremely low sea-ice extents indicate that climate change has increasingly spread to the Antarctic.”
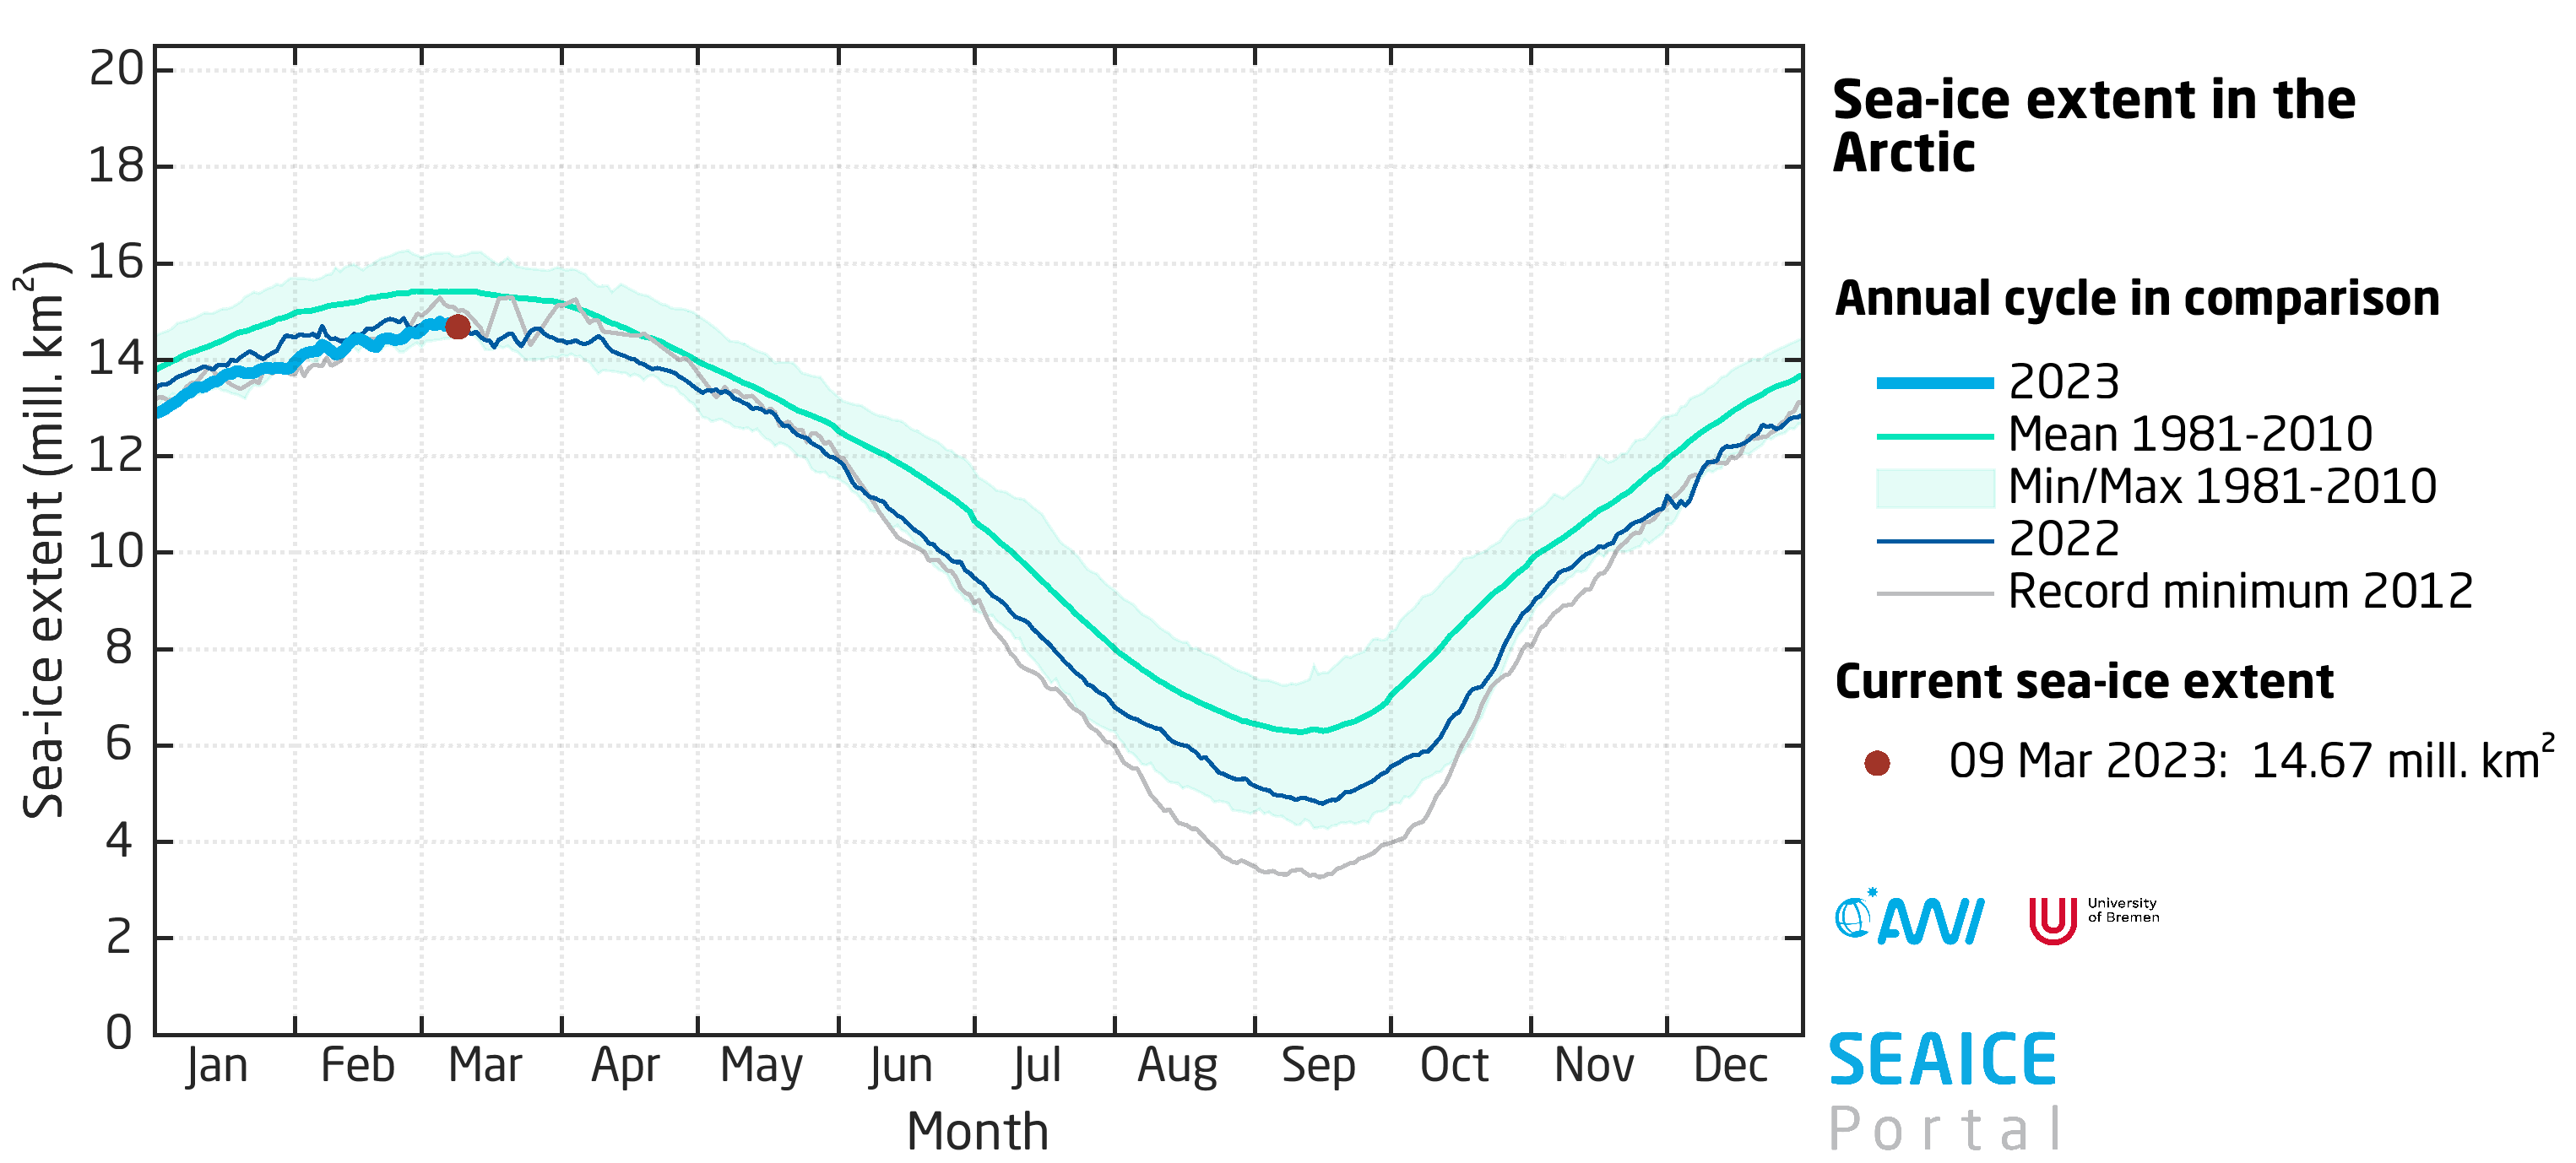
Sea ice in the Arctic nearing its winter maximum
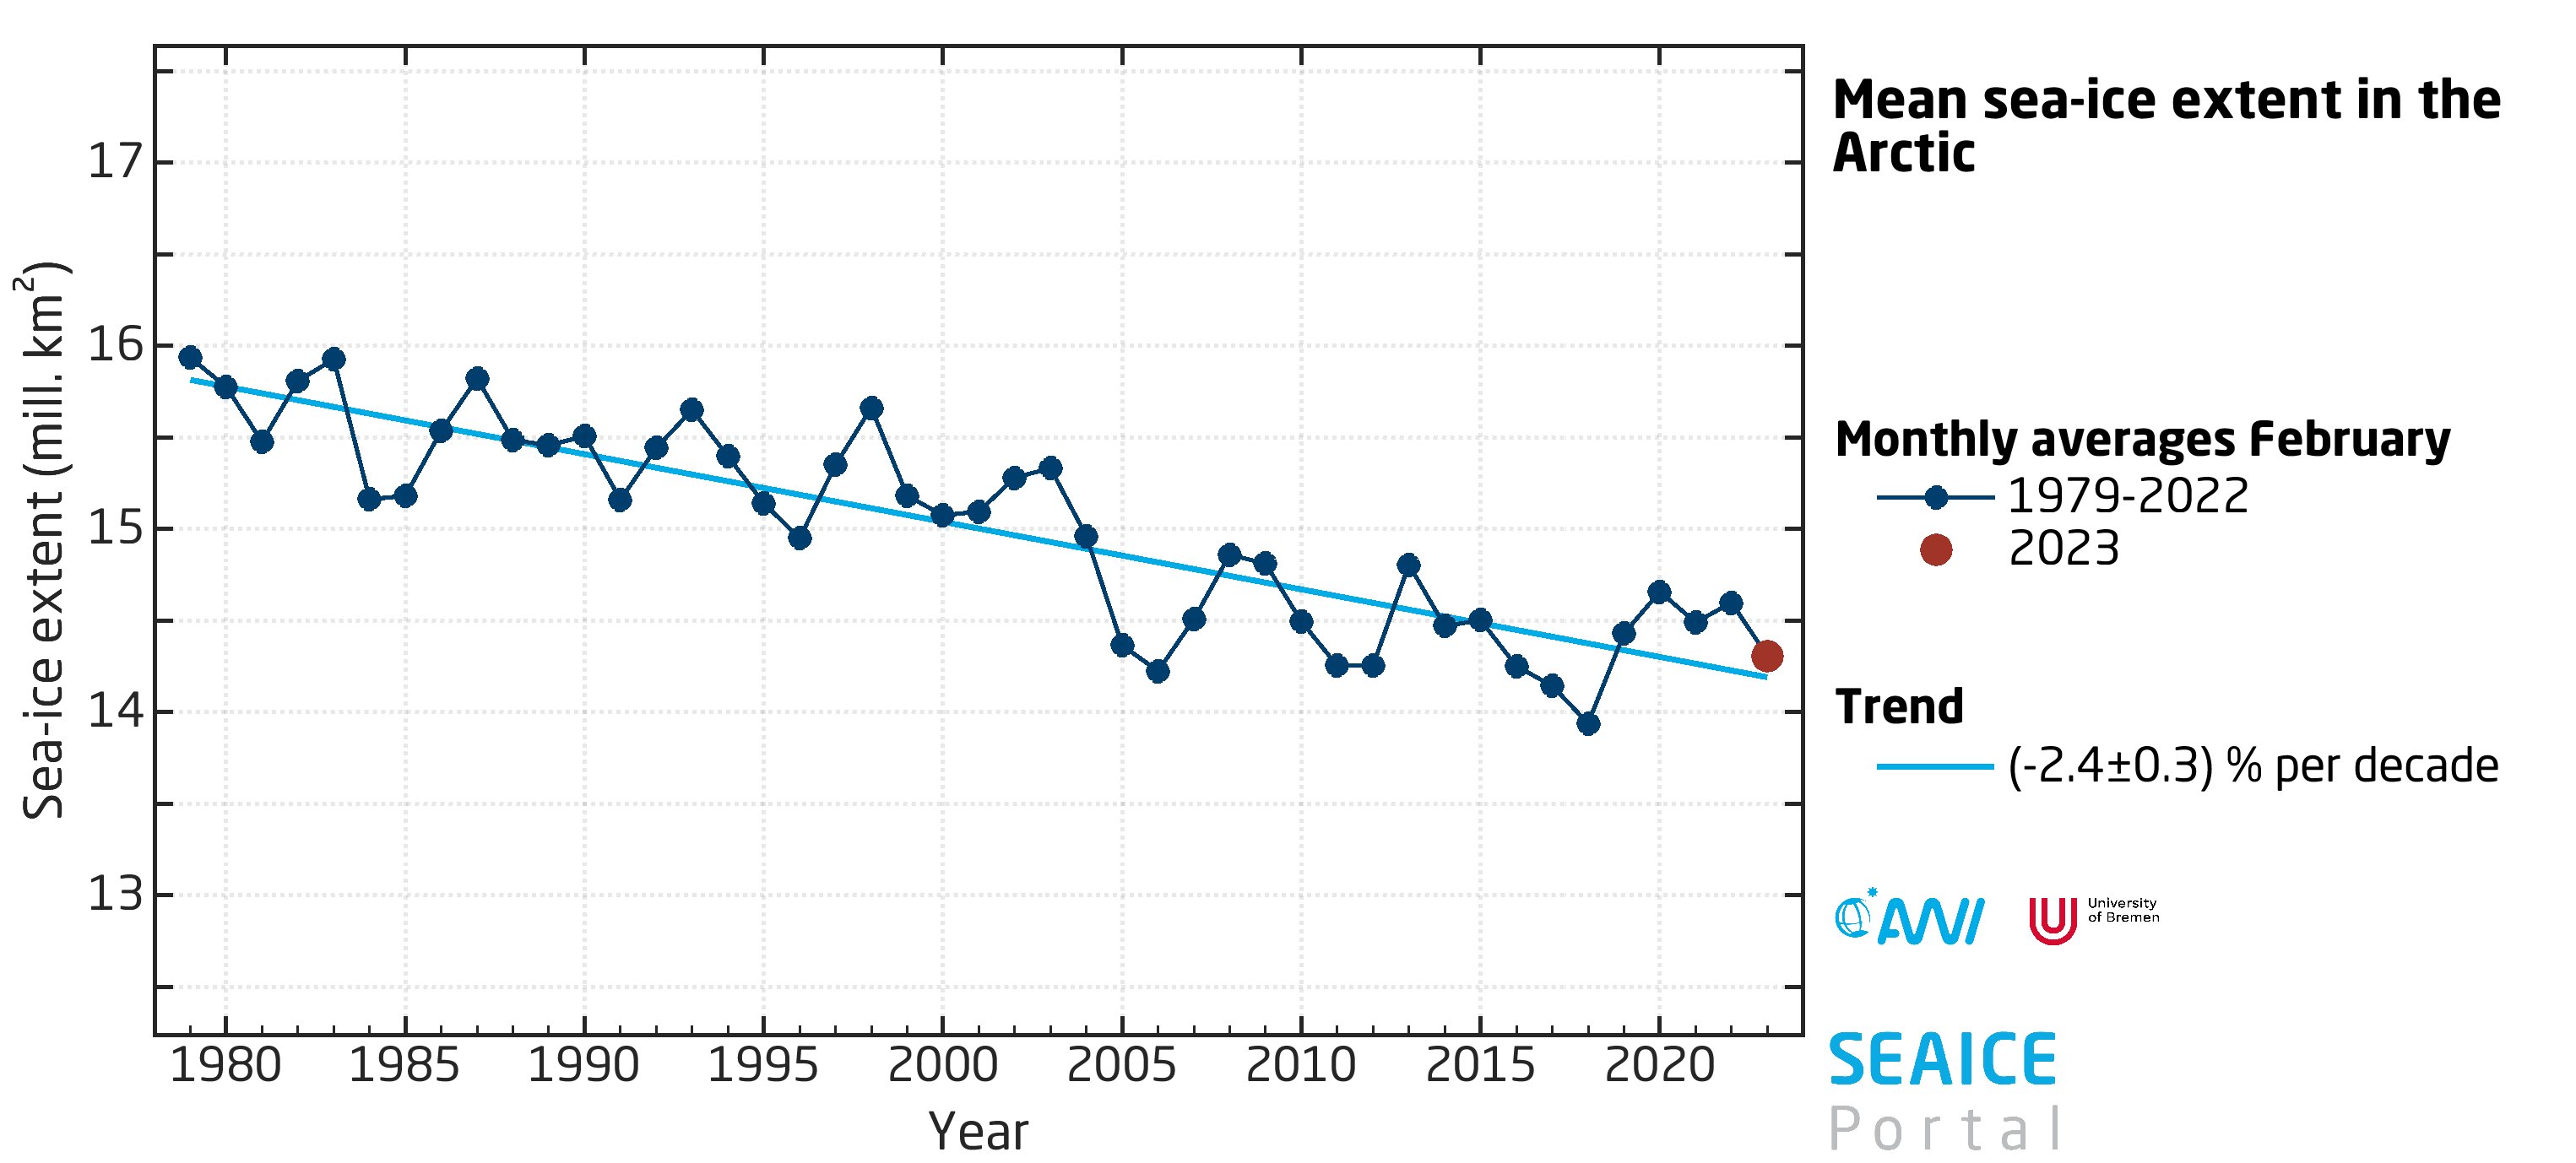
Whereas the summer is drawing to a close in the Antarctic, the freezing season is nearly over in the Arctic. Though the maximum sea-ice extent hasn’t yet been reached, its mean level in February, at 14.31 million km², was the seventh-lowest since 1979 (Figure 8). The daily sea-ice extent (Figure 9) is at the lower edge of the minimum / maximum scale for the long-term comparison period 1981 – 2010 but is a far cry from making 2023 the year with the lowest winter sea-ice extent; that distinction goes to the year 2017, at 14.48 million km². The maximum ice extent in the Arctic this year was most likely reached on 5 March 2023 with 14.79 million km². An assessment of the winter sea-ice development in the Arctic and the transition into the melt season will be discussed in the next news.
Contact
- Dr Gunnar Spreen (Uni Bremen)
- Dr Christian Melsheimer (Uni Bremen)
- Dr Klaus Grosfeld (AWI)
- Dr. Renate Treffeisen (AWI)
Questions?
Contact us by E-Mail or use our contact form.


