
The SEA ICE PORTAL – chronicle of a disappearing world
Today, sea ice covers roughly 7 percent of the ocean. It cools the entire planet, affects ocean currents, and offers a habitat for countless species. Due to climate change, sea ice is rapidly disappearing – with consequences for the entire planet. We’re experts on sea ice. Here we share what we know – hot off the press, scientifically sound, and in accessible language.
Home
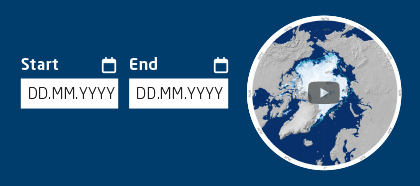
Sea-ice concentration, updated daily
Sea-ice concentration, updated daily
The sea-ice concentration map shows the amount of sea-ice cover as a percentage.
An ice concentration of 100% indicates a seamless sheet of sea ice. Ice concentrations of less than 15% are considered to be ice-free.
The green line is a climatological reference value and shows the monthly mean sea-ice extent for the years 1981 – 2010. The sea-ice extent is the sum of all ice-covered regions (i.e., all regions with an ice concentration of at least 15%) and is measured in millions of square kilometres.
Data provided by the University of Bremen’s Institute of Environmental Physics (IUP) in collaboration with the Alfred Wegener Institute, Helmholtz Centre for Polar and Marine Research (AWI). You can find further information on the base data and additional maps at our data portal.


Sea-ice extent, annual cycle
Sea-ice extent, annual cycle
The annual cycle of the sea-ice extent describes the total ice-covered area in the Arctic or Antarctic in millions of square kilometres, using the data from the current year (blue line) in comparison to past years. The sea-ice extent is the sum of all ice-covered regions with an ice concentration of at least 15%.
For the sake of comparison, the respective previous year and the year with the lowest summer sea ice extent to date are shown, which coincide for the year 2022. Hence, only one comparison curve is shown. In addition, the climatological mean value for the years 1981 – 2010 (green line) and the span of the minimum / maximum values (green lines) during this period.
Data provided by the University of Bremen’s Institute of Environmental Physics (IUP) in collaboration with the Alfred Wegener Institute, Helmholtz Centre for Polar and Marine Research (AWI). You can find further information on the base data and additional maps at our data portal.

The last month compared to past years
The last month compared to past years
Since 1979, the extent of the polar sea ice has been continually monitored using satellites. The graphic shows the respective monthly mean values for the ice extent in the years 1979 to the present. Here, long-term trends in the sea-ice cover of both the Arctic and Antarctic can be seen. As such, the development of the mean monthly sea-ice extent is an indicator for the effects of climate change in the polar regions, while also offering insights into the interannual variability of the sea-ice cover.
Data provided by the University of Bremen’s Institute of Environmental Physics (IUP) in collaboration with the Alfred Wegener Institute, Helmholtz Centre for Polar and Marine Research (AWI). You can find further information on the base data and additional maps at our data portal.

Sea-ice concentration, updated daily
Sea-ice concentration, updated daily
The sea-ice concentration map shows the amount of sea-ice cover as a percentage.
An ice concentration of 100% indicates a seamless sheet of sea ice. Ice concentrations of less than 15% are considered to be ice-free.
The green line is a climatological reference value and shows the monthly mean sea-ice extent for the years 1981 – 2010. The sea-ice extent is the sum of all ice-covered regions (i.e., all regions with an ice concentration of at least 15%) and is measured in millions of square kilometres.
Data provided by the University of Bremen’s Institute of Environmental Physics (IUP) in collaboration with the Alfred Wegener Institute, Helmholtz Centre for Polar and Marine Research (AWI). You can find further information on the base data and additional maps at our data portal.

Sea-ice extent, annual cycle
Sea-ice extent, annual cycle
The annual cycle of the sea-ice extent describes the total ice-covered area in the Arctic or Antarctic in millions of square kilometres, using the data from the current year (blue line) in comparison to past years. The sea-ice extent is the sum of all ice-covered regions with an ice concentration of at least 15%.
For the sake of comparison, the respective previous year and the year with the lowest summer sea-ice extent to date (2012) are shown, together with the climatological mean value for the years 1981 – 2010 (green line) and the span of the minimum / maximum values (green lines) during this period.
Data provided by the University of Bremen’s Institute of Environmental Physics (IUP) in collaboration with the Alfred Wegener Institute, Helmholtz Centre for Polar and Marine Research (AWI). You can find further information on the base data and additional maps at our data portal.

The last month compared to past years
The last month compared to past years
Since 1979, the extent of the polar sea ice has been continually monitored using satellites. The graphic shows the respective monthly mean values for the ice extent in the years 1979 to the present. Here, long-term trends in the sea-ice cover of both the Arctic and Antarctic can be seen. As such, the development of the mean monthly sea-ice extent is an indicator for the effects of climate change in the polar regions, while also offering insights into the interannual variability of the sea-ice cover.
Data provided by the University of Bremen’s Institute of Environmental Physics (IUP) in collaboration with the Alfred Wegener Institute, Helmholtz Centre for Polar and Marine Research (AWI). You can find further information on the base data and additional maps at our data portal.

Sea Ice for Beginners
You’re interested in sea ice and are looking for an overview? Then you’ve come to the right place! We’ll explain the most important basics. Where does sea ice come from? Where can it be found? And what part does it play in the Earth system?
Learn More
You’ve had your first taste and want to learn even more? Here you’ll find extensive and focused texts that go into more depth. You’ll learn more about sea-ice physics, sea-ice modelling, measuring methods and the diversity of life on and within sea ice.
Where is the Polarstern?
The AWI’s flagship, RV Polarstern, is constantly underway in the name of science. Here you’ll learn where she is right now.

With the new option of quickly and easily creating animations for any given period, we’ve added an important and unique component to the information portal. At the same time, by improving the navigation in the ‘Maps & Graphics’ section, we have responded to feedback from our users. As a result, the diverse products available in the ‘Maps & Graphics’ section can now be quickly and easily found